-
Notifications
You must be signed in to change notification settings - Fork 2
Metrics
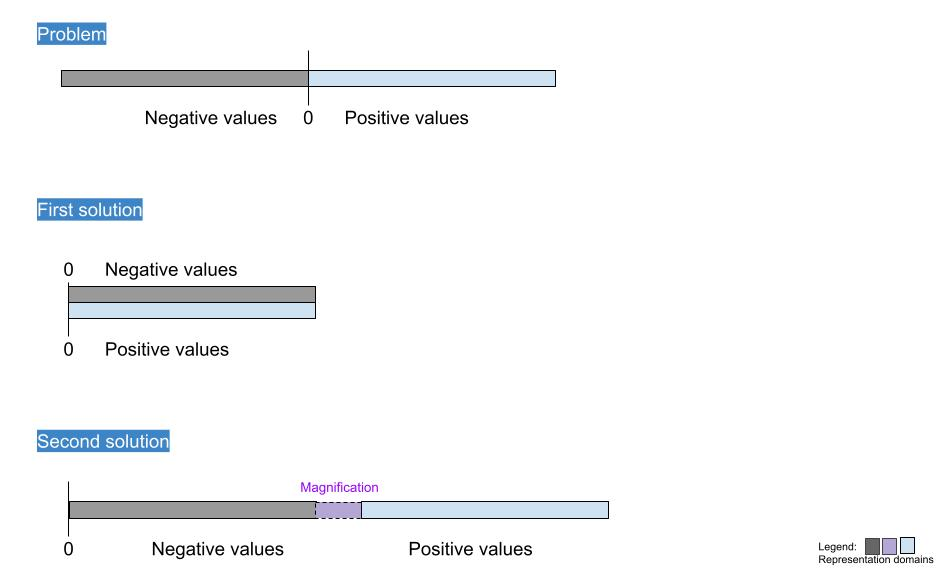
Methods are aimed to be provided in this issue to display both negative and positive values while preserving visual logic.
 {width="529" height="320"}
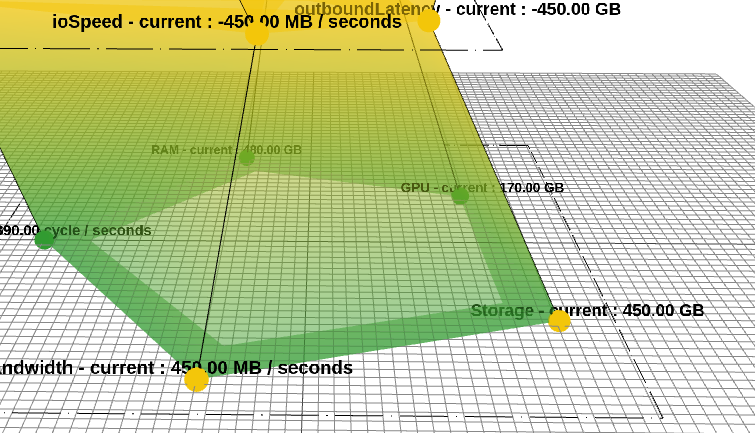
A specific use case, dc_negativeValuesConfiguration, was developed where some negative and positive values were introduced.
A configurable distance negativeValuesMagnifier between negative and positive values was introduced to allow for differentiation between them.
 {width="493" height="283"}
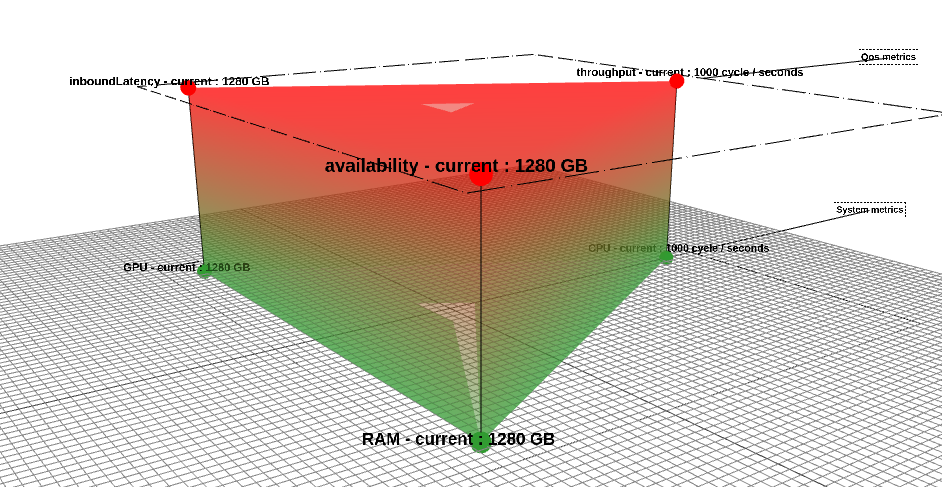
The use case dc_MetricDirectionConfiguration has been incorporated.
For each metric in the initial layer, the metricDirection key is set to "ascending", indicating that higher values are preferable.
The concept is that when metricDirection is set to "ascending", color inversion occurs. By default, it is set to "descending", indicating that lower values are preferable.
{
        "systemMetrics": {
            "metrics": {
                "cpu": {
                    "label": "CPU",
                    "unit": "cycle / seconds",
                    "min": 100,
                    "med": 500,
                    "max": 1000,
                    "current": 1000,
                    "metricDirection": "ascending"
                },
                "ram": {
                    "label": "RAM",
                    "unit": "GB",
                    "min": 160,
                    "med": 640,
                    "max": 1280,
                    "current": 1280,
                    "metricDirection": "ascending"
                },
                "gpu": {
                    "label": "GPU",
                    "unit": "GB",
                    "min": 160,
                    "med": 640,
                    "max": 1280,
                    "current": 1280,
                    "metricDirection": "ascending"
                },
            },
            "layer": {
                "systemMetrics-layer": {
                    "label": "System metrics",
                },
            },
        },
        "qosMetrics": {
            "metrics": {
                "throughput": {
                    "label": "throughput",
                    "unit": "cycle / seconds",
                    "min": 100,
                    "med": 500,
                    "max": 1000,
                    "current": 1000
                },
                "availability": {
                    "label": "availability",
                    "unit": "GB",
                    "min": 160,
                    "med": 640,
                    "max": 1280,
                    "current": 1280
                },
                "inboundLatency": {
                    "label": "inboundLatency",
                    "unit": "GB",
                    "min": 120,
                    "med": 640,
                    "max": 1280,
                    "current": 1280
                }
            },
            "layer": {
                "qosMetrics-layer": {
                    "label": "Qos metrics",
                }
            }
        }
    }
The data structure described above gives this final result:
 {width="548" height="283"}
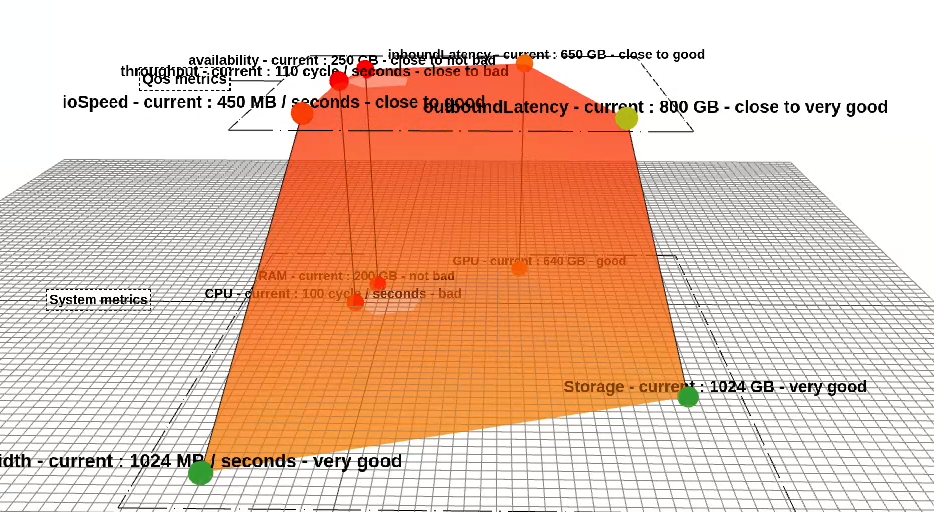
We have implemented a states system, allowing retrieval of not only numerical values but also states from Palindrome.js.
A new use case called dcMetricStates has been created to demonstrate metric states.
Instead of using "min", "med", "max", and "current" keys, metrics values are now represented by keys such as "bad", "not bad", "good", "very good", and "current" as shown in the data structure below:
{
        "systemMetrics": {
            "metrics": {
                "cpu": {
                    "label": "CPU",
                    "unit": "cycle / seconds",
                    "bad": 100,
                    "not bad": 200,
                    "good": 500,
                    "very good": 1000,
                    "current": 100,
                    "metricDirection": "ascending"
                },
                "ram": {
                    "label": "RAM",
                    "unit": "GB",
                    "bad": 160,
                    "not bad": 200,
                    "good": 640,
                    "very good": 1280,
                    "current": 200,
                    "metricDirection": "ascending"
                },
                "gpu": {
                    "label": "GPU",
                    "unit": "GB",
                    "bad": 160,
                    "good": 640,
                    "very good": 1280,
                    "current": 640,
                    "metricDirection": "ascending"
                },
                "storage": {
                    "label": "Storage",
                    "unit": "GB",
                    "bad": 102,
                    "good": 512,
                    "very good": 1024,
                    "current": 1024,
                    "metricDirection": "ascending"
                },
                "bandwidth": {
                    "label": "Bandwidth",
                    "unit": "MB / seconds",
                    "bad": 102,
                    "good": 512,
                    "very good": 1024,
                    "current": 1024,
                    "metricDirection": "ascending"
                }
            },
            "layer": {
                "systemMetrics-layer": {
                    "label": "System metrics",
                    "layerMetricsUnits": "something",
                },
            },
        },
        "qosMetrics": {
            "metrics": {
                "throughput": {
                    "label": "throughput",
                    "unit": "cycle / seconds",
                    "bad": 100,
                    "not bad": 200,
                    "good": 500,
                    "very good": 1000,
                    "current": 110,
                    "metricDirection": "ascending"
                },
                "availability": {
                    "label": "availability",
                    "unit": "GB",
                    "bad": 160,
                    "not bad": 200,
                    "good": 640,
                    "very good": 1280,
                    "current": 250,
                    "metricDirection": "ascending"
                },
                "inboundLatency": {
                    "label": "inboundLatency",
                    "unit": "GB",
                    "bad": 120,
                    "not bad": 200,
                    "good": 640,
                    "very good": 1280,
                    "current": 650,
                    "metricDirection": "ascending"
                },
                "outboundLatency": {
                    "label": "outboundLatency",
                    "unit": "GB",
                    "bad": 102,
                    "not bad": 200,
                    "good": 512,
                    "very good": 1024,
                    "current": 800,
                    "metricDirection": "ascending"
                },
                "ioSpeed": {
                    "label": "ioSpeed",
                    "unit": "MB / seconds",
                    "bad": 102,
                    "not bad": 200,
                    "good": 512,
                    "very good": 1024,
                    "current": 450,
                    "metricDirection": "ascending"
                }
            },
            "layer": {
                "qosMetrics-layer": {
                    "label": "Qos metrics",
                    "layerMetricsUnits": "something",
                }
            }
        }
    }
Regardless of the input keys used by the user in the data structure, the minimum, median, and maximum values are calculated automatically. The "min" value is determined as the minimum among the user-defined keys "bad", "not bad", "good", "very good", etc., and the same applies to the maximum value.
 {width="538" height="295"}