An open-source profiler plugin for JDK 11+ based on JFR, async-profiler and Firefox Profiler.
This plugin supports
- profiling your Java applications directly in IntelliJ
- with JFR and async-profiler
- viewing JFR files
- showing flamegraphs, call trees and more
It allows you to profile your Java application with JFR and async-profiler and view the results in IntelliJ IDEA, as well as opening JFR files.
This plugin is currently under heavy development; feel free to try it and open issues for any bugs or suggestions.
See my blog post Firefox Profiler beyond the web for a detailed description and how I ended up there.
In the following a few screenshots.
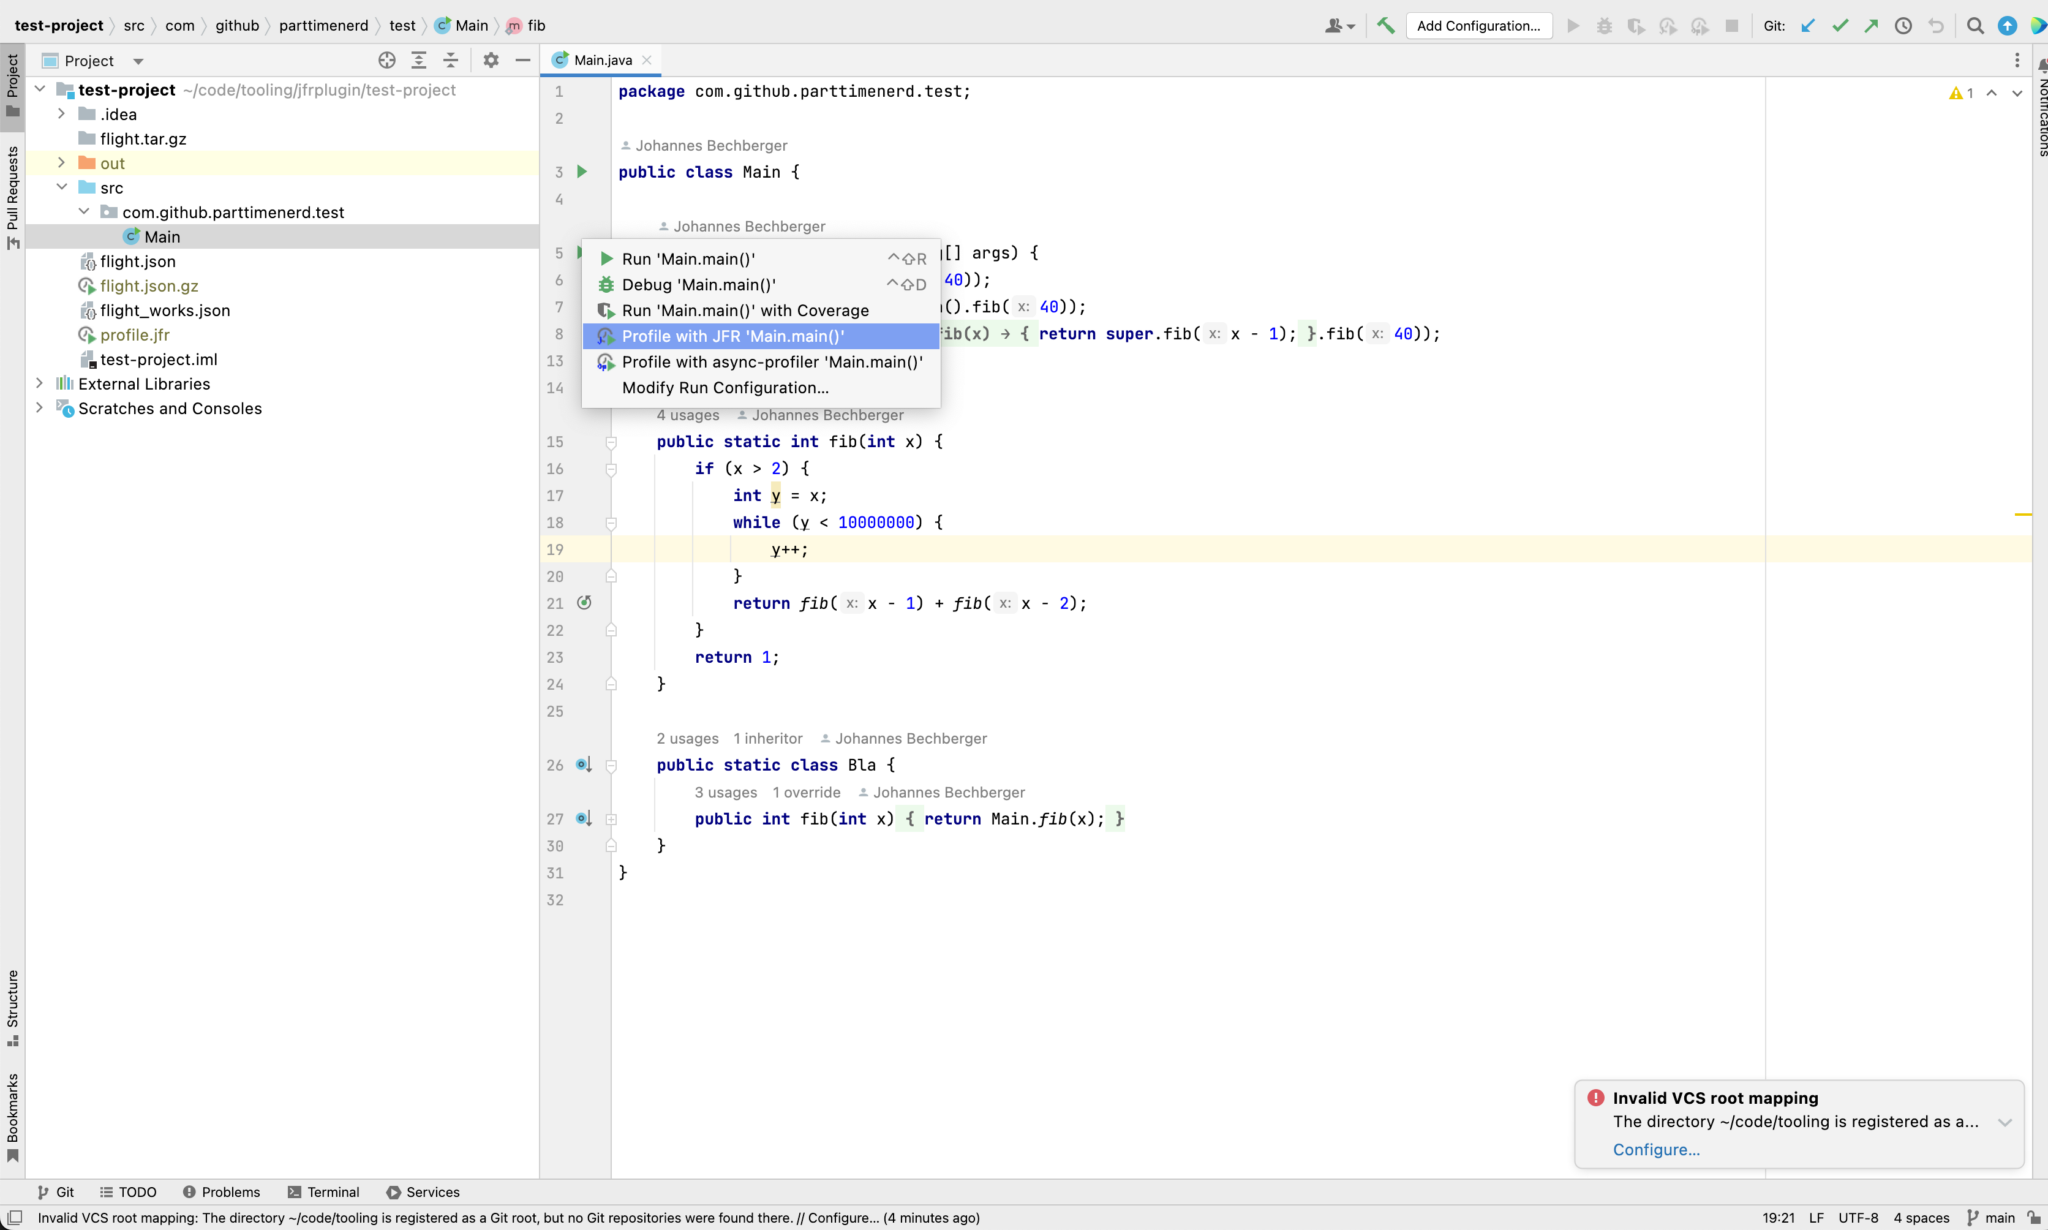
My plugin adds a context menu for profiling:
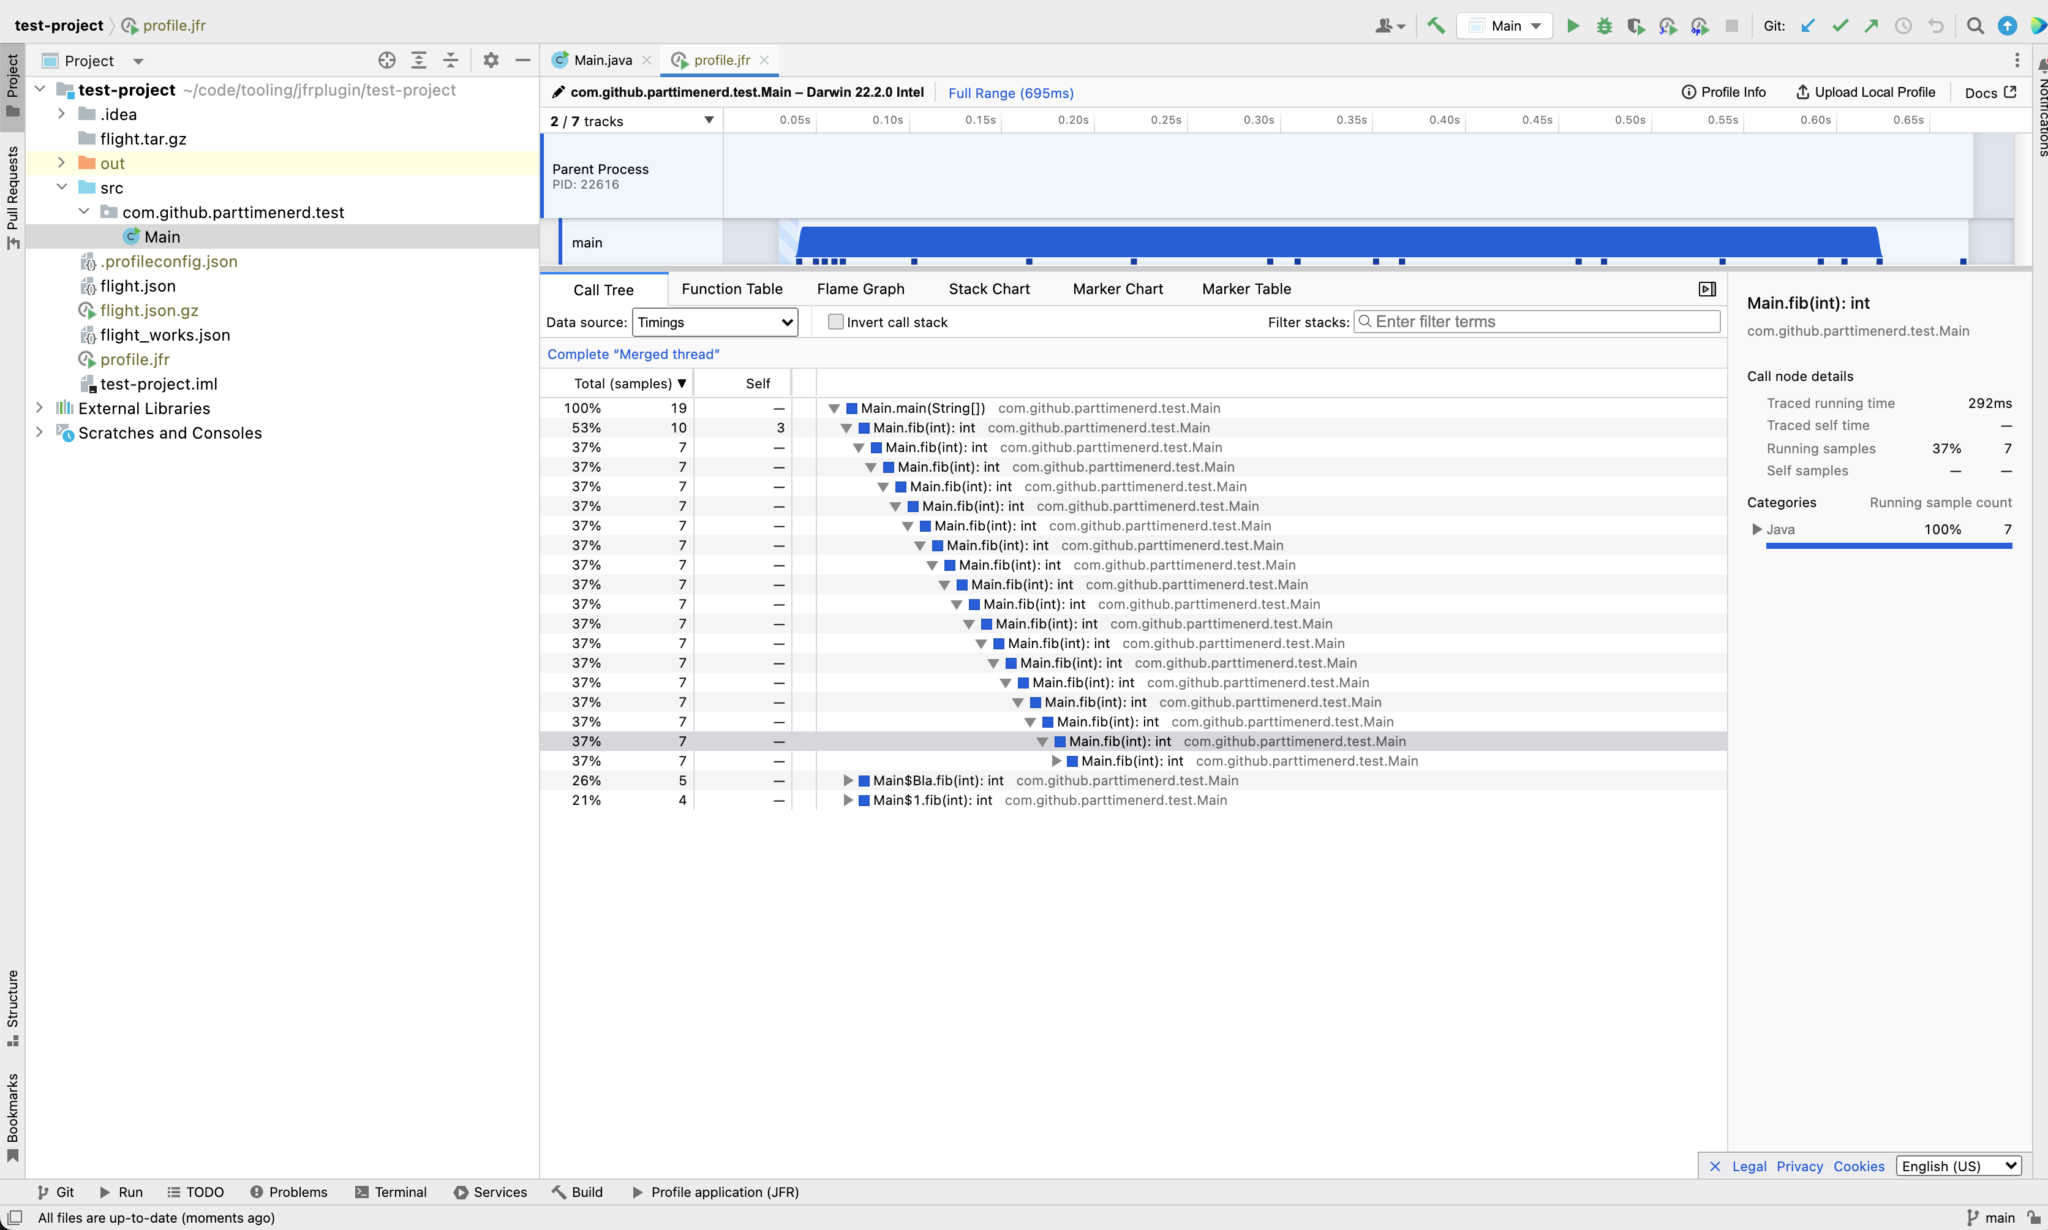
And opens the profile automatically afterwards. But you can open arbitrary JFR files:
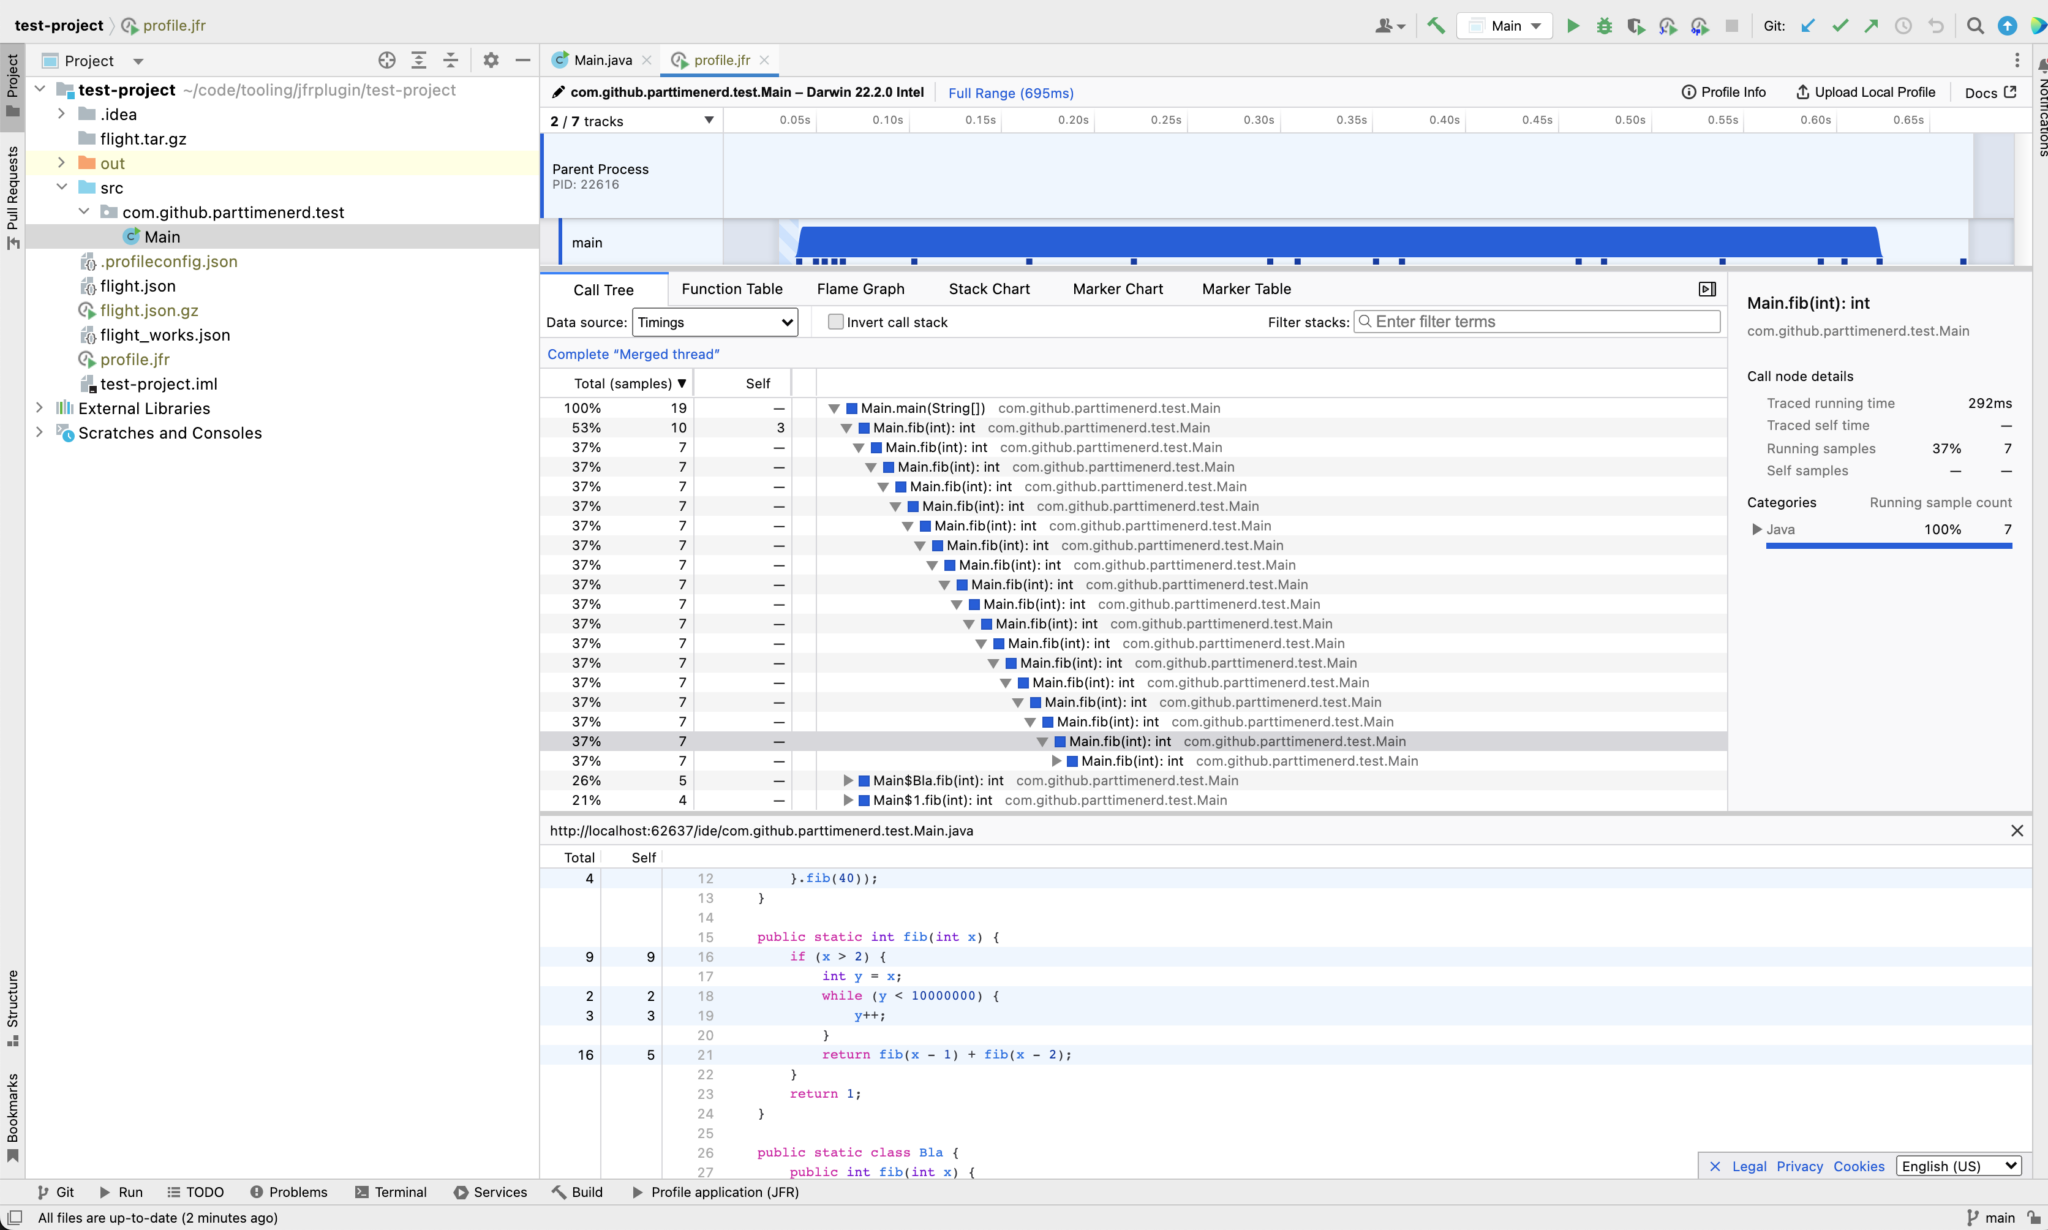
You can double-click on a method in the profiler and thereby navigate to the method in the IDE, or you can shift-double-click and view the source code directly in the profiler, with some additional information on the left:
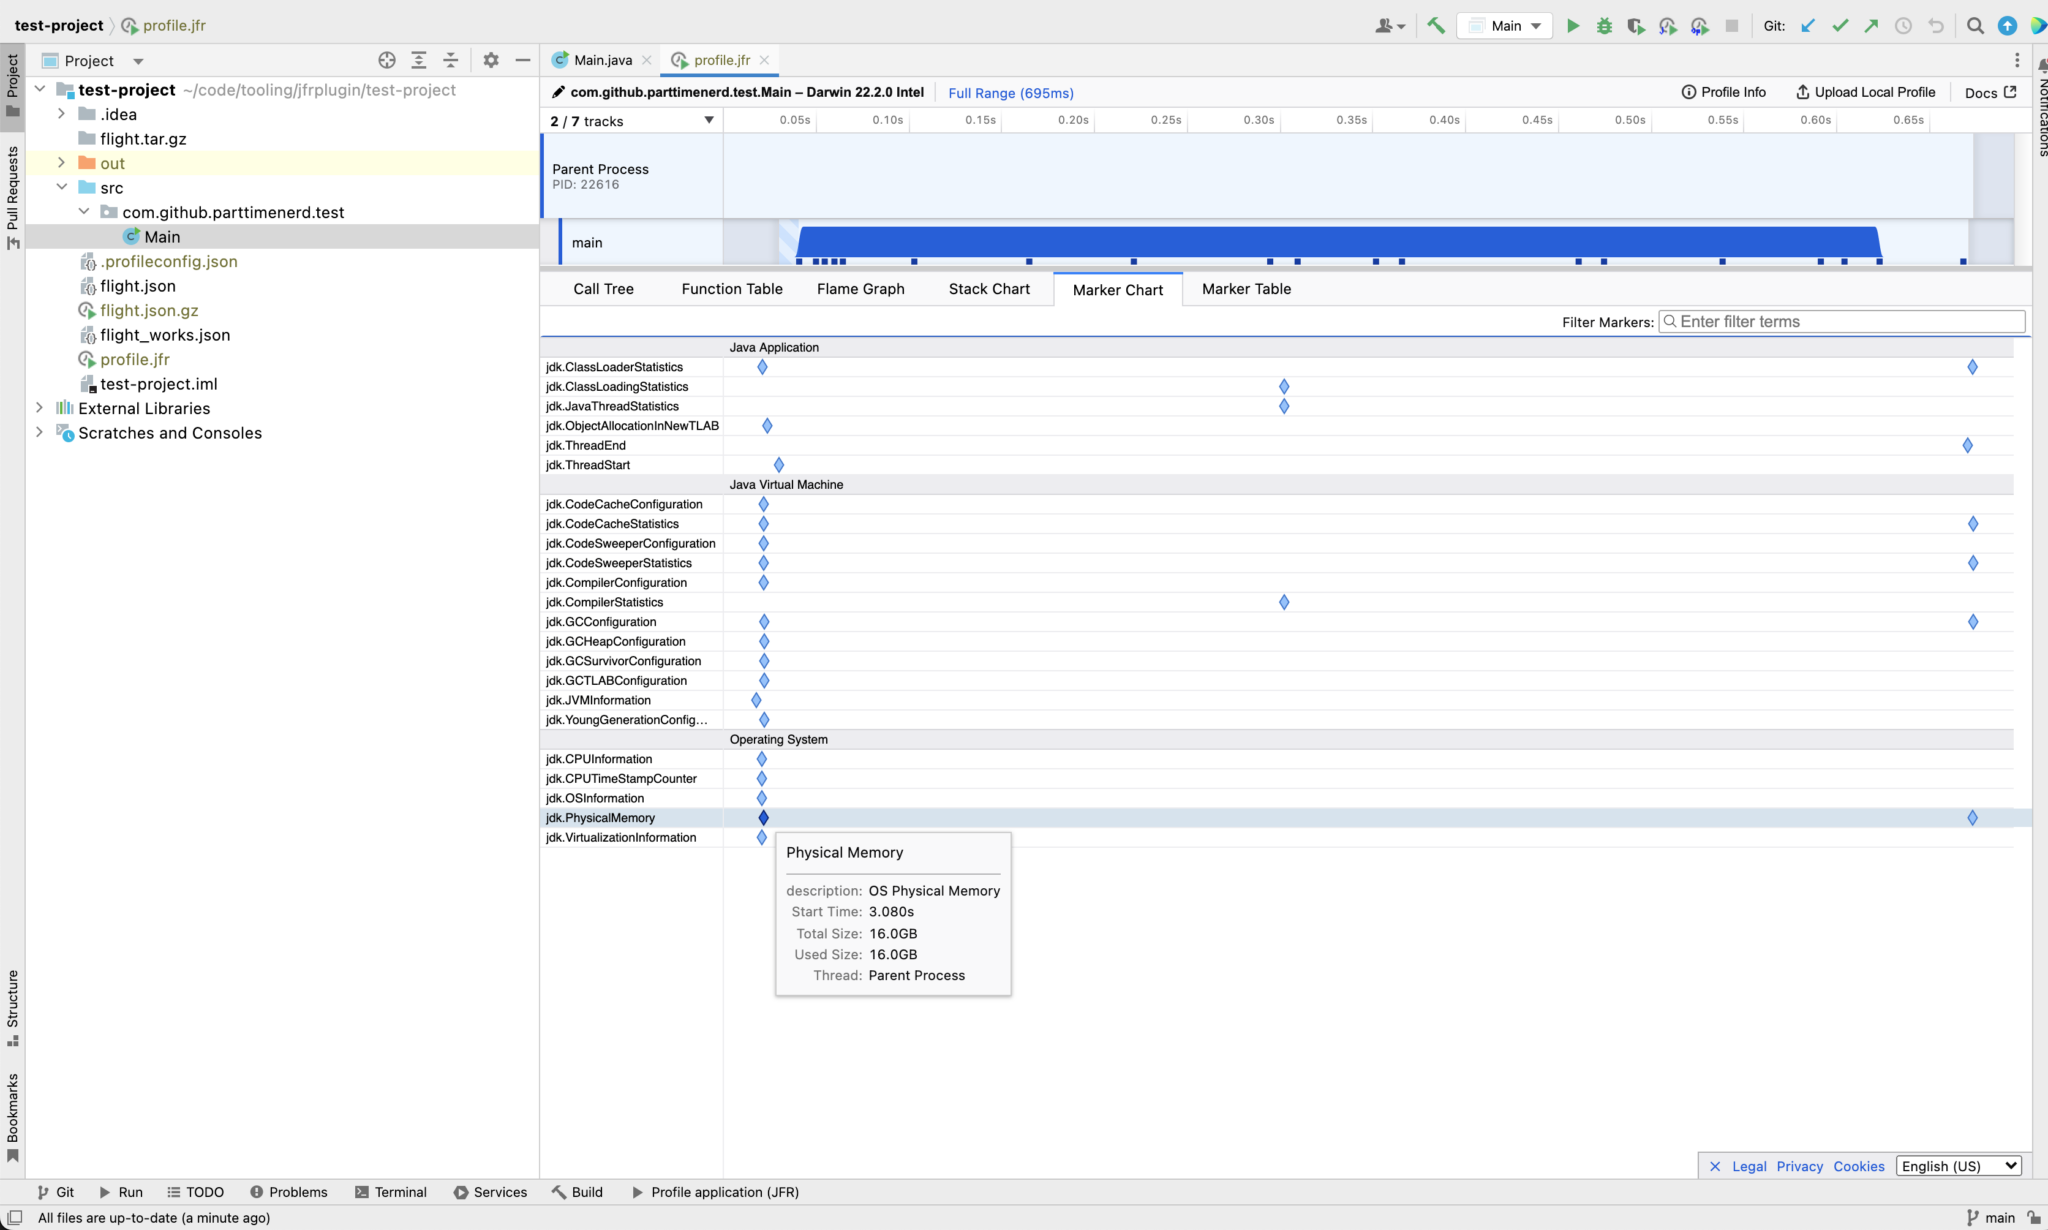
Besides that, it has support for showing information on all JFR events:
It is available as Java JFR Profiler in the JetBrains marketplace.
You can also download the latest version from here and install it manually in IntelliJ using the "Install Plugin from Disk" action.
It is essentially a thin wrapper around the jfrtofp-server library which is a bundle of the JFR to FirefoxProfiler converter and a custom firefox profiler distribution which includes many of our own PRs which are not yet upstream.
It uses ap-loader for async-profiler integration.
It is the first fully fledged open source IntelliJ profiler plugin, so give it a try!
- run JFR with some settings on all run configurations
- be the bridge between simpler tools (like the profiler integrated into IntelliJ Ultimate) and the more advanced tools (like JDK Mission Control)
- fully fledged analysis
- JDK Mission Control replacement
MIT


