This sample demonstrates how to create a WinForms Pivot Chart using the Syncfusion® PivotChart control.
- Visual Studio 2022 or later
- .NET 10.0 or later
- Syncfusion® license key (learn more)
Important: Starting with v16.2.0.x, if you refer to Syncfusion® assemblies from trial setup or from the NuGet feed, include a license key in your projects.
Add the following NuGet packages to the project:
| Package |
|---|
| Syncfusion.Chart.Windows |
| Syncfusion.Grid.Windows |
| Syncfusion.PivotChart.Windows |
- Open Visual Studio and create a new Windows Forms App project.
- Name the project (e.g.,
WinFormsPivotChart) and select the target framework.
Initialize a new PivotChart instance and add it to the form:
// Initialize a new PivotChart.
Syncfusion.Windows.Forms.PivotChart.PivotChart pivotChart1 = new Syncfusion.Windows.Forms.PivotChart.PivotChart();

// Add the PivotChart control to the parent control.
this.Controls.Add(pivotChart1);The data source assigned to the pivot chart control should be an IEnumerable list or a DataView. In this example, an IEnumerable list is used as the data source with properties such as Product, Date, Country, State, Quantity, Amount, UnitPrice, and TotalPrice.
public class ProductSales
{
    public string Product { get; set; }
    public string Date { get; set; }
    public string Country { get; set; }
    public string State { get; set; }
    public int Quantity { get; set; }
    public double Amount { get; set; }
    public double UnitPrice { get; set; }
    public double TotalPrice { get; set; }

    public static ProductSalesCollection GetSalesData()
    {
        string[] countries = new string[] { "Australia", "Germany", "Canada", "United States" };
        string[] states1 = new string[] { "New South Wales", "Queensland" };
        string[] states2 = new string[] { "Ontario", "Quebec" };
        string[] states3 = new string[] { "Bayern", "Brandenburg" };
        string[] states4 = new string[] { "New York", "Colorado", "New Mexico" };
        string[] dates = new string[] { "FY 2008", "FY 2009", "FY 2010", "FY 2011", "FY 2012" };
        string[] products = new string[] { "Bike" };

        Random r = new Random(123345);
        int numberOfRecords = 2000;
        ProductSalesCollection listOfProductSales = new ProductSalesCollection();

        for (int i = 0; i < numberOfRecords; i++)
        {
            ProductSales sales = new ProductSales();
            sales.Country = countries[r.Next(1, countries.GetLength(0))];
            sales.Quantity = r.Next(1, 12);
            double discount = (30000 * sales.Quantity) * (double.Parse(sales.Quantity.ToString()) / 100);
            sales.Amount = (30000 * sales.Quantity) - discount;
            sales.TotalPrice = sales.Amount * sales.Quantity;
            sales.UnitPrice = sales.Amount / sales.Quantity;
            sales.Date = dates[r.Next(r.Next(dates.GetLength(0) + 1))];
            sales.Product = products[r.Next(r.Next(products.GetLength(0) + 1))];
            switch (sales.Country)
            {
                case "Australia": sales.State = states1[r.Next(states1.GetLength(0))]; break;
                case "Canada":    sales.State = states2[r.Next(states2.GetLength(0))]; break;
                case "Germany":   sales.State = states3[r.Next(states3.GetLength(0))]; break;
                case "United States": sales.State = states4[r.Next(states4.GetLength(0))]; break;
            }
            listOfProductSales.Add(sales);
        }
        return listOfProductSales;
    }

    public class ProductSalesCollection : List<ProductSales> { }
}The pivot chart control requires the following information to populate data from the data source:
| Property | Description |
|---|---|
ItemSource |
The data source (IEnumerable list or DataTable) |
PivotAxis |
Elements added to the axis of the pivot chart |
PivotLegend |
Elements added to the legend of the pivot chart |
PivotCalculations |
Calculation values added as data points to the pivot chart |
// Specifying the Item Source for Pivot Chart
this.pivotChart1.ItemSource = ProductSales.GetSalesData();

// Adding PivotAxis to the Control
this.pivotChart1.PivotAxis.Add(new PivotItem { FieldMappingName = "Product", TotalHeader = "Total" });
this.pivotChart1.PivotAxis.Add(new PivotItem { FieldMappingName = "Country", TotalHeader = "Total" });
this.pivotChart1.PivotAxis.Add(new PivotItem { FieldMappingName = "State",   TotalHeader = "Total" });

// Adding PivotLegend to the Control
this.pivotChart1.PivotLegend.Add(new PivotItem { FieldMappingName = "Date", TotalHeader = "Total" });

// Adding PivotCalculations to the Control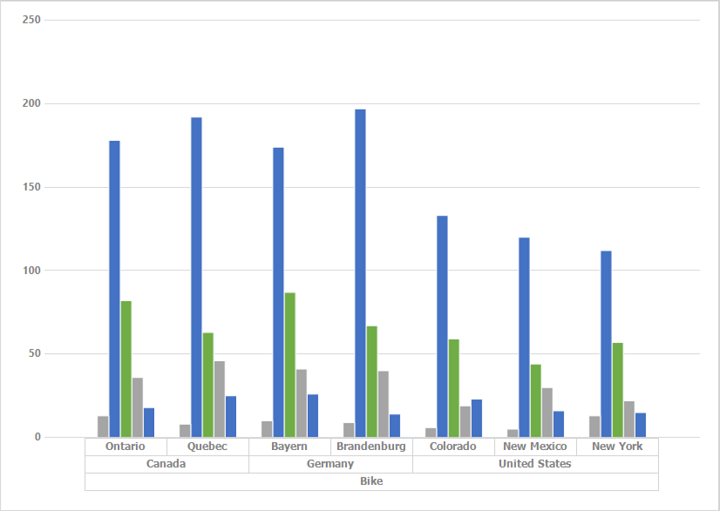
this.pivotChart1.PivotCalculations.Add(new PivotComputationInfo { FieldName = "Quantity", Format = "#,##0" });Run the application. The pivot chart will be displayed with the bound data as shown below.
PivotChartUpdatingManager provides support for updating series values automatically whenever the underlying data changes. Enable this by setting the EnableUpdating property to true.
// Updates the PivotChart series values whenever the data changes in the underlying data source.
this.pivotChart1.EnableUpdating = true;
Note: The default value of the
EnableUpdatingproperty isfalse.
When making multiple changes to the underlying data source, wrap the changes between BeginUpdate and EndUpdate to improve performance by temporarily freezing the control's painting:
// Suspends the painting until EndUpdate is invoked
this.pivotChart1.BeginUpdate();

// Perform bulk changes here

// Resumes the painting
this.pivotChart1.EndUpdate();