├── Image/
├── Data/
│
├── README.md                                            <- read me
├── theLook_SQL_code.ipynb                               <- SQL code
├── theLook_rfm_delivery_time_series_analysis.ipynb      <- Python code
├── theLook - presentation                               <- slide pdf
TheLook is a fictitious eCommerce clothing site developed by the Looker team. The dataset contains information about customers, products, orders, logistics, and web events.
- Data source: https://console.cloud.google.com/marketplace/product/bigquery-public-data/thelook-ecommerce?hl=en&project=causal-flame-283208
- ER Diagram

- 7 Tables & Columns
| Table Name | Columns |
|---|---|
| users | id, first_name, last_name, email, age, gender, state, street_address, postal_code, city, country, latitude, longitude, traffic_source, created_at |
| order_items | id, order_id, user_id, product_id, inventory_item_id, status, created_at, shipped_at, delivered_at, returned_at, sale_price |
| distribution_centers | id, name, latitude, longitude |
| inventory_items | id, product_id, created_at, sold_at, cost, product_category, product_name, product_brand, product_retail_price, product_department, product_sku, product_distribution_center_id |
| products | id, cost, category, name, brand, retail_price, department, sku, distribution_center_id |
| orders | order_id, user_id, status, gender, created_at, returned_at, shipped_at, delivered_at, num_of_item |
| events | id, user_id, sequence_number, session_id, created_at, ip_address, city, state, postal_code, browser, traffic_source, uri, event_type |
The goal is to utilize SQL queries to delve into the dataset and extract valuable insights that can enhance business performance for theLook. This includes areas such as sales optimization, marketing effectiveness, and supply chain management efficiency.
- Performance in 2024 Jan
| Total Revenue ($) | Total Cost ($) | Gross Profit ($) |
|---|---|---|
| 429,657.13 | 206,967.73 | 222,689.4 |
- Regional performance in 2024 Jan (Order by Reve DESC)
| Country | Total Revenue ($) | Total Cost ($) | Gross Profit ($) |
|---|---|---|---|
| China | 138,467.32 | 66,301.64 | 72,165.68 |
| United States | 100,700.23 | 48,801.18 | 51,899.05 |
| Brasil | 68,657.79 | 33,080.71 | 35,577.08 |
| South Korea | 24,216.06 | 11,705.37 | 12,510.69 |
| France | 19,089.77 | 9,207.04 | 9,882.73 |
| Germany | 18,142.38 | 8,816.84 | 9,325.54 |
| United Kingdom | 18,110.54 | 8,781.01 | 9,329.53 |
| Spain | 14,955.57 | 7,135.92 | 7,819.65 |
| Japan | 10,533.59 | 5,087.42 | 5,446.17 |
| Australia | 9,433.03 | 4,496.55 | 4,936.48 |
| Belgium | 6,197.96 | 2,996.5 | 3,201.46 |
| Poland | 1,002.05 | 492.47 | 509.58 |
| Colombia | 150.84 | 65.08 | 85.76 |
- 2023-01~2024-1


| Year | Month | Total Revenue ($) | Total Cost ($) | Gross Profit ($) |
|---|---|---|---|---|
| 2024 | 1 | 429,657.13 | 206,967.73 | 222,689.4 |
| 2023 | 12 | 366,083.04 | 175,276.49 | 190,806.55 |
| 2023 | 11 | 341,790.55 | 163,669.56 | 178,120.99 |
| 2023 | 10 | 312,906.78 | 150,547.74 | 162,359.05 |
| 2023 | 9 | 291,911.42 | 140,918.17 | 150,993.25 |
| 2023 | 8 | 276,600.05 | 133,256.34 | 143,343.71 |
| 2023 | 7 | 273,314.5 | 130,706.16 | 142,608.34 |
| 2023 | 6 | 236,056.66 | 112,967.63 | 123,089.03 |
| 2023 | 5 | 235,039.45 | 113,266.13 | 121,773.32 |
| 2023 | 4 | 222,483.69 | 107,225.3 | 115,258.39 |
| 2023 | 3 | 198,496.66 | 94,973.58 | 103,523.08 |
| 2023 | 2 | 178,984.28 | 85,470.73 | 93,513.56 |
| 2023 | 1 | 182,464.59 | 87,242.47 | 95,222.12 |
- top 10 popular category

| Category | Total Revenue ($) |
|---|---|
| Outerwear & Coats | 55,557.22 |
| Jeans | 52,617.5 |
| Sweaters | 31,206.6 |
| Suits & Sport Coats | 26,493.46 |
| Swim | 25,270.88 |
| Fashion Hoodies & Sweatshirts | 24,710.82 |
| Sleep & Lounge | 23,366.28 |
| Shorts | 20,524.36 |
| Tops & Tees | 18,505.96 |
| Intimates | 17,674.01 |
- top 10 popular brand
| Brand | Total Revenue ($) |
|---|---|
| Diesel | 9,709.7 |
| Calvin Klein | 8,587.29 |
| True Religion | 7,937.47 |
| Carhartt | 7,439.68 |
| 7 For All Mankind | 6,021.58 |
| Joe's Jeans | 4,834.69 |
| Columbia | 4,274.04 |
| Tommy Hilfiger | 4,005.61 |
| Volcom | 3,838.44 |
| Allegra K | 3,805.76 |
- top 10 popular product
| Name | Total Revenue | Total Cost | Gross Profit | Unit Sold |
|---|---|---|---|---|
| Diesel Men's Lisardo Jacket | 1,516 | 670.07 | 845.93 | 2 |
| Canada Goose Men's Lodge Jacket | 1,200 | 532.8 | 667.2 | 3 |
| Nicole Miller Women's Halter Jumpsuit | 1,100 | 612.7 | 487.3 | 2 |
| Alpha Industries Rip Stop Short | 999 | 482.52 | 516.48 | 1 |
| Nobis Yatesy Parka | 950 | 381.9 | 568.1 | 1 |
| The North Face Apex Bionic Soft Shell Jacket - Men's | 903 | 391.9 | 511.1 | 1 |
| Jordan Low Quarter Sock Style # 427411 | 903 | 537.29 | 365.71 | 1 |
| The North Face Women's S-XL Oso Jacket | 903 | 378.36 | 524.64 | 1 |
| Mens Nike AirJordan Varsity Hoodie Jacket Grey / Black 451582-066 | 903 | 409.06 | 493.94 | 1 |
| AIR JORDAN DOMINATE SHORTS MENS 465071-100 | 903 | 454.21 | 448.79 | 1 |
- Age Group profile

Young Adults: 20~35
Adults: 36~50
Seniors: 50+
- Country profile

- Gender profile

- Buying Behavior
| AOV ($) | APF (Times) | Customer Value ($) |
|---|---|---|
| 83.75 | 1.05 | 87.78 |
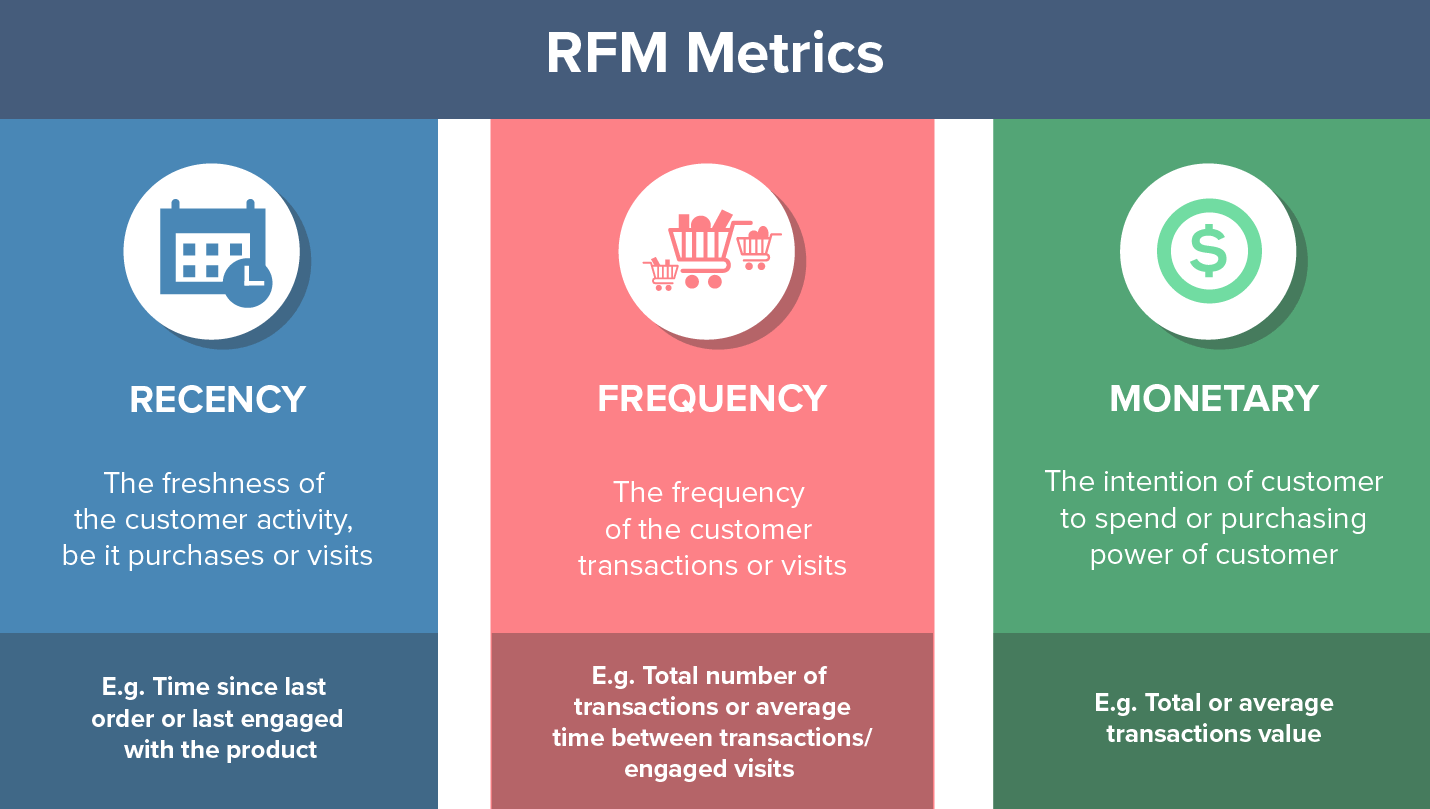
AOV: Average order value
APF: average purchase frequency - Number of purchases/number of customers
| Avg_recency (Day) | Avg_frequency (Times) | Avg_monetary ($) |
|---|---|---|
| 13.54 | 1.42 | 84.83 |

| Avg Lead Time (Day) | Avg Shipping Duration (Day) | |
|---|---|---|
| Overall | 3.09 | 2.51 |
| Domestic | 3.00 | 2.48 |
| Oversea | 3.12 | 2.53 |
Lead Time: created ~ delivered
Shipping duration: shipped ~ delivered
- Traffic source


| Segment | Description |
|---|---|
| Champions | Bought recently, buy often, and spend the most. |
| Loyal Customers | Buy on a regular basis and are responsive to promotions. |
| Potential Loyalist | Recent customers with average frequency. |
| Recent Customers | Bought most recently but not often. |
| Promising | Recent shoppers who haven't spent much. |
| Customers Needing Attention | Above-average recency, frequency, and monetary values. May not have bought very recently. |
| About To Sleep | Below-average recency and frequency. Will lose them if not reactivated. |
| At Risk | Purchased often but a long time ago. Need to bring them back! |
| Can’t Lose Them | Used to purchase frequently but haven’t returned for a long time. |
| Hibernating | Last purchase was a long time ago with a low number of orders. May be lost. |
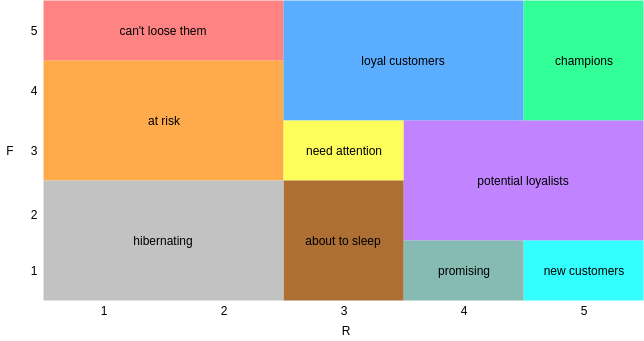
- RFM Analysis Result


- Action Plan
- Reevaluation of 10 distribution centers


The Elbow Method is a technique used in clustering analysis to determine the optimal number of clusters in a dataset. It is based on the concept that as the number of clusters increases, the within-cluster sum of squares (WSS) decreases.
Within-cluster Sum of Squares (WSS) :
where:
-
$K$ is the number of clusters. -
$C_i$ is the i-th cluster. -
$x$ is a data point in cluster$C_i$ . -
$c_i$ is the centroid of cluster$C_i$ . -
$||x - c_i||$ represents the Euclidean distance between data point x and its cluster centroid$c_i$ .
The WSS is a measure of how compact the clusters are, with lower WSS values indicating tighter clusters and better overall clustering.


| Description | Euclidean Distance (km) | Manhattan Distance (km) |
|---|---|---|
| Centroids distribution distance | 1,194,912.93 | 1,688,942.69 |
| Current DC distance | 7,090,704.85 | 10,185,974.77 |
| Diff km | 5,895,791.92 | 8,497,032.08 |
| % reduce | 83.15 % | 83.42 % |


Where:
-
$y(t)$ is the forecasted value at time$t$ . -
$g(t)$ represents the trend component. -
$s(t)$ represents the seasonal component. -
$h(t)$ represents the holiday effect component. -
$e(t)$ represents the residual component, capturing uncertainty or unexplained variations.
This additive composition allows Prophet to model complex time series patterns by combining trends, seasonalities, holiday effects, and residual fluctuations.
- Database design: some features are repetitive in different tables
- Database feature: more information should be incorporated
- Assumptions: synthetic data makes the data value dynamic
- Business value: lack of insider information to customize the business value
- Data model: for the time series model a more complex model can be developed to describe the pattern well
- Leveraged CRM monthly reports can identify the performance with ease
- RFM analysis benefits the customized marketing plan effectively and the matrics can be updated
- The location of distribution centers deserves to be reviewed and incorporated more business insider information to calculate the business value