ecodata is an R data package developed by the Ecosystems Dynamics and
Assessment Branch of the Northeast Fisheries Science Center for use in
State of the Ecosystem (SOE) reporting. SOE reports are high-level
overviews of ecosystem indicator status and trends occurring on the
Northeast Continental Shelf. Unless otherwise stated, data are
representative of specific Ecological Production Units (EPUs), referring
to the Mid-Atlantic Bight (MAB), Georges Bank (GB), Gulf of Maine (GOM),
and Scotian Shelf (SS). SOE reports are developed for US Fishery
Management Councils (FMCs), and therefore indicator data for Scotian
Shelf are included when available, but this is not always the case.
Please consult the technical documentation of SOE indicators before using data sets.
- Use the command
remotes::install_github("noaa-edab/ecodata",build_vignettes=TRUE)to install the package. - Load the package into your environment with
library(ecodata) - Further information about the
ecodatapackage can be found here.
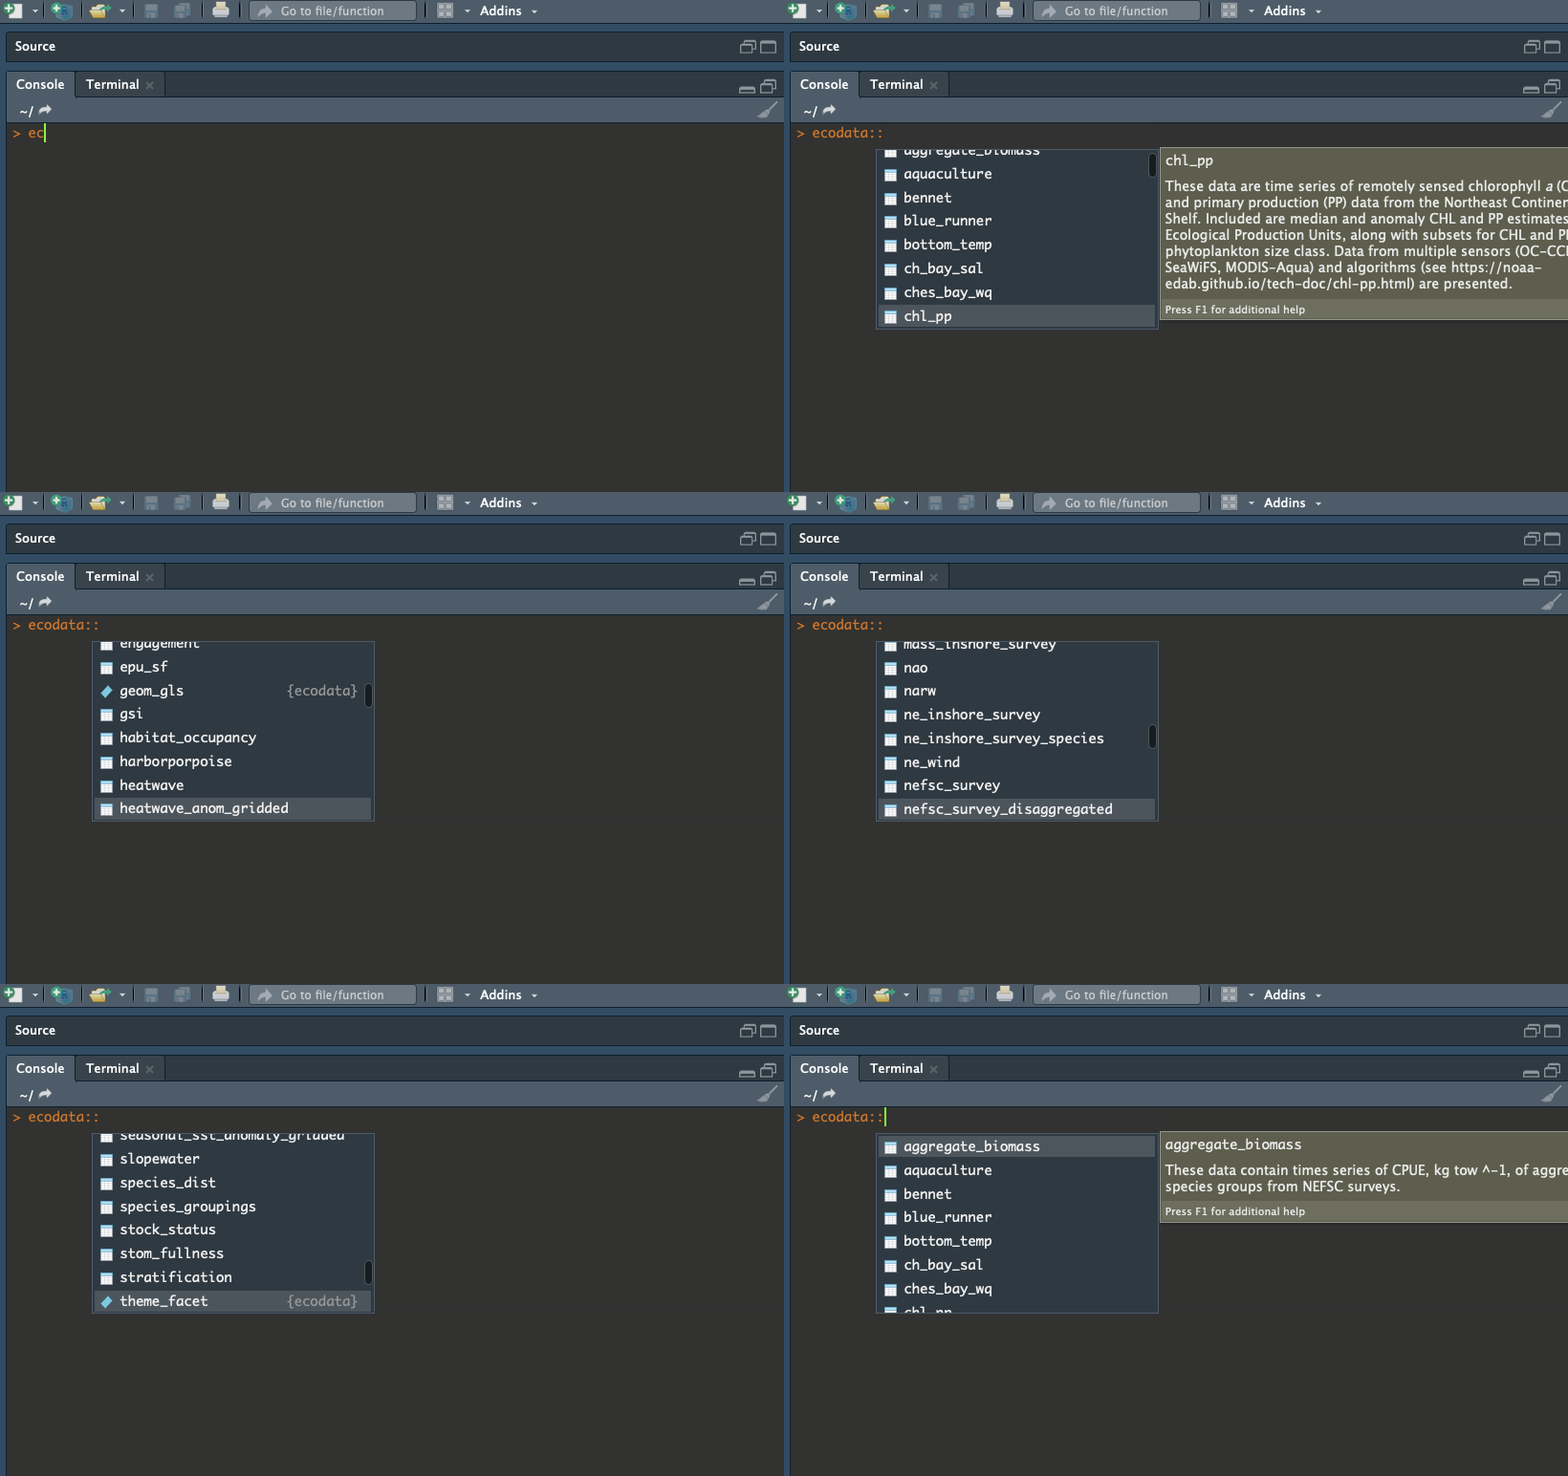
- All derived data sets are available once the package has been loaded
into the environment. View available data sets using the syntax
ecodata::...
Also included in this package is a “geom” extension of ggplot2 for
assessing trends in time series. This function fits four trend models to
each series, uses AICc to select the best model fit, and then implements
a likelihood-ratio test to determine if a trend is present. If a
significant trend is present (P < 0.05), then the trend line is
plotted with the series. By default, a purple line color is assigned to
negative trends and orange to positive trends. More detailed information
about this method is available
here.
geom_gls() follows the same rules as other ggplot stats/geoms. For
example,
m <- 0.1
x <- 1:30
y <-  m*x + rnorm(30, sd = 0.35)

data <- data.frame(x = x,
                  y = y)

#Plot series with trend
ggplot2::ggplot(data = data,aes(x = x, y = y)) +
  geom_line() +
  geom_gls()
produces
This repository is a scientific product and is not official communication of the National Oceanic and Atmospheric Administration, or the United States Department of Commerce. All NOAA GitHub project code is provided on an ‘as is’ basis and the user assumes responsibility for its use. Any claims against the Department of Commerce or Department of Commerce bureaus stemming from the use of this GitHub project will be governed by all applicable Federal law. Any reference to specific commercial products, processes, or services by service mark, trademark, manufacturer, or otherwise, does not constitute or imply their endorsement, recommendation or favoring by the Department of Commerce. The Department of Commerce seal and logo, or the seal and logo of a DOC bureau, shall not be used in any manner to imply endorsement of any commercial product or activity by DOC or the United States Government.
Organize
Reference by
datasets and functions in inst/_pkgdown.yml and update using:
update_datasets_reference <- function(){
  library(here)
  library(dplyr)
  library(yaml)

  yml <- here("inst/_pkgdown.yml")

  lst <- read_yaml(yml)
  # listviewer::jsonedit(lst)

  # inject reference to datasets
  datasets <- data(package="ecodata") %>% .$results %>% .[, "Item"]
  lst$reference <- list(
      title = "Datasets",
      contents = datasets)

  write_yaml(lst, yml)
}

# build just Reference index
pkgdown::build_reference_index()

# build whole documentation website into docs/*
pkgdown::build_site()
Note that when building, you’ll get alerted if datasets are missing or not included, eg:
> pkgdown::build_reference_index()
Writing 'reference/index.html'
Warning messages:
1: In '_pkgdown.yml', topic must be a known topic name or alias
x Not '`heatwave_year`'
2: In '_pkgdown.yml', topic must be a known topic name or alias
x Not '`seasonal_sst_anom_gridded`'
3: In '_pkgdown.yml', topic must be a known topic name or alias
x Not '`wind`'
4: Topics missing from index:
* ecodata
* seasonal_sst_anomaly_gridded
* soe
Aside: get all plot chunks mentioning given dataset for Uploader:
dataset <- "chl_pp"
res <- system(glue::glue("grep ecodata::{dataset} chunk-scripts/*", intern = T))
# todo: get just filenames
res

