

Warning: xltabr is in early development. Please raise an issue if you find any bugs
xltabr allows you to write formatted cross tabulations to Excel using openxlsx. It has been developed to help automate the process of publishing Official Statistics.
The package works best when the input dataframe is the output of a crosstabulation performed by reshape2:dcast. This allows the package to autorecognise various elements of the cross tabulation, which can be styled accordingly.
For example, given a crosstabulation ct produced by reshape2, the following code produces the table shown.
titles = c("Breakdown of car statistics", "Cross tabulation of drive and age against type*")
footers = "*age as of January 2015"
wb <- xltabr::auto_crosstab_to_wb(ct, titles = titles, footers = footers)
openxlsx::openXL(wb)
This readme provides a variety of examples of increasing complexity. It is based on a simulated dataset built into the package, which you can see here.
Much of xltabr utility comes from its ability to automatically format cross tabulations which have been produced by reshape2:dcast.
The package provides a core convenience function called xltabr::auto_crosstab_to_xl. This wraps more advanced functionality, at the cost of reducing flexibility.
The following code assumes you've read in the synthetic data as follows:
# Read in data
path <- system.file("extdata", "synthetic_data.csv", package="xltabr")
df <- read.csv(path, stringsAsFactors = FALSE)# Create a cross tabulation using reshape2
ct <- reshape2::dcast(df, drive + age ~ type, value.var= "value", margins=c("drive", "age"), fun.aggregate = sum)
ct <- dplyr::arrange(ct, -row_number())
# Use the main convenience function from xltabr to output to excel
wb <- xltabr::auto_crosstab_to_wb(ct) #wb is an openxlsx workbook object
openxlsx::openXL(wb)
There is also a convenience function to write a standard data.frame to Excel:
wb <- xltabr::auto_df_to_wb(mtcars)
openxlsx::openXL(wb)
titles = c("Breakdown of car statistics", "Cross tabulation of drive and age against type*")
footers = "*age as of January 2015"
wb <- xltabr::auto_crosstab_to_wb(ct, titles = titles, footers = footers)
openxlsx::openXL(wb)
path <- system.file("extdata", "styles_pub.xlsx", package = "xltabr")
cell_path <- system.file("extdata", "style_to_excel_number_format_alt.csv", package = "xltabr")

xltabr::set_style_path(path)
xltabr::set_cell_format_path(cell_path)

wb <- xltabr::auto_crosstab_to_wb(ct)
openxlsx::openXL(wb)

# Set paths back to default
xltabr::set_style_path()
xltabr::set_cell_format_path()
# Create second crosstab
ct2 <- reshape2::dcast(df, drive + age ~ colour, value.var= "value", margins=c("drive", "age"), fun.aggregate = sum)
ct2 <- dplyr::arrange(ct2, -row_number())

tab <- xltabr::auto_crosstab_to_wb(ct, titles = titles, footers = c(footers, ""), return_tab = TRUE)

titles2 = c("Table 2: More car statistics", "Cross tabulation of drive and age against colour*")
footers2 = "*age as of January 2015"
wb <- xltabr::auto_crosstab_to_wb(ct2, titles = titles2, footers = footers2, insert_below_tab = tab)
openxlsx::openXL(wb)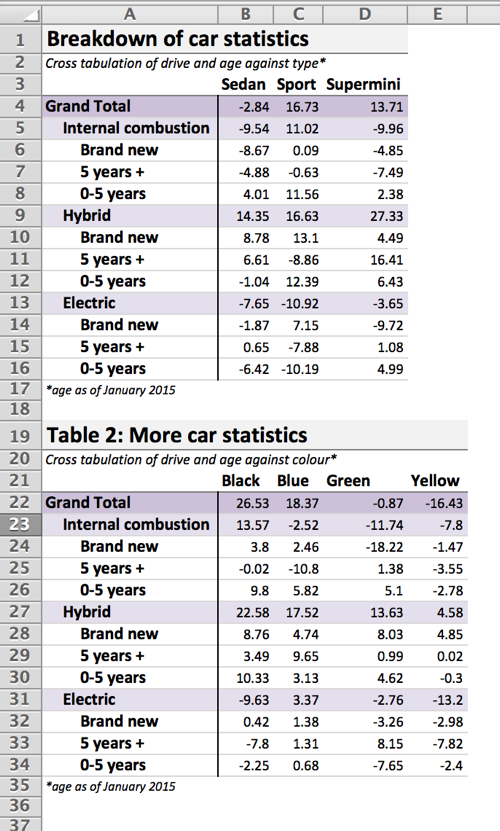
tab <- xltabr::auto_crosstab_to_wb(ct, titles = titles, footers = c(footers, ""), return_tab = TRUE)

xltabr::set_style_path(path)
xltabr::set_cell_format_path(cell_path)
wb <- xltabr::auto_crosstab_to_wb(ct2, titles = titles2, footers = footers2, insert_below_tab = tab)
openxlsx::openXL(wb)

# Change back to default
xltabr::set_style_path()
xltabr::set_cell_format_path()
ct <- reshape2::dcast(df, drive + age  ~ type, value.var= "value",  fun.aggregate = sum)
wb <- xltabr::auto_crosstab_to_wb(ct, titles = titles, footers = c(footers, ""), indent = FALSE, left_header_colnames = c("drive", "age"))
openxlsx::openXL(wb)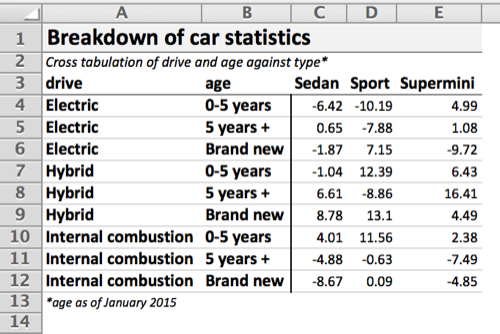
The following provides a list of all the options you can provide to auto_crosstab_to_wb
## Take a cross tabulation produced by 'reshape2::dcast' and output a formatted openxlsx wb object
##
## Description:
##
##      Take a cross tabulation produced by 'reshape2::dcast' and output a formatted openxlsx wb object
##
## Usage:
##
##      auto_crosstab_to_wb(df, auto_number_format = TRUE, top_headers = NULL,
##        titles = NULL, footers = NULL, auto_open = FALSE, indent = TRUE,
##        left_header_colnames = NULL, vertical_border = TRUE, styles_xlsx = NULL,
##        num_styles_csv = NULL, return_tab = FALSE, auto_merge = TRUE,
##        insert_below_tab = NULL)
##
## Arguments:
##
##       df: A data.frame.  The cross tabulation to convert to Excel
##
## auto_number_format: Whether to automatically detect number format
##
## top_headers: A list.  Custom top headers. See 'add_top_headers()'
##
##  footers: Table footers.  A character vector.  One element per row of footer.
##
## auto_open: Boolean. Automatically open Excel output.
##
##   indent: Automatically detect level of indentation of each row
##
## left_header_colnames: The names of the columns that you want to designate as left headers
##
## vertical_border: Boolean. Do you want a left border?
##
## styles_xlsx: File path (string).  If provided, the styles defined in this xlsx are used rather than the default. See here for template.
##
## return_tab: Boolean.  Return a tab object rather than a openxlsx workbook object
##
## auto_merge: Boolean.  Whether to merge cells in the title and footers to width of body
##
## insert_below_tab: A existing tab object.  If provided, this table will be written on the same sheet, below the provided tab.
##
##    title: The title.  A character vector.  One element per row of title
##
## num_styles_csv.: File path.  If provided, overrides the default number styles, which can be found here.
The simple examples above wrap lower-level functions. These functions can be used to customise the output in a number of ways.
The following example shows the range of functions available.
tab <- xltabr::initialise() %>%  #Options here for providing an existing workbook, changing worksheet name, and position of table in wb
  xltabr::add_title(title_text) %>% # Optional title_style_names allows user to specify formatting
  xltabr::add_top_headers(h_list) %>% # Optional row_style_names and col_style_names allows custom formatting
  xltabr::add_body(df) %>%  #Optional left_header_colnames, row_style_names, left_header_style_names col_style names
  xltabr::add_footer(footer_text) %>% # Optional footer_style_names
  xltabr:::auto_detect_left_headers() %>% # Auto detect left headers through presence of keyword, default = '(all)'
  xltabr:::auto_detect_body_title_level() %>% # Auto detect level of emphasis of each row in body, through presence of keyword
  xltabr:::auto_style_indent() %>% # Consolidate all left headers into a single column, with indentation to signify emphasis level
  xltabr::auto_merge_title_cells() %>% # merge the cells in the title
  xltabr::auto_merge_footer_cells() # merge the cells in the footer
The convenience functions contain further examples of how to build up a tab. See here.
See here