In our software development work lives, we have seen that, whatever the organization is, it produces tons of data along side with the organization business. To see / analyse those tons of data, we start being surprised seeing the fact that we have limited options to choose tools for analysis. Not all are “satisfactory”; having their own limitations:
- You need to be a bit techy to understand the underlying storage data structure (say, columns) and SQL-ing.
- You cannot extend the way of report making. The tool is not a framework so that you can reach your expectation.
We believe,
- with tons of data, we need tons of possibilities to see / analyse those data.
- with an unextendible (or closed-source) tool, a organization can never reach to its expected analysis goals.
We aim to achive what we believe :) With that, we see, dependency to techy thing doesn’t reveal that much analysis possibilities to non-tech user. A natural language searching would be great like, for a tour management company, we can query data by: show types of persons travel in a year, show average tour cost in winter to X country etc. Example: http://simpleql.com/ . We are mostly inspired by this to groom our idea and implementation. Well, what's wrong with simplesql then? Its not free / open-source :)
With a sweet hackathon day ( courtesy: https://koding.com ), we started implementing the idea.
This project is aimed to act as a framework. The basic is simple: start querying with what you are looking, framework suggests / guides you to reach your desired query, see the results in many possible ways (tabular, bar / line / pi / bubble chart etc) or publish as an API response or export to excel / pdf.
We are visualizing many things (Features section below) about this framework but keeping some base line where we keep much focus.
-
Let user search with natural language confortably. Showing suggestions are 1 of the major part. Other than suggestions, no user can find desired data easily. If someone tries with some (say, 6 / 7) natural queries and didn’t get the result, then there is high chance the user will start thinking the tool as “unusable”.
The suggestions can be derived from some pre-inputted (by the data owner) queries and the queries that people are searching. This module can be machine-learnable.
Showing who is searching with what in realtime will make the user adopt the querying process.
-
Let the data owner to control the relation between natural language and the data language (i.e., SQL). A data owner knows best which natural word means what data. The framework will provide sufficient way for this mapping.
This is important for revealing the possibilities to search same result with different sentences.
-
Present the data in a desired visual format and let the user control the visual. An intelligence is needed for choosing most relevant graph-type (bar / PI etc) for a query. This can be derived through machine learning for every user’s activities.
-
Support versatile types of SQL-ers (like mysql, postgresql, mongo, spark etc)
- Search by natural language with localized support.
- See the results in graphical presentation.
- See relevant query suggestions while typing something.
- Choose the results presentations (out of bar / chart / map etc).
- See what others are querying about now. Can select and run those query too.
- Save searched queries.
- Export / email / slack the result to recipient in image / pdf format.
- Get email / slack notification when a query takes long time.
- Can schedule for repeating run of same query where results will be emailed / slacked.
- For a repeating query, add a threshold value whose lower / upper value will trigger the notification for results.
- ... More ... :)
- Extract as much as module we can so that individual module can be developed / managed individually.
- Use REST for module communication.
- User WebSocker for frontend - backend streaming communication.
- Publish api endpoint for the query and result.
- ... More ... :)
-
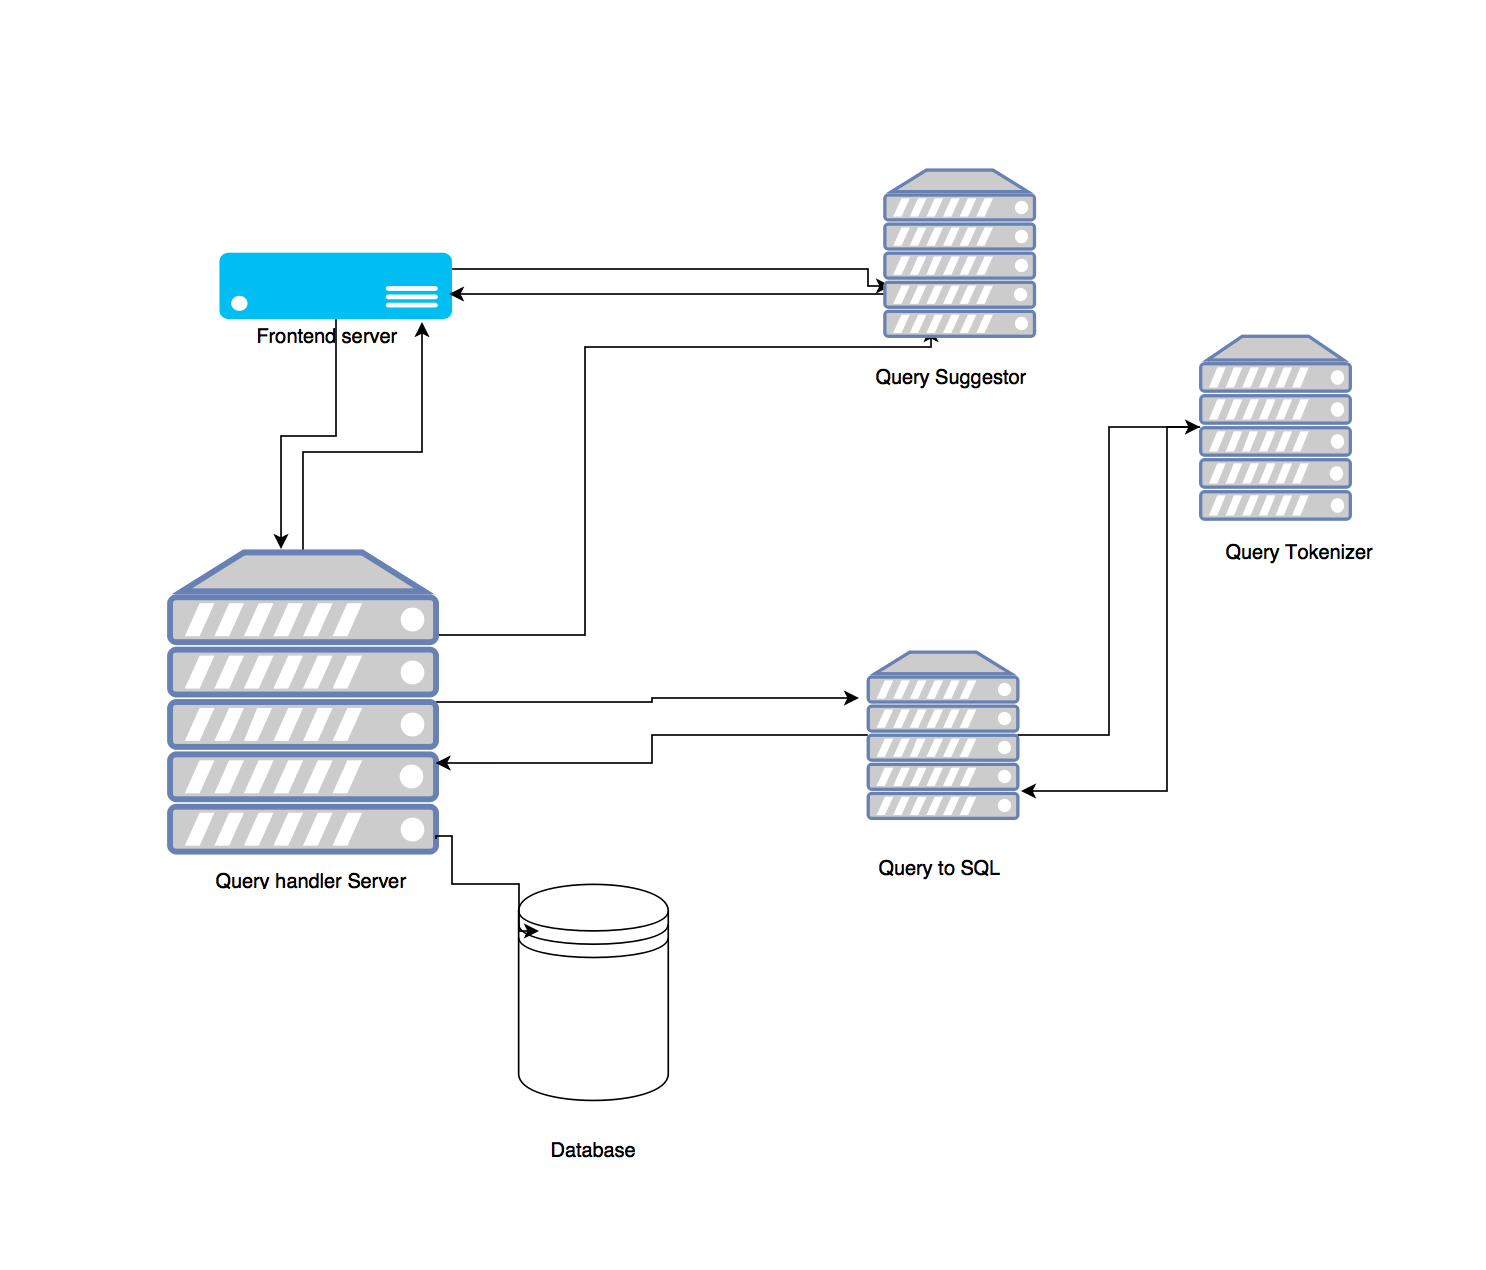
Frontend: The UI where you see everything.
-
Query Suggestor: This handles suggestions for any query user is typing. It is intended to give a high relevant suggestions. It also maintains live streaming of queries user are doing in the system.
-
Query Tokenizer: This does the natual language processing over user's query. We are using NTLK to parse out our known tokens. It is intended to choose a high relevant tokens.
-
Query To SQL: After the tokenizer is done with tokenizing, this module starts converting the tokens into SQLs of underlying data sources.
-
Query Handler: The BFF endpoint to serve necessary stuffs to the frontend.
- Demo is here: http://169.45.107.59/gdvf/ (please use Chrome / Safari for now as we tested only in these browsers)
- Video:
- A "demo-able" version :)
- Bug fixes in modules.
- Frontend UI is made a bit nicer.
frontendmodule shows a simple searchbox, result data table / charts and a live query streaming.
- The very first initial version after integrating with all modules :)

