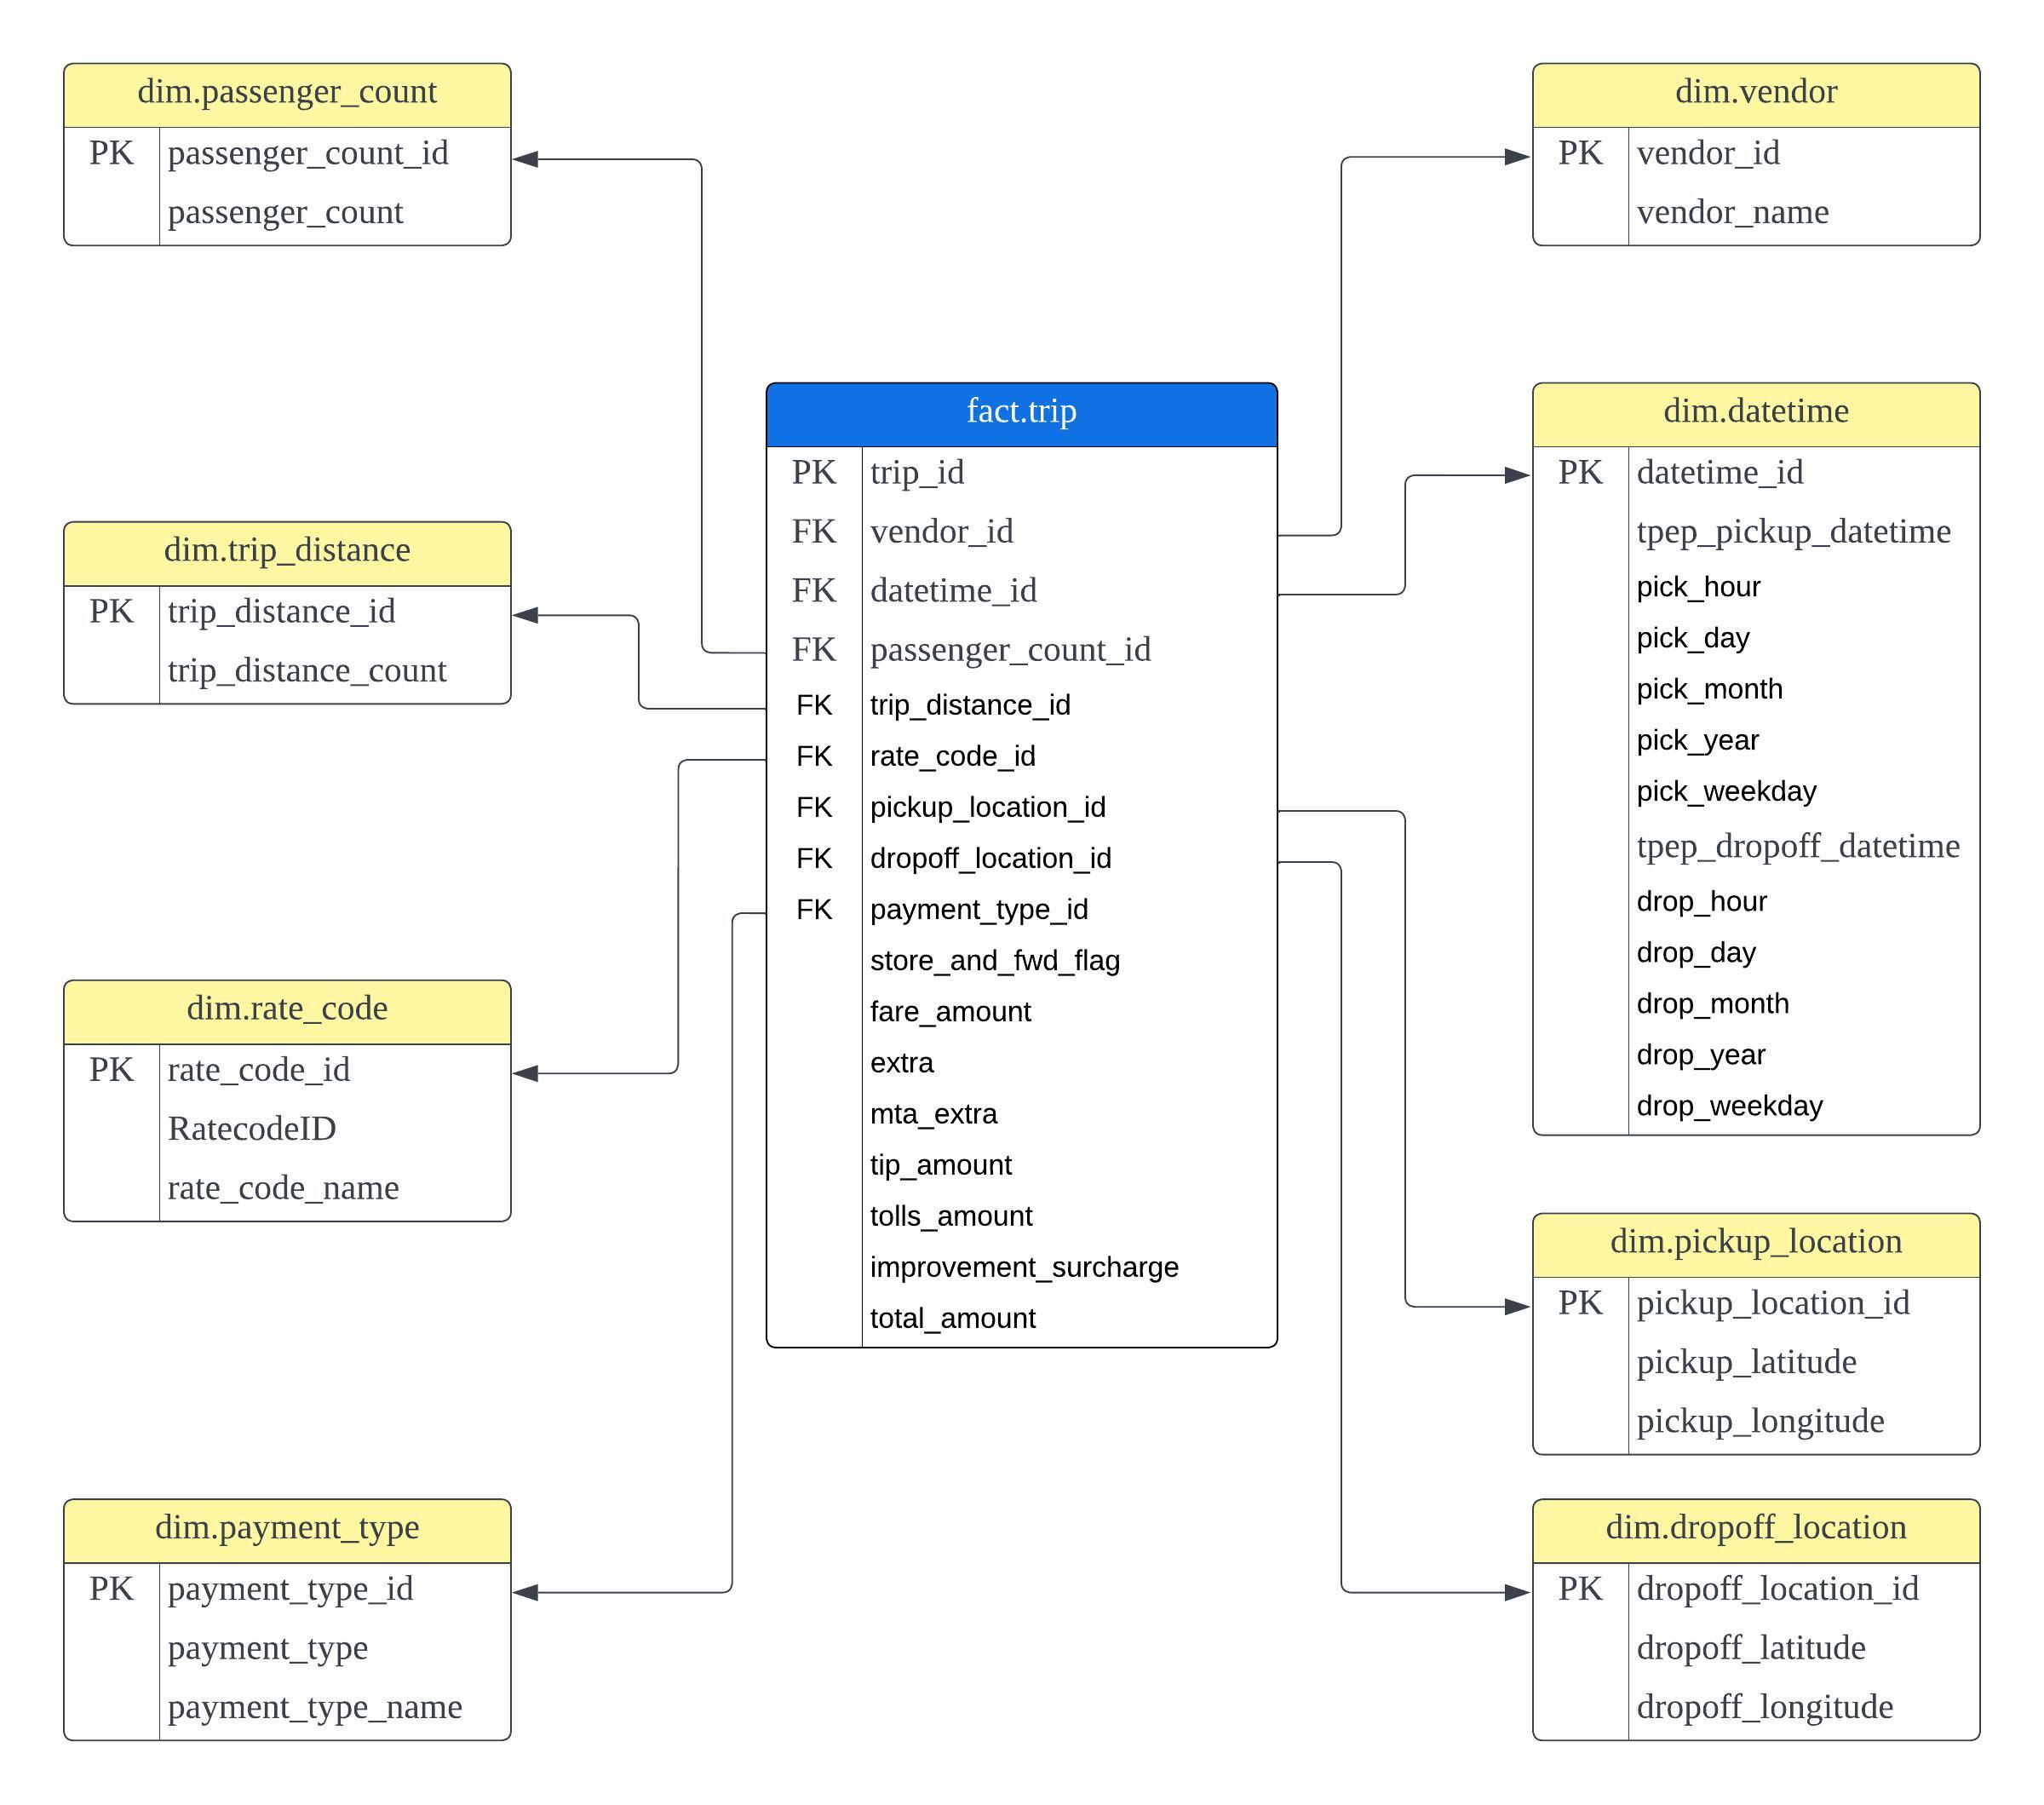
The "Yellow Taxi Trips Data Analytics" project uses modern technology and data analysis to extract valuable insights from New York City's yellow taxi trip records. I'm employing a range of advanced tools like Python, SQL, Azure services, and Power BI to process, analyze, and visualize the data.
- Python
- SQL
- Azure Data Factory
- Azure Data Bricks
- Azure Synapse Analytics
- Power BI
- Source : https://www.nyc.gov/site/tlc/about/tlc-trip-record-data.page
- Data Dictionary : https://www.nyc.gov/assets/tlc/downloads/pdf/data_dictionary_trip_records_yellow.pdf
The data is separated by months for each year, so I created a simple Python script to download all the Parquet files and combine them by year. The dataset is stored in .parquet.gzip format to be cost-effective for storage. But since it were too large to be stored on GitHub (without Git LFS), reducing the file size and using CSV/Parquet format is the best solution by filtering the rows for this side project use. Here, first 20,000 rows randomly selected from each month will be used.


