This project builds and visualizes enzyme-centric knowledge graphs by mining biomedical literature from PubMed. It focuses on comparing how different enzymes—defined by their Enzyme Commission (EC) numbers—are associated with specific diseases such as Cancer and SARS-CoV-2.
By mapping co-mentions of enzymes across thousands of research articles, this pipeline enables a data-driven exploration of enzyme-disease associations within the scientific literature.
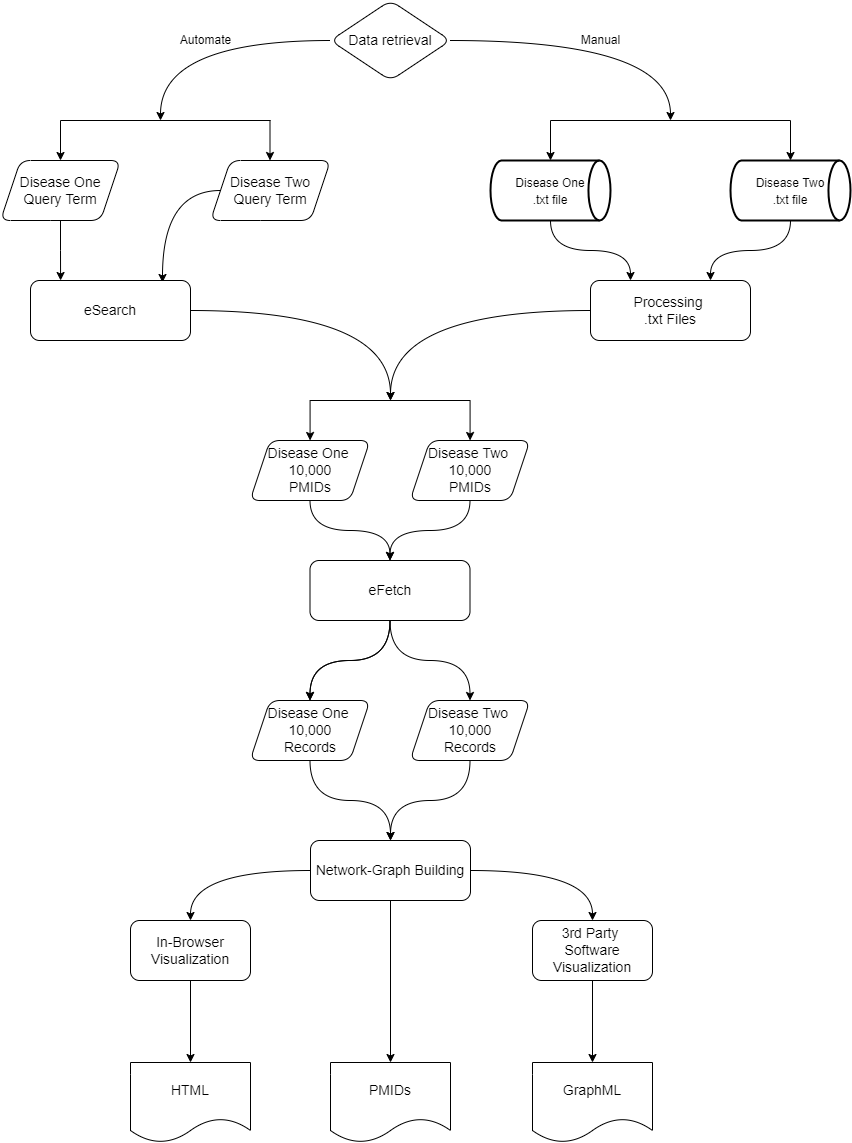
This pipeline includes the following steps:
-
PMID Extraction
Collect disease-specific publication IDs from PubMed using automated search or manual input. -
Metadata Retrieval
Fetch complete MEDLINE records for each publication using the NCBI Entrez API. -
Enzyme Detection
Extract EC-numbered enzyme mentions from theRN(Registry Number) field. -
Graph Construction
Build a bipartite network where:- Nodes represent PMIDs and enzymes
- Edges represent co-mentions in a publication
-
Interactive Visualization
Render the graph using PyVis for interactive exploration, with enzyme classes visually grouped. -
Graph Export
Export the network in both HTML (browser-based view) and GraphML (for Cytoscape/Gephi) formats.
- Identify and compare enzyme involvement across different diseases
- Discover potential biomarkers or shared therapeutic targets
- Track research trends or gaps in enzyme-related disease studies
- Generate hypotheses from high-level literature association maps
Visualizations are enriched by enzyme class and publication links.
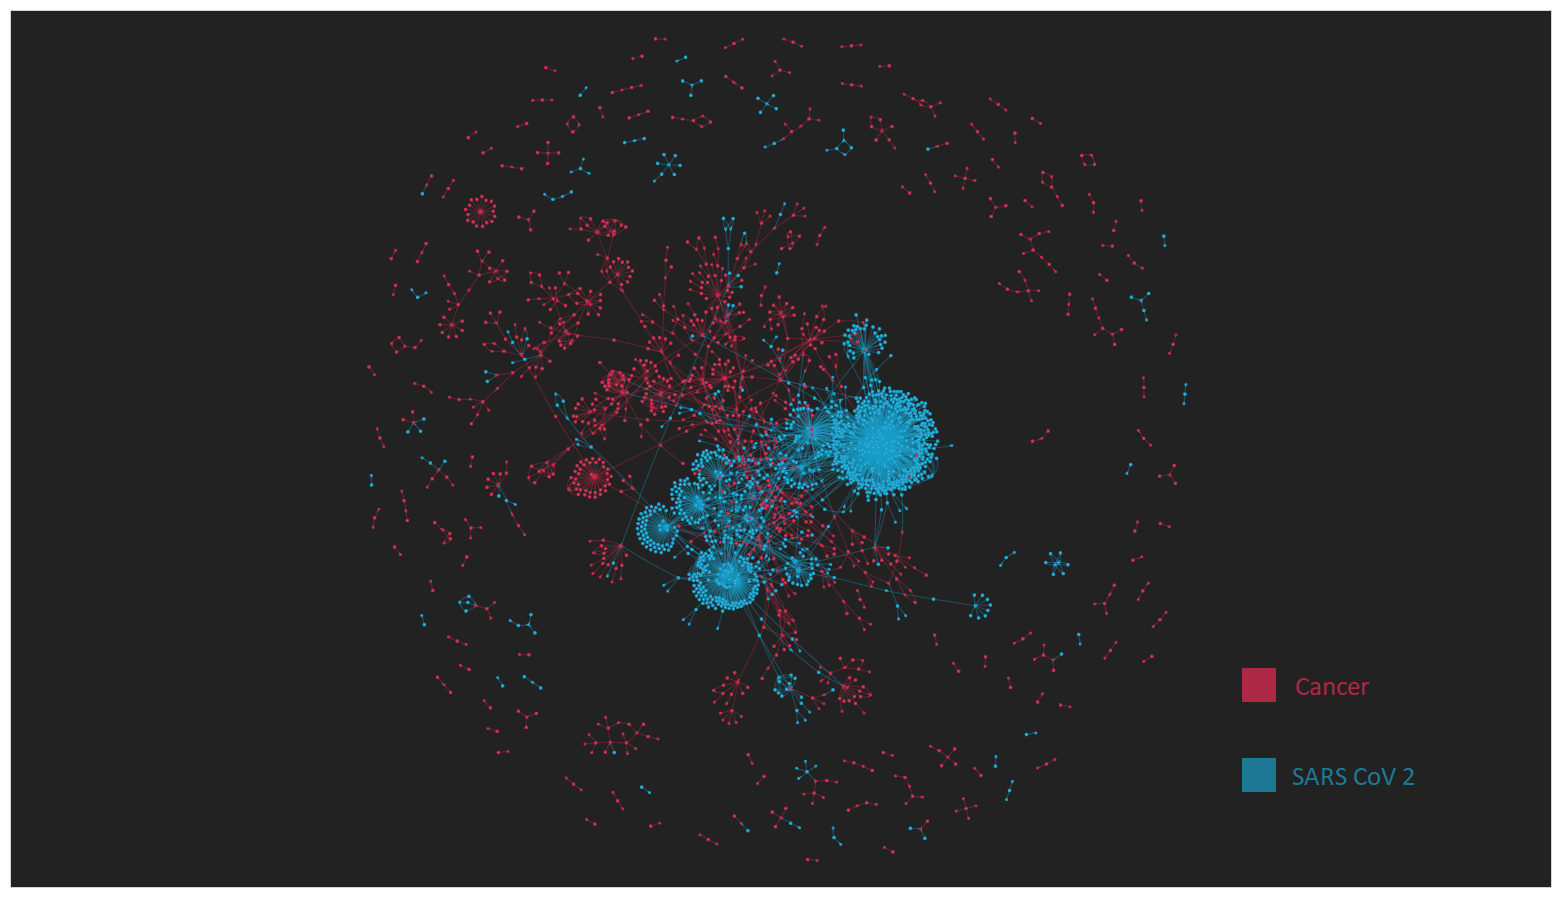
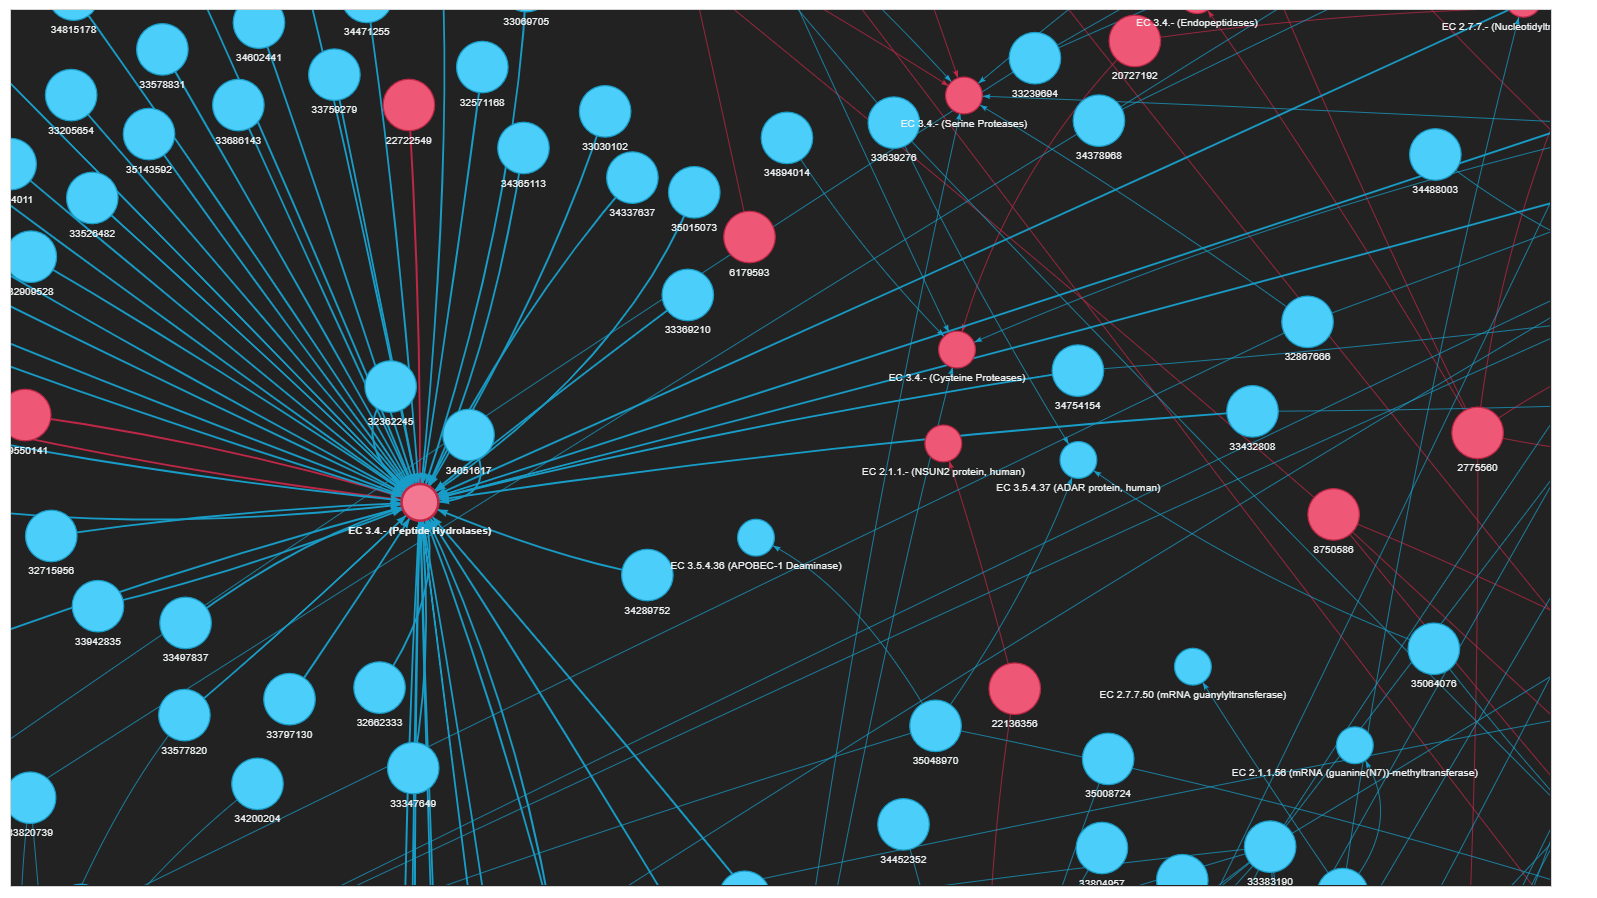
- Enzyme nodes are colored by diseases (e.g., Covid-19 and Cancer).
- Interactive output allows zoom, search, and node inspection.
This foundation can be extended with:
- Edge weighting based on enzyme frequency or co-occurrence strength
- Semantic enrichment from MeSH terms or abstracts
- Temporal tracking of enzyme-disease focus over time
- Disease-disease comparison graphs based on enzyme overlap
Feel free to fork the repository or raise issues for improvements. For citation or integration into a pipeline, please contact the author.