

Fork of chrissnell/crabby
Forked due to inactivity of original author. This project is used in production at vakantiediscounter.nl
crabby is a website performance tester that measures page load times and reports the measurements to a collection endpoint for processing, monitoring, and viewing. Crabby can collect and report these metrics:
- DNS resolution time
- TCP connection time
- TLS negotiation time
- HTTP Response Code
- Remote server processing time
- Time to first byte (TTFB)
- Server response time
- DOM rendering time
Crabby currently supports four types of metrics delivery:
- Graphite - Time measurements as metrics using Carbon protocol over TCP or UDP
- Datadog API - Time measurements as metrics; HTTP response codes as service check
- Prometheus - Time measurements as metrics, sent to Prometheus pushgateway
- Riemann - Time measurements as metric events; HTTP response codes as state events
Crabby has two types of probes for measuring website performance:
selenium, which uses the Selenium API to conduct browser-based performance tests via Chrome/chromedriver. Theseleniumtest is appropriate when performance measurement is the primary concern. These tests will pull down the page along with all objects included in the page. Due to limitations of chromedriver, the probe does not support reporting of TLS negotiation time or the HTTP response codesimple, which uses Go's built-in HTTP/2-capable client,net/http, to conduct simple HTTPGETrequests. These requests measure server performance metrics (including TLS negotiation time for HTTPS) but only pulls down the base URL but not objects reference by that page. Being headless, it cannot measure DOM rendering time. Thesimpleprobe is appropriate for measuring app/API availabililty and HTTP connection metrics.
Crabby currently supports four protocols for metrics delivery: Graphite, Datadog, Riemann, and Prometheus:
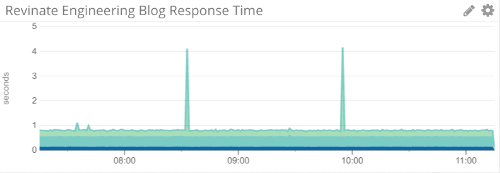
Crabby speaks the Carbon protocol via TCP or UDP for sending performance metrics to remote Graphite servers. This is a great way to centrally collect metrics from multiple, geographically dispersed Crabby POPs. Using a tool like Grafana, you can consolidate those metrics onto a single dashboard and have a very powerful way of looking at your website performance. At Revinate, we use a number Crabby installations around the globe to keep tabs on our performance as our customers experience it:

Crabby supports the sending of performance metrics to Datadog for use in graphical dashboards and alerting. Using Datadog's anomaly detection capability, you can even configure alerts to trigger when site performance suddenly degrades. When using the simple collector, Crabby can also collect HTTP response codes and send a failed service check to Datadog to trigger an alert if a 400- or 500-series error is detected.

Crabby has experimental support for sending metrics to Prometheus via a pushgateway. The config.yaml in the examples directory will get you started. If you specify a namespace, it will be applied as a grouping: crabby => NAMESPACE. Otherwise, it uses a default grouping of instance => HOSTNAME.
Crabby has experimental support for sending metrics and events to Riemann. The config.yaml in the examples directory will get you started. The Riemann storage backend supports the addition of tags to your metrics
and events.
Crabby is configured by a YAML file that you pass via the -config flag. If you don't pass the -config flag, Crabby looks for a config.yaml by default. This config file defines the sites that you want to test, as well as the destinations for the metrics that are generated (Graphite or Datadog or both). If you're using the selenium probe, you'll also need to specify the endpoint hostname and port for the Selenium API server.
No doubt, the easiest way to use Crabby is with Docker. This approach requires no compiling and you don't even have to go through the hassle of setting up Selenium, Chromium, and chromedriver because these are all available in an easy-to-use, all-in-one container. I always keep the latest version of Crabby available on Docker Hub but if you prefer to build your own images, I've included a Dockerfile in this repo and an entrypoint.sh to handle the startup.
There's also a docker-compose.yml in the example/ directory to get you started. By using Docker Compose, connecting Crabby to the Selenium server is really easy and requires no effort on your part.
To use Crabby in Docker, you'll need to mount your config.yaml Crabby configuration file into the container and set the CRABBY_CONFIG environment variable to the location where you mounted it. Again, the Docker Compose examples handle this for you so if you're unfamiliar with Docker volumes, I recommend using Compose.
If you prefer, I've uploaded some binaries to the Releases page for a variety of architectures. Have at it. After downloading the release, you can snag the config.yaml from the example/ directory to get started.
Crabby is configured by a YAML file that you pass via the -config flag (defaults to config.yaml).
See CONFIGURATION.md for a detailed description of this file. There is also an example, if you need one.