A classification model that can classify a given image of a crowd into Sparse or Medium or Dense based on crowd density using Deep Learning methodologies.
- Clone this repository using the below command:
git clone git@github.com:ananya0809/Crowd-Classification-DeepLearning.git
This will setup a remote working directory to store files and dataset in.
- Download the dataset available for ShanghaiTech.
- Import libraries to draw a heatmap from a random dummy data of any crowd dataset.
- Reset path variables code block as mentioned in
final.ipynbto the path variable on your system as per requirement.
- The folder
data_preparationhas 2 mainMATLABscripts which parses the input images and generates patches of image for training and test data. - Edit the
create_gt_test_set_shtech.mandcreate_training_set_shtech.maccordingly as per the path variables in your system. - Run both the scripts so as to formulate the model pre-training.
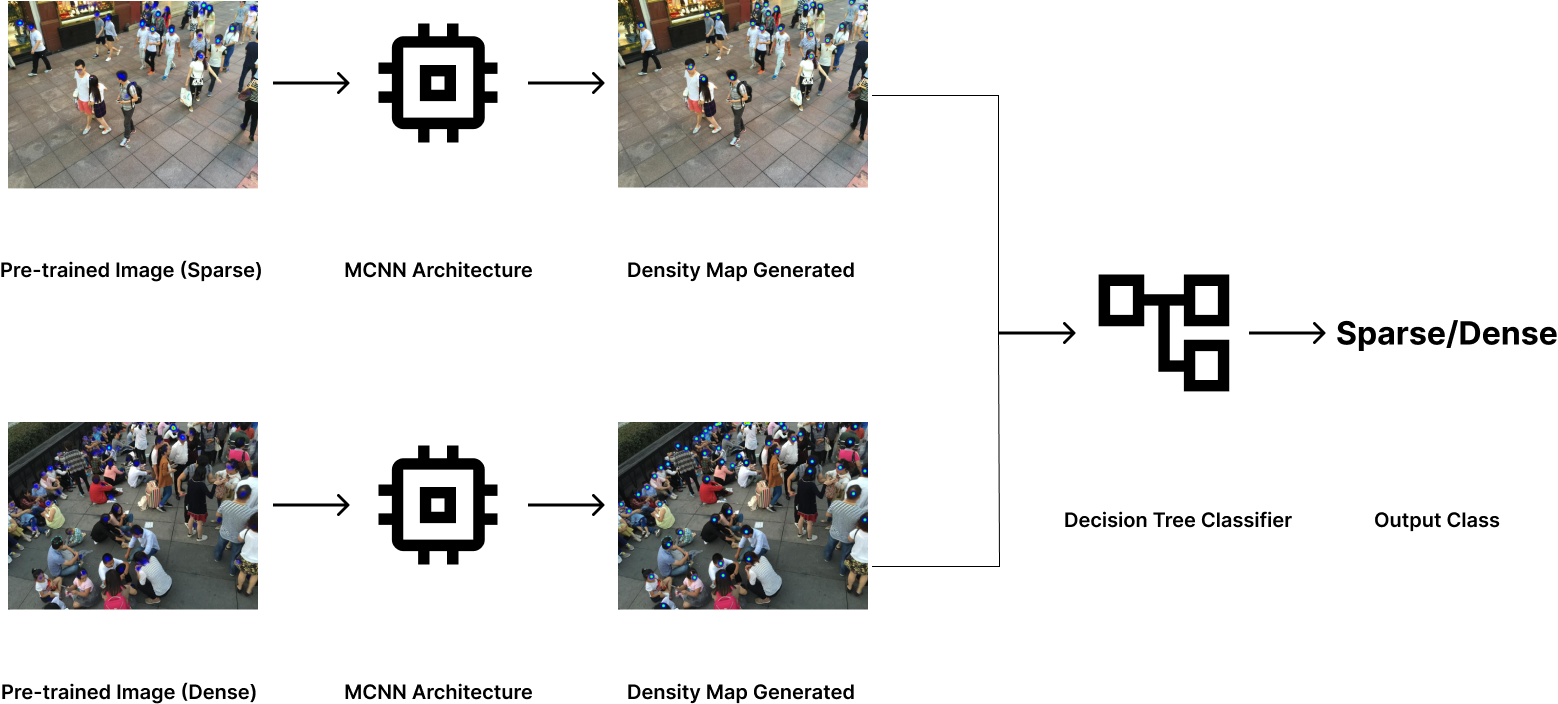
The idea is to implement classification of crowd images into 3 classes namely 'Sparse', 'Medium', & 'Dense' based on a Decision Tree logic where target variable is set manually for training whereas, for testing and validation the model generates a heatmap from a random input image using the trained MCNN model that will aid in classification from scratch without any prior ground truth data available for the random input image, and later classify based on the trained decision tree available.
Idea Representation:
- In reference to the code in
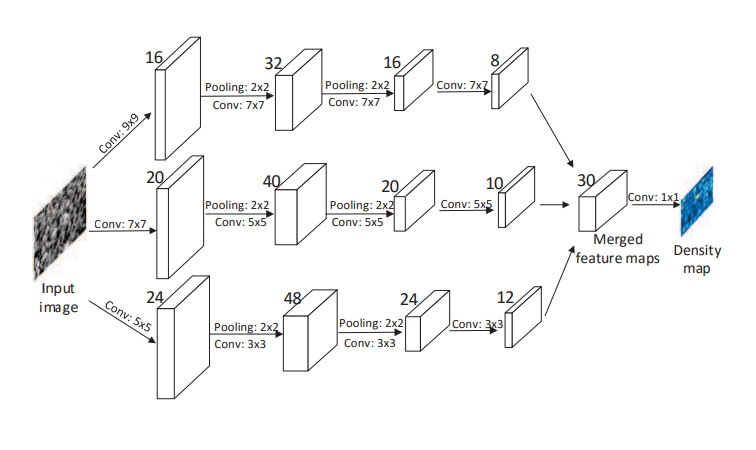
final.ipynbjupyter notebook, an end-to-end demonstration of density heatmap generation using the reference code of 'HeatMap Generation' is done. - It allows the image from the crowd dataset to input into an MCNN [Multi Column Neural Network] architecture where there are 3 sequential CNN models joined together to create a system of deep neural nets that enable feature recognition and extraction at each sequential model from face, torso and overall body respectively.
Model Architecture Representation:
- The generation of heatmap is obtained from the reference code using
pyHeatMapand stored in a sub-directory.
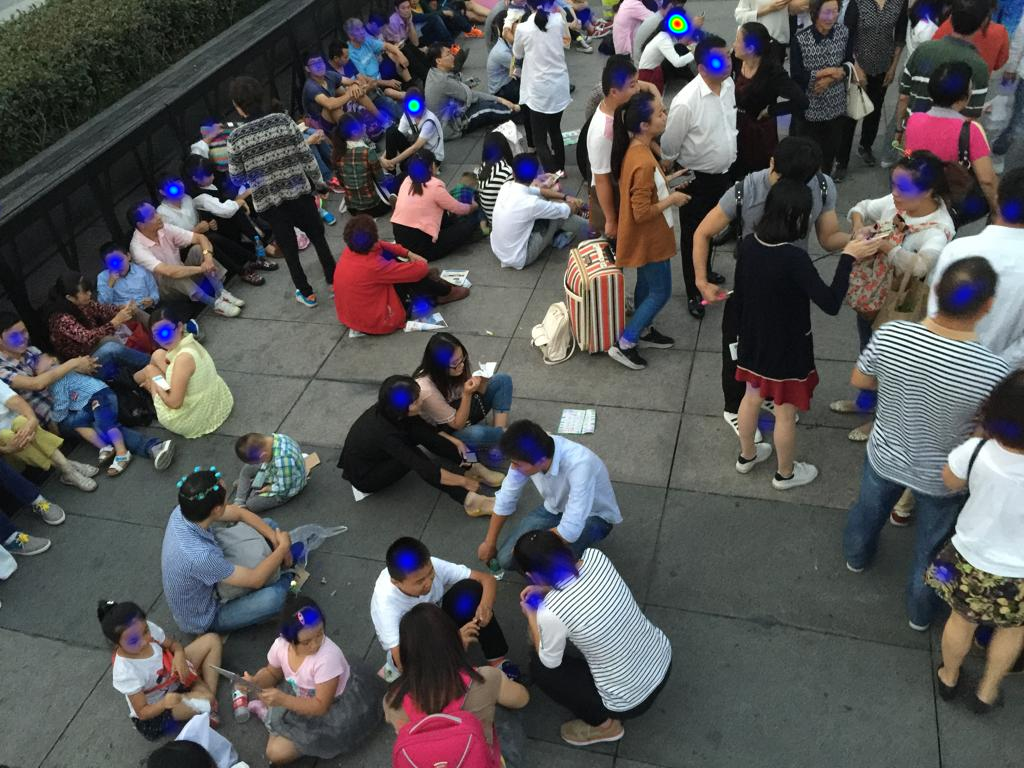
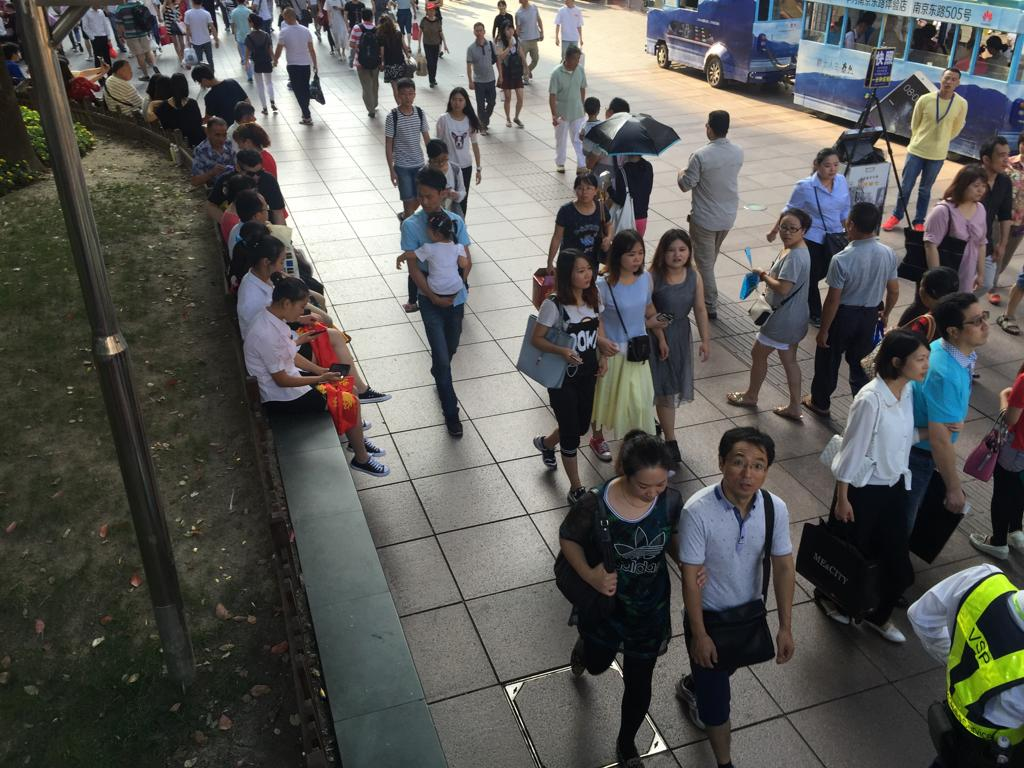
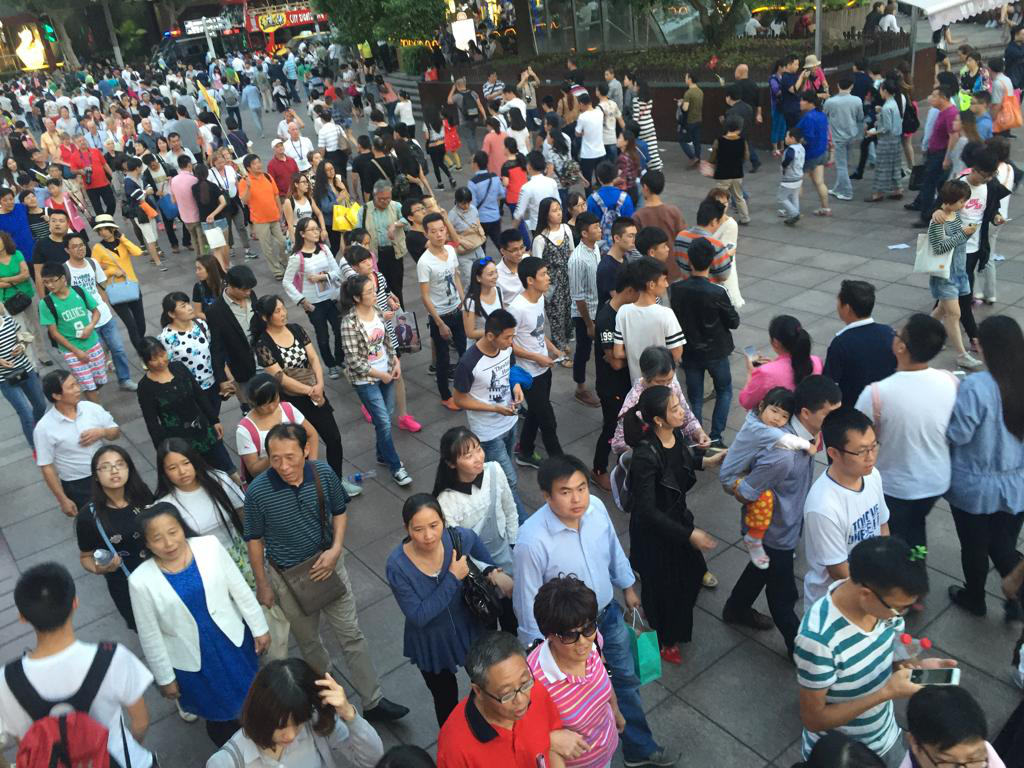
Image Pre-Processing for Heatmap Generation
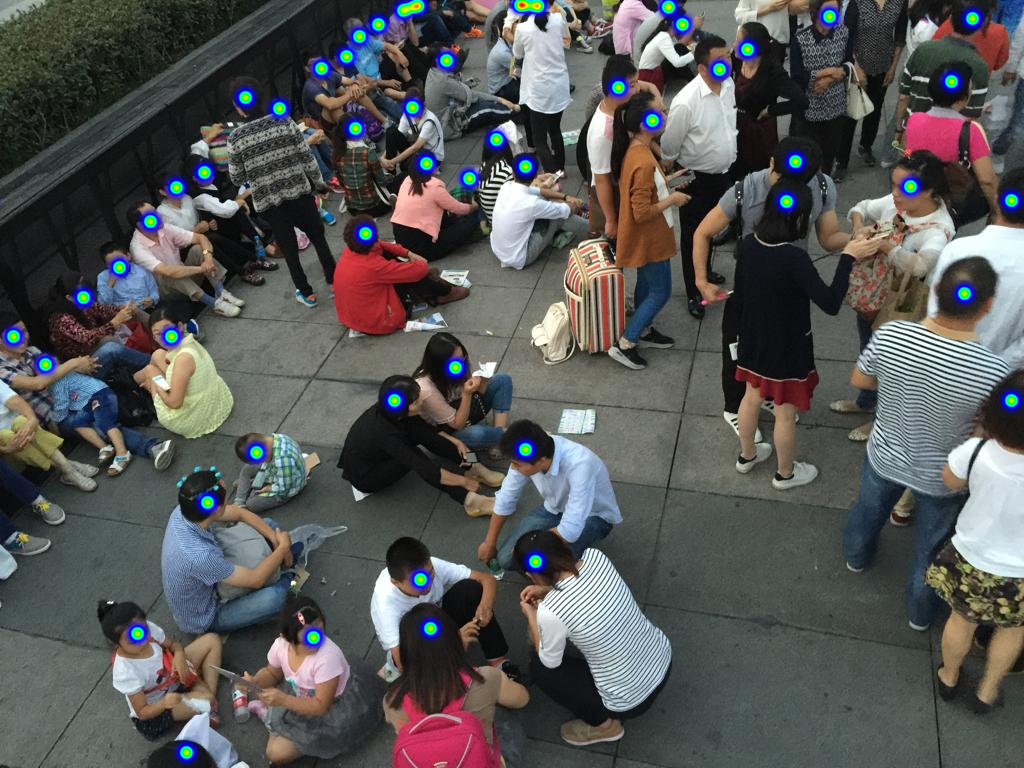
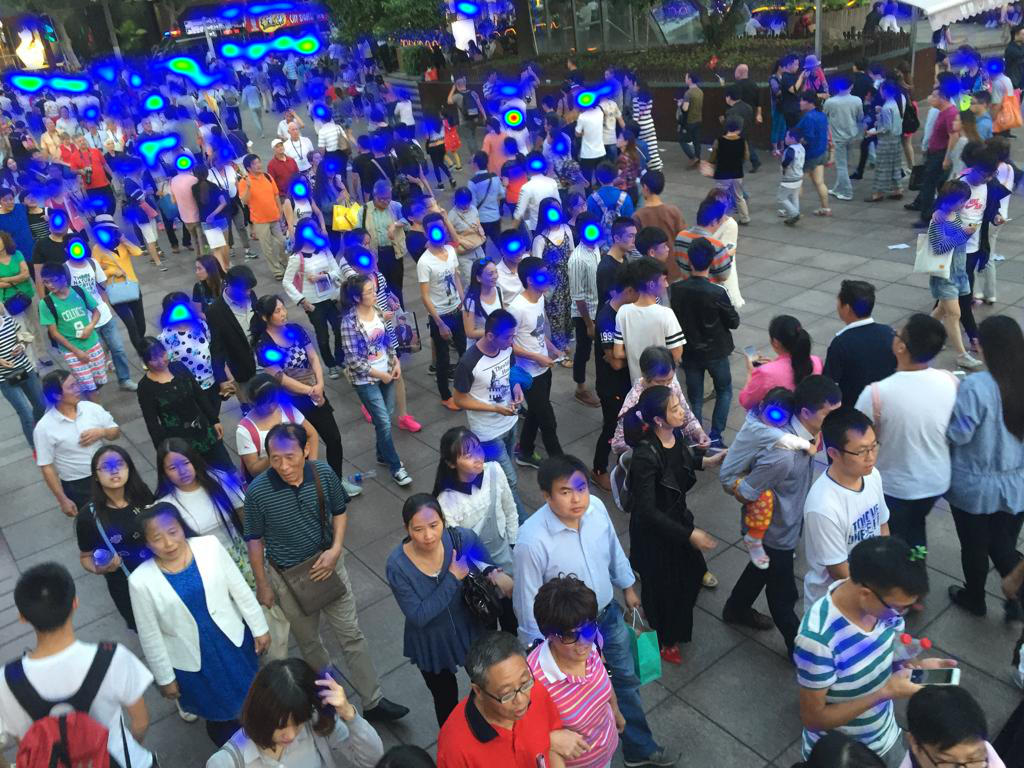
Actual Image After Heatmap Generation
- Now that the dataset has been modified from simple crowd images to heatmap generated images, the (x,y) coordinates of each image which are pre-present in a
.matfile available in thedata_subsetfolder are taken into account to implement the Decision Tree Classifier. - The
ground-truthdata available in the.matfile is used in implementation of K-means clustering where K is taken as 5 for all images.
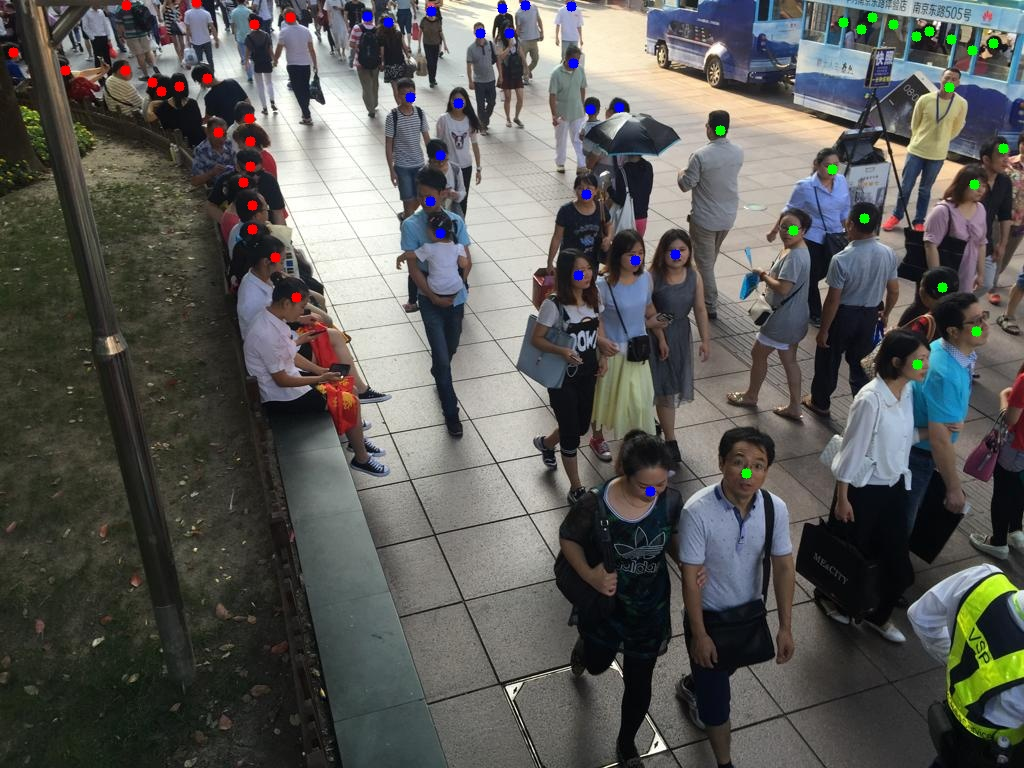
K-Means Clustering with K=3 (an example)
Pre-Clustering Image
K=3 Cluster Plot
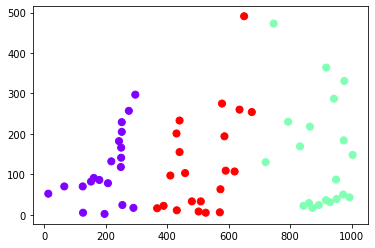
Image Clustered for 3 clusters
- On the obtained clusters a connectivity model approach is implemented where each datapoint containing (x,y) coordinates from 1st cluster is measured in distance from every other datapoint in the 2nd cluster. Thus for K=5, 10 pairs of clusters are obtained where the distance between every datapoint is calculated using
Euclidean Distance. - From the obtained distances, the minimum distance is taken and stored in a
.csvfile, that is generated to map minimum distances per cluster pair to its respective image. - This
.csvis then converted into aPandas DataFrameto define columns and also add another column forTargetclass. - The target classes are filled manually for the training phase so that a decision tree can be generated for testing and validation.
NOTE: K-Means is an unsupervised machine learning technique that is unable to generate labels on its own during clustering, thus it is necessary to manually input labels for classification by training the model on respective classes.
- Now the generated DataFrame is finally used for training and classification of the labelled images into their respective classes.
- The source columns are the minimum distance calculated per cluster pair for a given image and the target variable is the class for which the image has to be classified.
- For classification, a Decision Tree is generated based on the
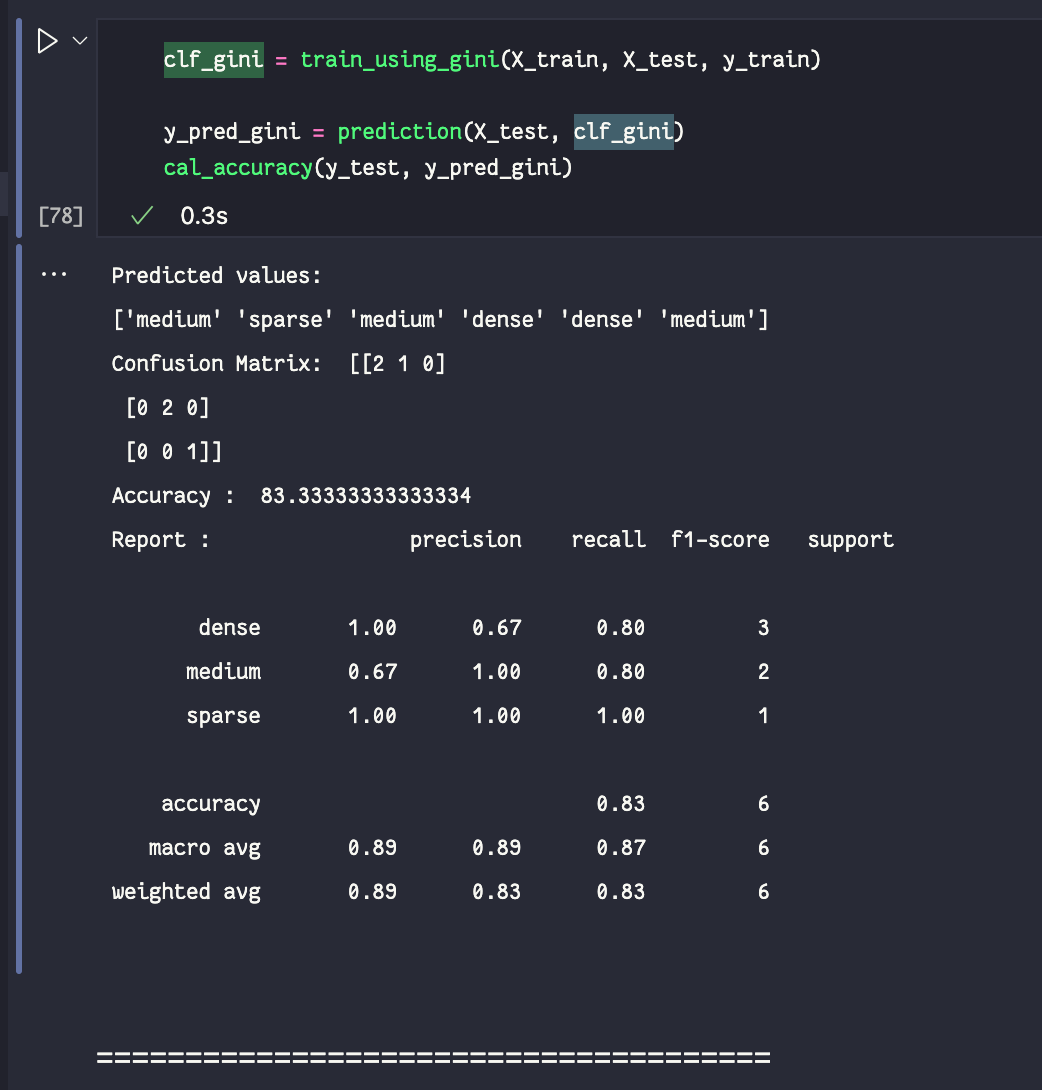
CARTalgorithm where the GINI Index is calculated for all attributes that are the 10 cluster pairs as per the input target value. - A confusion matrix is obtained for the same that reports the
accuracyas 83.33% for the limited sub-dataset provided to train the model after manual classification. - A report containing
precision,recall,f1-score,supportis also calculated for the same.
Output containing Confusion Matrix, Accuracy and the Report for trained model:
- This part of the code is the implementation for generation of heatmaps using
pyHeatMaplibrary as referenced from the given link. - The model for the same along with the learning weights are taken from a
model.jsonfile. - The path variable to the input image which is not used for training is updated.
- A heatmap for the given input image is generated. This model also predicts the count of people recognized by the model from the provided input image.
NOTE: Here the heatmap obtained consists of multiple datapoints containing respective (x,y) coordinates separated at a pixel's distance from each other over each feature vector recognized. When multiple features (nearly 1000) are recognized by the model the intensity of the heatmap changes from blue colour to red color at that particular location.
Before Processing
After Processing
- This part is purely testing the model.
- Here, we generate the combination of all distances for all cluster pairs and append the minimum most distance into the generated
.csvfile. - Lastly, prediction using Decision Tree Classifier is obtained through the help of
GINI Index. - The label for the input image is generated with the help of this Decision Tree and thus, the model helps in 'Classification of Crowd' into 'Sparse', 'Medium' or 'Dense' labels depending upon its density.