
We want to create a system that will help emergency services track natural disasters. This information is invaluable to emergency services as it helps them distribute resources, send warning messages, etc. The task is to create a program that serves as a GUI to locate, track, and add cases of natural disasters. 🌪️🌀⛰️🌊🔥
View Canva Presentation Slidedeck >>
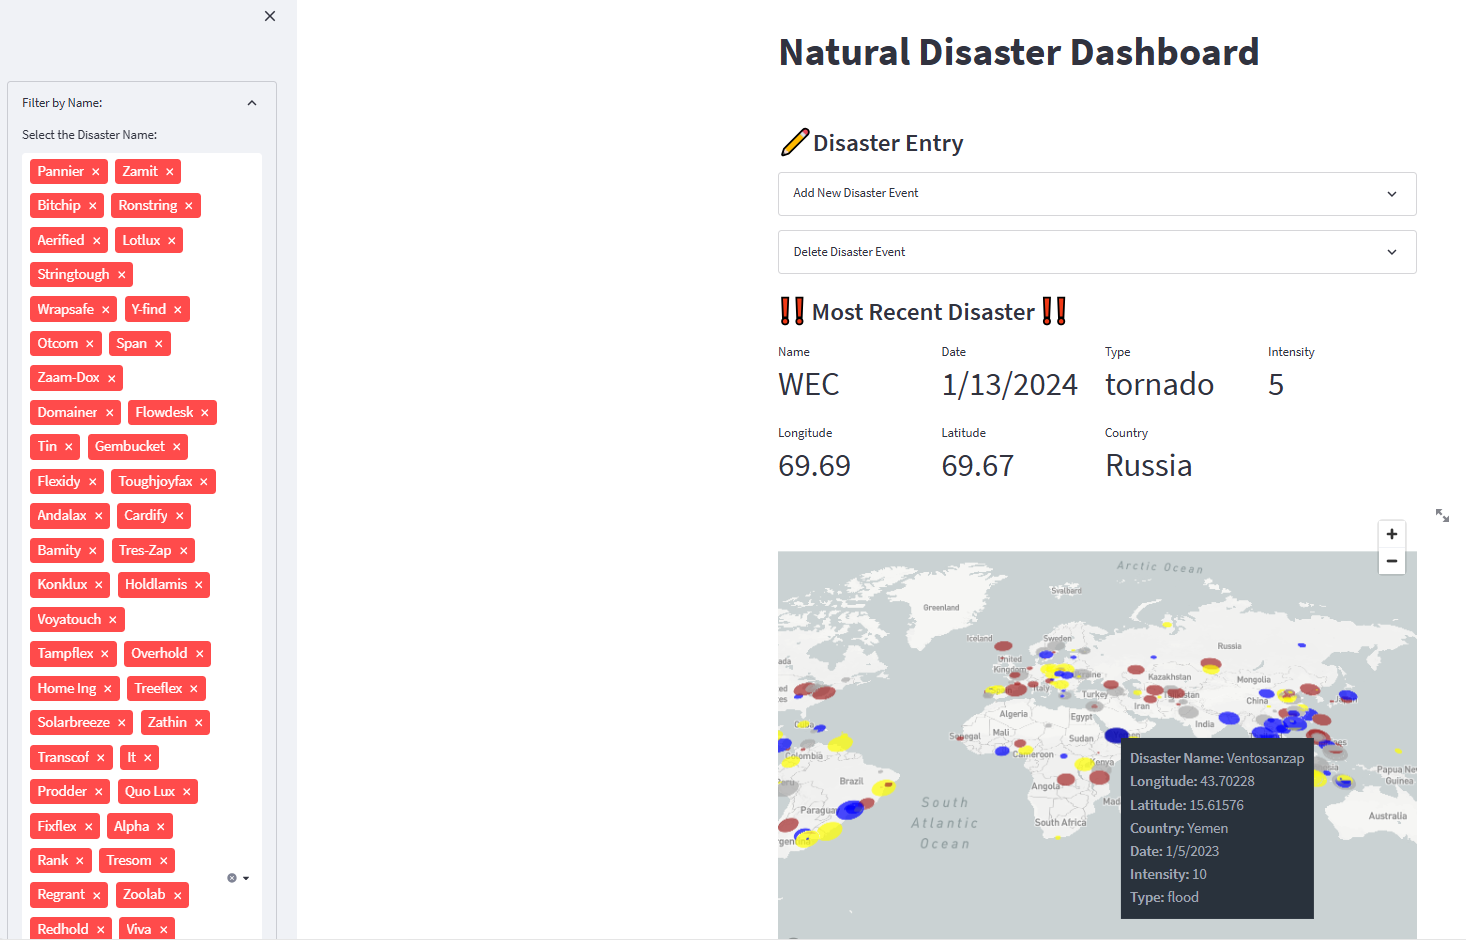
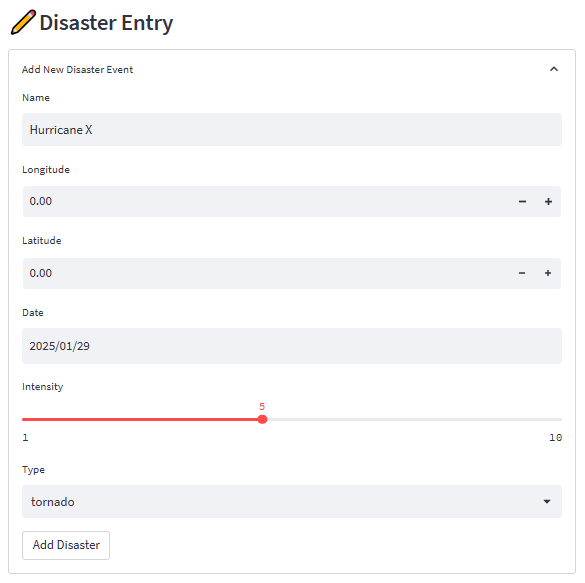
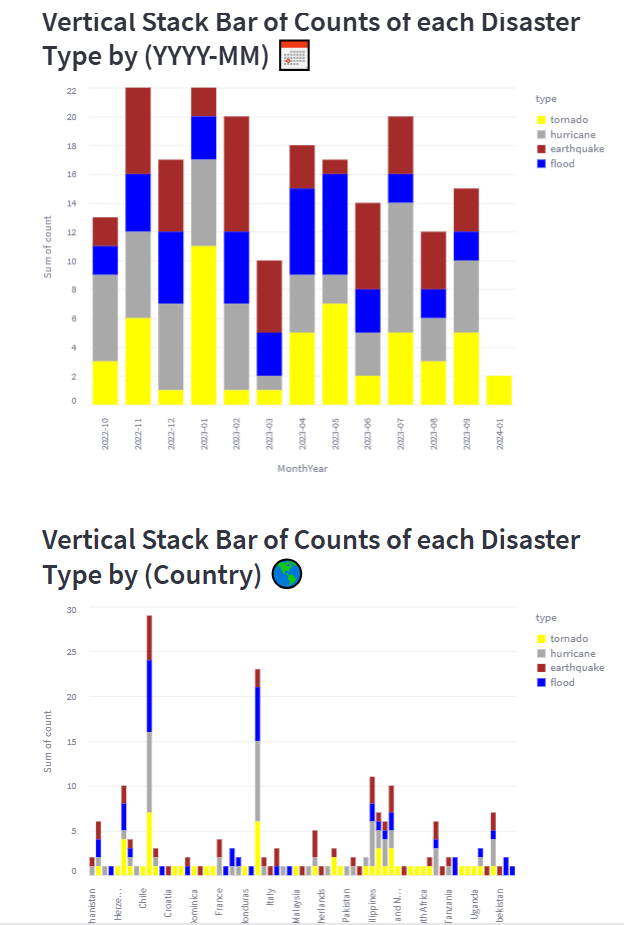
We were inspired to design a dashbaord that allows live updated disaster entries on a visualized interactive map interface and graph data. User can add, display, delete Disaster entry with features to:
- Name
- Longitude
- Latitude
- Intensity (adjustable with levels)
- Type of Disaster (🌪️🌀⛰️🌊🔥)
| Tech |
|---|
- Clone the repo
streamlit run webapp.py/to start the webapp on localhost
- Andy Huang -
- Aaqil Murji -
- Marcus Tuen Muk -