This is all the example code used for the Weaveworks + Aspen Mesh webinar Automating Canary Deployments with Weaveworks Flagger and Aspen Mesh and the Aspen Mesh CNCF webinar Delivering Progressive Delivery with Service Mesh
Flagger is a Kubernetes operator that automates progressive delivery scenarios like canary deployments. It does this by configuring a Service Mesh to shift some traffic to a canary, and then does an analysis of how the canary is performing using metrics from a source like Prometheus. (This is a simplified description of one Flagger scenario, there's a lot more it can do)
Aspen Mesh is a service mesh based on the open source Istio service mesh. It's compatible with Flagger and provides a cloud-hosted dashboard and Prometheus-compatible metrics collection system.
The webinar shows Flagger running in Aspen Mesh and demonstrates a canary deployment, talking through all the Flagger and Aspen Mesh components involved. If you saw the webinar and want to explore Flagger and/or Aspen Mesh on your own, this repo may help you.
You can also check out the Flagger docs directly as they're pretty great. You should definitely use the docs instead if you are not using an Istio service mesh (instead using an alternative like linkerd or AppMesh, or not using a service mesh at all). All the examples in this repository are specific to Istio or Istio-based service meshes like Aspen Mesh.
This repository is frozen-in-time for the demo in the webinar. For production usage and access to any new features in Flagger since this demo, you'll want to follow the upstream Flagger installation instructions instead.
-
You need a recent Kubernetes cluster. I used Kubernetes
v1.14.2deployed via kops. -
Install Aspen Mesh (click the "Get Aspen Mesh" button on https://aspenmesh.io to get started).
-
Install flagger itself. Flagger has its own CustomResources like the Canary resource that describes how to do a canary deployment. It also needs a ServiceAccount so it can create new Deployments, Services, VirtualServices and other Kubernetes or Service Mesh resources to make the canary deployment go. Finally, there's the deployment of the Flagger operator itself. You normally only need one of these per cluster, it's the running code that will watch all the resources involved and execute the canary deployment.
kubectl apply -f flagger-crd.yaml
# May need to wait a second or two for the kube apiserver to digest the CRDs
kubectl apply -f flagger-account.yaml
kubectl apply -f flagger-deployment.yaml
Note: In the webinar we demoed an experimental Flagger feature for traffic mirroring from an uncommitted build. That build is referenced in flagger-deployment.yaml.
- Install a sample application. We'll do this in the
testnamespace. When we first install the sample application, Flagger will ignore it because we haven't defined a Canary resource or started a new canary deployment. We deploy thepodinfoapp at version2.0.0to start.
kubectl apply -f test-podinfo.yaml
- Install flagger-loadtester. This is a little app that can either continuously generate load, or Flagger can poke to generate load on our test app. In a real deployment, you may not need this because your app may always get real load, or you may have better load generators (e.g. from end-to-end tests). When we install it, it will generate continuous load in the background to our service.
kubectl apply -f test-loadtester.yaml
- (optional) You can check that traffic from flagger-loadtester to podinfo works. We haven't defined any Canaries yet so Flagger is idle.
$ kubectl get endpoints -n test
NAME                 ENDPOINTS          AGE
flagger-loadtester   100.96.4.46:8080   4m25s
podinfo              100.96.2.50:9898   8m51s

$ kubectl exec -it -n test $(kubectl get pods -n test -l app=flagger-loadtester -o jsonpath='{.items[0].metadata.name}') -c loadtester -- /bin/sh -c "hey -z 10s -q 10 -c 2 http://podinfo.test:9898/"

Summary:
  Total:        10.0036 secs
  Slowest:      0.0577 secs
  Fastest:      0.0012 secs
  Average:      0.0027 secs
  Requests/sec: 19.9928

  Total data:   59200 bytes
  Size/request: 296 bytes

Response time histogram:
  0.001 [1]     |
  0.007 [195]   |■■■■■■■■■■■■■■■■■■■■■■■■■■■■■■■■■■■■■■■■
  0.012 [0]     |
  0.018 [0]     |
  0.024 [0]     |
  0.029 [0]     |
  0.035 [0]     |
  0.041 [0]     |
  0.046 [0]     |
  0.052 [0]     |
  0.058 [4]     |■


Latency distribution:
  10% in 0.0014 secs
  25% in 0.0014 secs
  50% in 0.0015 secs
  75% in 0.0016 secs
  90% in 0.0022 secs
  95% in 0.0025 secs
  99% in 0.0577 secs

Details (average, fastest, slowest):
  DNS+dialup:   0.0000 secs, 0.0012 secs, 0.0577 secs
  DNS-lookup:   0.0000 secs, 0.0000 secs, 0.0015 secs
  req write:    0.0000 secs, 0.0000 secs, 0.0001 secs
  resp wait:    0.0026 secs, 0.0011 secs, 0.0576 secs
  resp read:    0.0000 secs, 0.0000 secs, 0.0001 secs

Status code distribution:
  [200] 200 responses
- Define a Canary resource. This is the special CustomResource that tells Flagger that we want to use a Canary strategy when a new deployment of podinfo is attempted, and all the details about how to do that.
kubectl apply -f canary-podinfo.yaml
At this point, Flagger is in charge of our sample podinfo app. You can see
that Flagger defined a new deployment podinfo-primary and also edited the
podinfo deployment to have Replicas: 0 (i.e. the podinfo deployment we
defined now has 0 running copies; it's just an empty shell).
From now on, we'll interact with the podinfo deployment and we'll let Flagger
convert those interactions into changes to podinfo-primary, podinfo-canary
and other config. If you had a CI/CD or GitOps system, that system would also
only interact with podinfo deployment. Let Flagger manage the deployments it
created 100%. Do not touch podinfo-primary! Flagger will just fight you and
set it back.
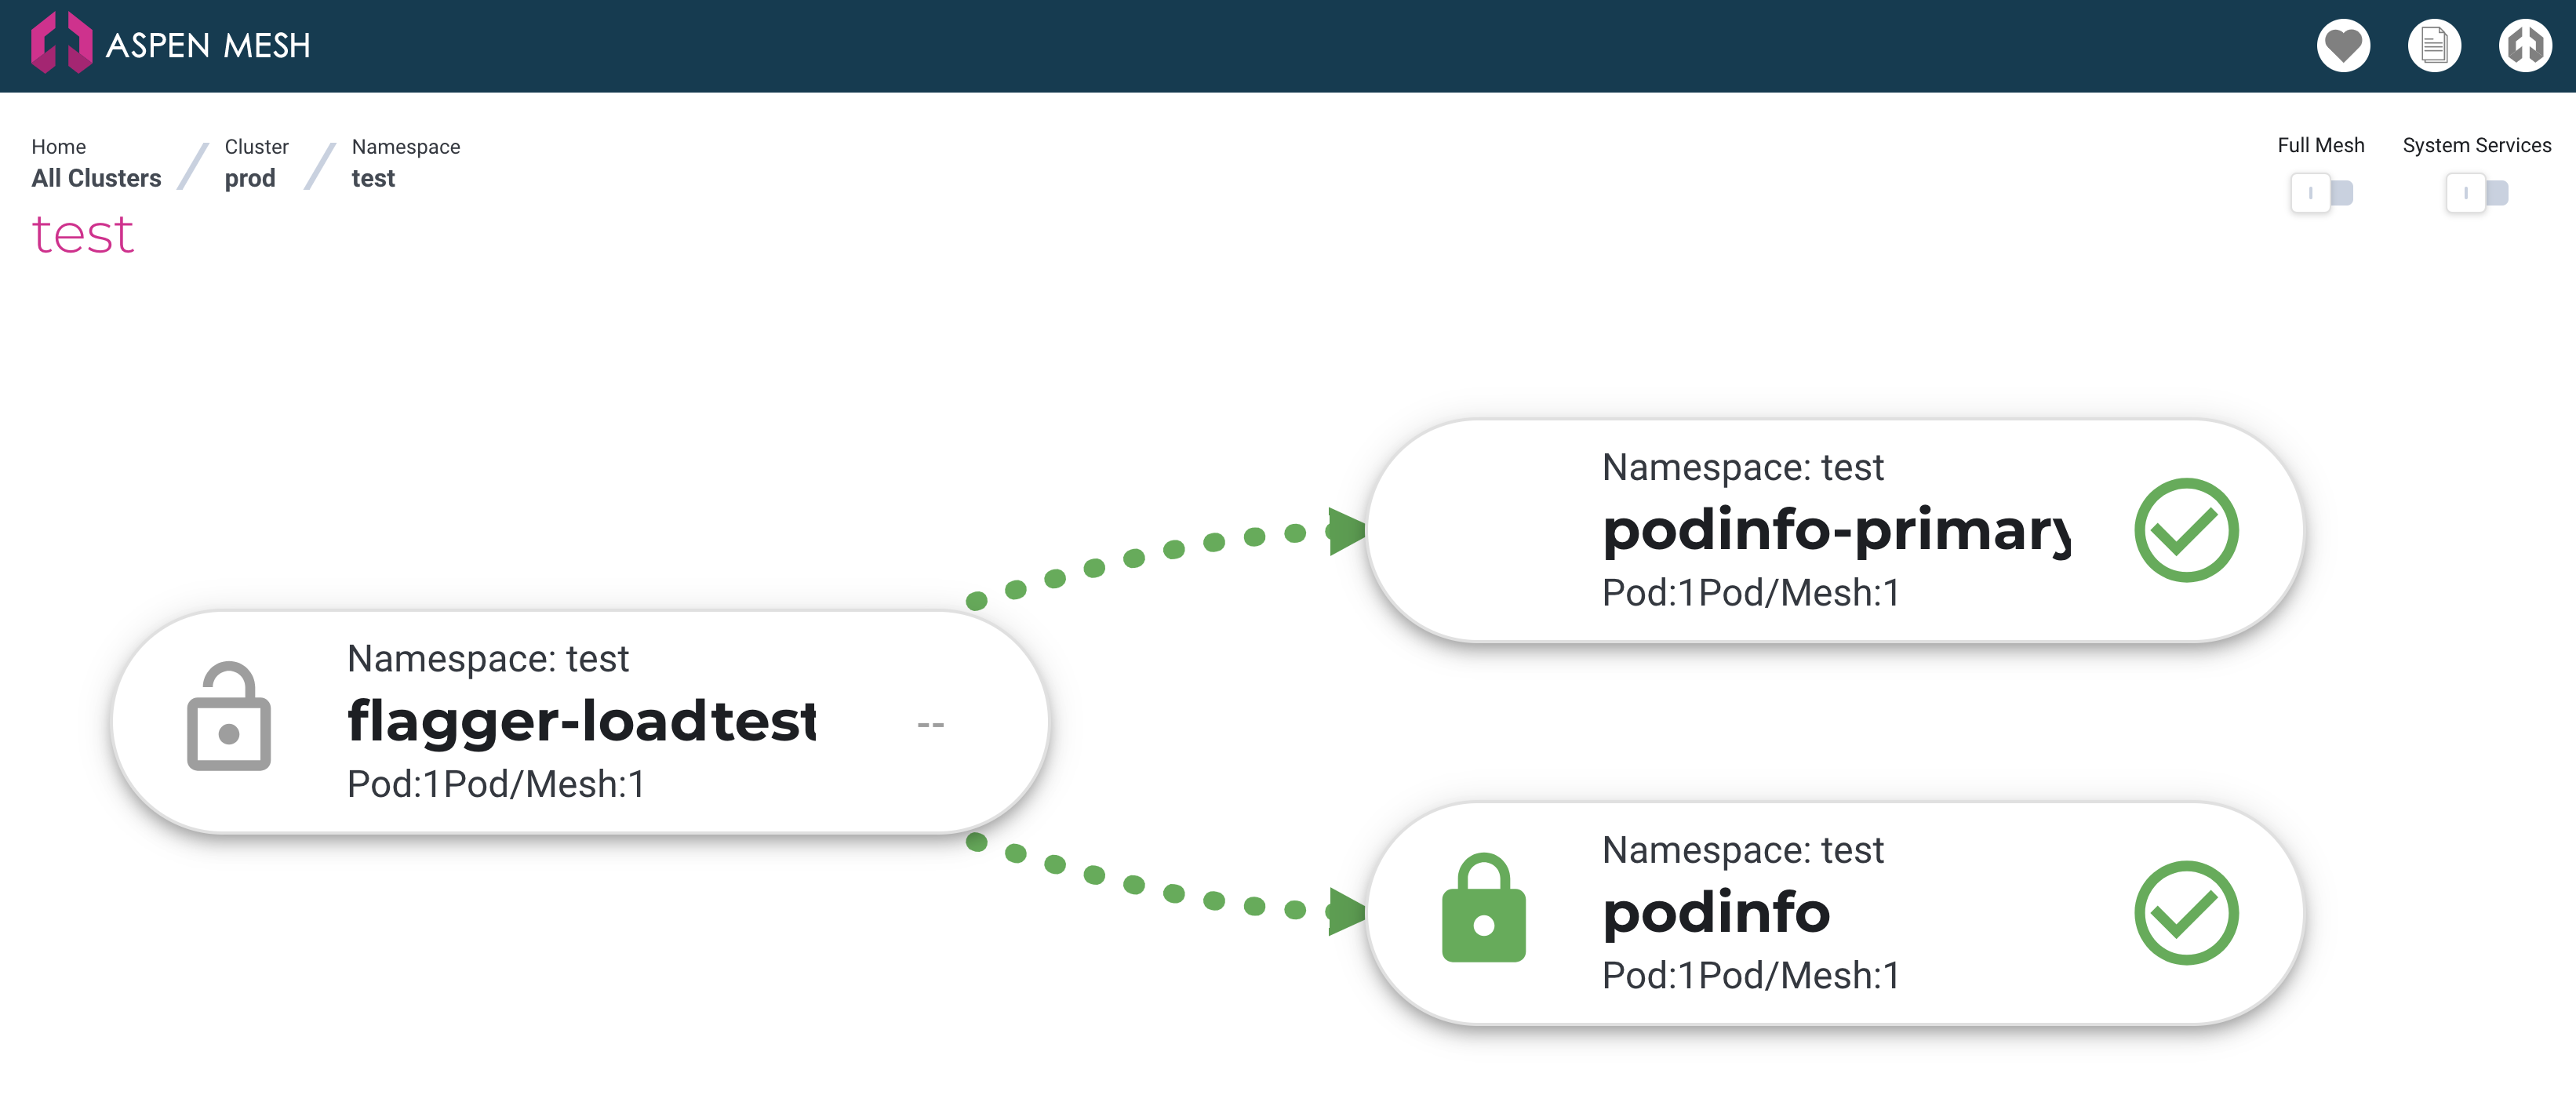
- (optional) You can investigate the new layout once you have defined the Canary resource but not started a canary deployment.
There is a new deployment and service podinfo-primary defined, also a
podinfo-canary service with no endpoints (yet):
$ kubectl get endpoints -n test
NAME                 ENDPOINTS          AGE
flagger-loadtester   100.96.4.46:8080   14m
podinfo              100.96.4.47:9898   19m
podinfo-canary       <none>             2m51s
podinfo-primary      100.96.4.47:9898   2m51s
The deployment podinfo is scaled down to zero because Flagger has taken over
podinfo; it will start controlling podinfo-canary and podinfo-primary
instead:
$ kubectl get deploy -n test
NAME                 DESIRED   CURRENT   UP-TO-DATE   AVAILABLE   AGE
flagger-loadtester   1         1         1            1           19m
podinfo              0         0         0            0           23m
podinfo-primary      1         1         1            1           7m16s
The Istio VirtualService is sending 100% of traffic to podinfo-primary:
$ kubectl get vs podinfo -n test -o yaml
...
spec:
  gateways:
  - mesh
  hosts:
  - app.example.com
  - podinfo
  http:
  - route:
    - destination:
        host: podinfo-primary
      weight: 100
    - destination:
        host: podinfo-canary
      weight: 0
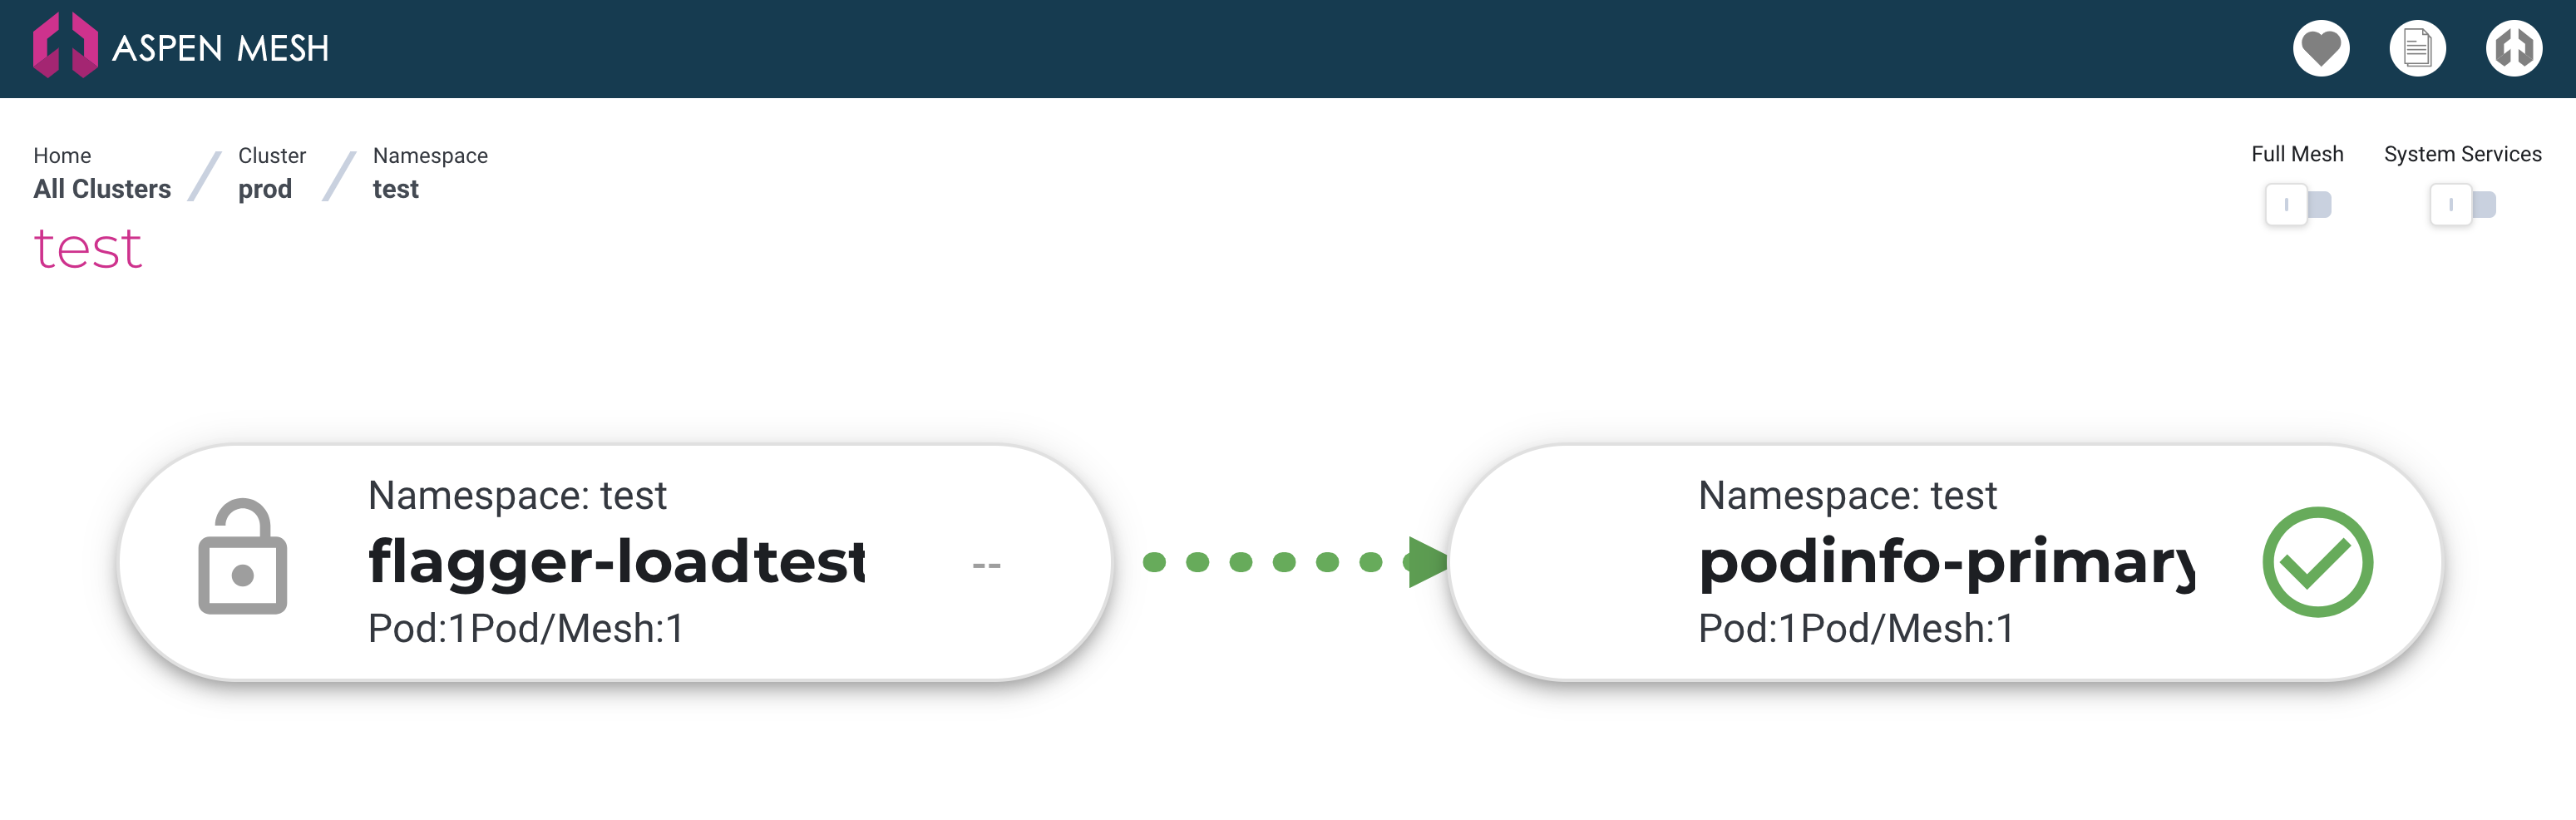
And test traffic still works, with 100% of traffic going to podinfo-primary.
Everything's basically the same except Flagger made two new deployments, scaled
down the one we created, and rearranged Services and VirtualServices.
$ kubectl exec -it $(kubectl get pods -l app=flagger-loadtester -o jsonpath='{.items[0].metadata.name}') -c loadtester -- /bin/sh -c "hey -z 10s -q 10 -c 2 http://podinfo.test:9898/"

Summary:
  Total:        10.0034 secs
  Slowest:      0.0072 secs
  Fastest:      0.0011 secs
  Average:      0.0014 secs
  Requests/sec: 19.9932

  Total data:   60800 bytes
  Size/request: 304 bytes

Response time histogram:
  0.001 [1]     |
  0.002 [191]   |■■■■■■■■■■■■■■■■■■■■■■■■■■■■■■■■■■■■■■■■
  0.002 [6]     |■
  0.003 [0]     |
  0.004 [0]     |
  0.004 [0]     |
  0.005 [0]     |
  0.005 [0]     |
  0.006 [0]     |
  0.007 [0]     |
  0.007 [2]     |


Latency distribution:
  10% in 0.0012 secs
  25% in 0.0012 secs
  50% in 0.0013 secs
  75% in 0.0014 secs
  90% in 0.0015 secs
  95% in 0.0017 secs
  99% in 0.0072 secs

Details (average, fastest, slowest):
  DNS+dialup:   0.0000 secs, 0.0011 secs, 0.0072 secs
  DNS-lookup:   0.0000 secs, 0.0000 secs, 0.0015 secs
  req write:    0.0000 secs, 0.0000 secs, 0.0001 secs
  resp wait:    0.0012 secs, 0.0010 secs, 0.0053 secs
  resp read:    0.0000 secs, 0.0000 secs, 0.0001 secs

Status code distribution:
  [200] 200 responses
The Aspen Mesh dashboard shows flagger-loadtester talking to podinfo-primary:
- Do a Canary deployment.
kubectl -n test set image deployment/podinfo podinfod=stefanprodan/podinfo:2.1.3
deployment.extensions/podinfo image updated
Note: if you don't get back image updated it is because you already set the
image to 2.1.3 and Flagger will ignore you. Update the image to 2.1.2
- Analyze results
If you have prometheus, you should see a plot like the below:

The blue line is the primary load - it is at 100% at the start of the canary deployment on the left. The red line is the mirrored traffic - at the beginning of the canary, it spikes up with a mirrored copy of all the traffic going to the primary. This plot only shows successful requests, so the mirror is successfully responding. This means the canary should continue.
If the mirror was not successful, then Flagger would not promote the canary. The advantage of mirroring in this case is that none of the failed responses were delivered to users. The caveat (as described in the webinar) is that your mirrored traffic must be idempotent: it must be OK to make a copy of the request.
Next, Flagger stops mirroring and begins traffic shifting. This is where the green line starts to tick up. The green line and the red line are both traffic to the same canary service; red is in "mirror mode" and green is in "shift mode". The green line continues ramping up while the blue ramps down in equal measure.
Finally, once green is successfully handling 60% of traffic, Flagger declares the canary a success, it promotes the canary deployment to primary and shifts all traffic to it. Once complete, both canary and primary are running the same version (the newly-successful canary is the primary version). Flagger scales down the canary, ready to deploy a new canary.
Generated by (this assumes a prometheus pod in istio-system at port 9090):
kubectl port-forward -n istio-system $(kubectl get pod -n istio-system -l app=prometheus -o jsonpath='{.items[0].metadata.name}') 9090
open 'http://localhost:9090/graph?g0.range_input=8m&g0.stacked=0&g0.expr=sum%20by(destination_workload%2C%20request_host)%20(rate(istio_requests_total%7Breporter%3D%22destination%22%2C%20destination_workload_namespace%3D%22test%22%2C%20response_code!~%225.*%22%7D%5B30s%5D))&g0.tab=0&g1.range_input=10m&g1.expr=sum%20by%20(destination_workload)(rate(istio_requests_total%7Breporter%3D%22destination%22%2C%20destination_workload_namespace%3D%22test%22%2C%20destination_workload%3D%22podinfo%22%2C%20response_code%3D~%225.*%22%7D%5B30s%5D))&g1.tab=0'
or equivalently, this query string:
sum by(destination_workload, request_host) (rate(istio_requests_total{reporter="destination", destination_workload_namespace="test", response_code!~"5.*"}[30s]))
If you look in the Aspen Mesh dashboard while the canary is running you can see the traffic split between podinfo-primary and podinfo: