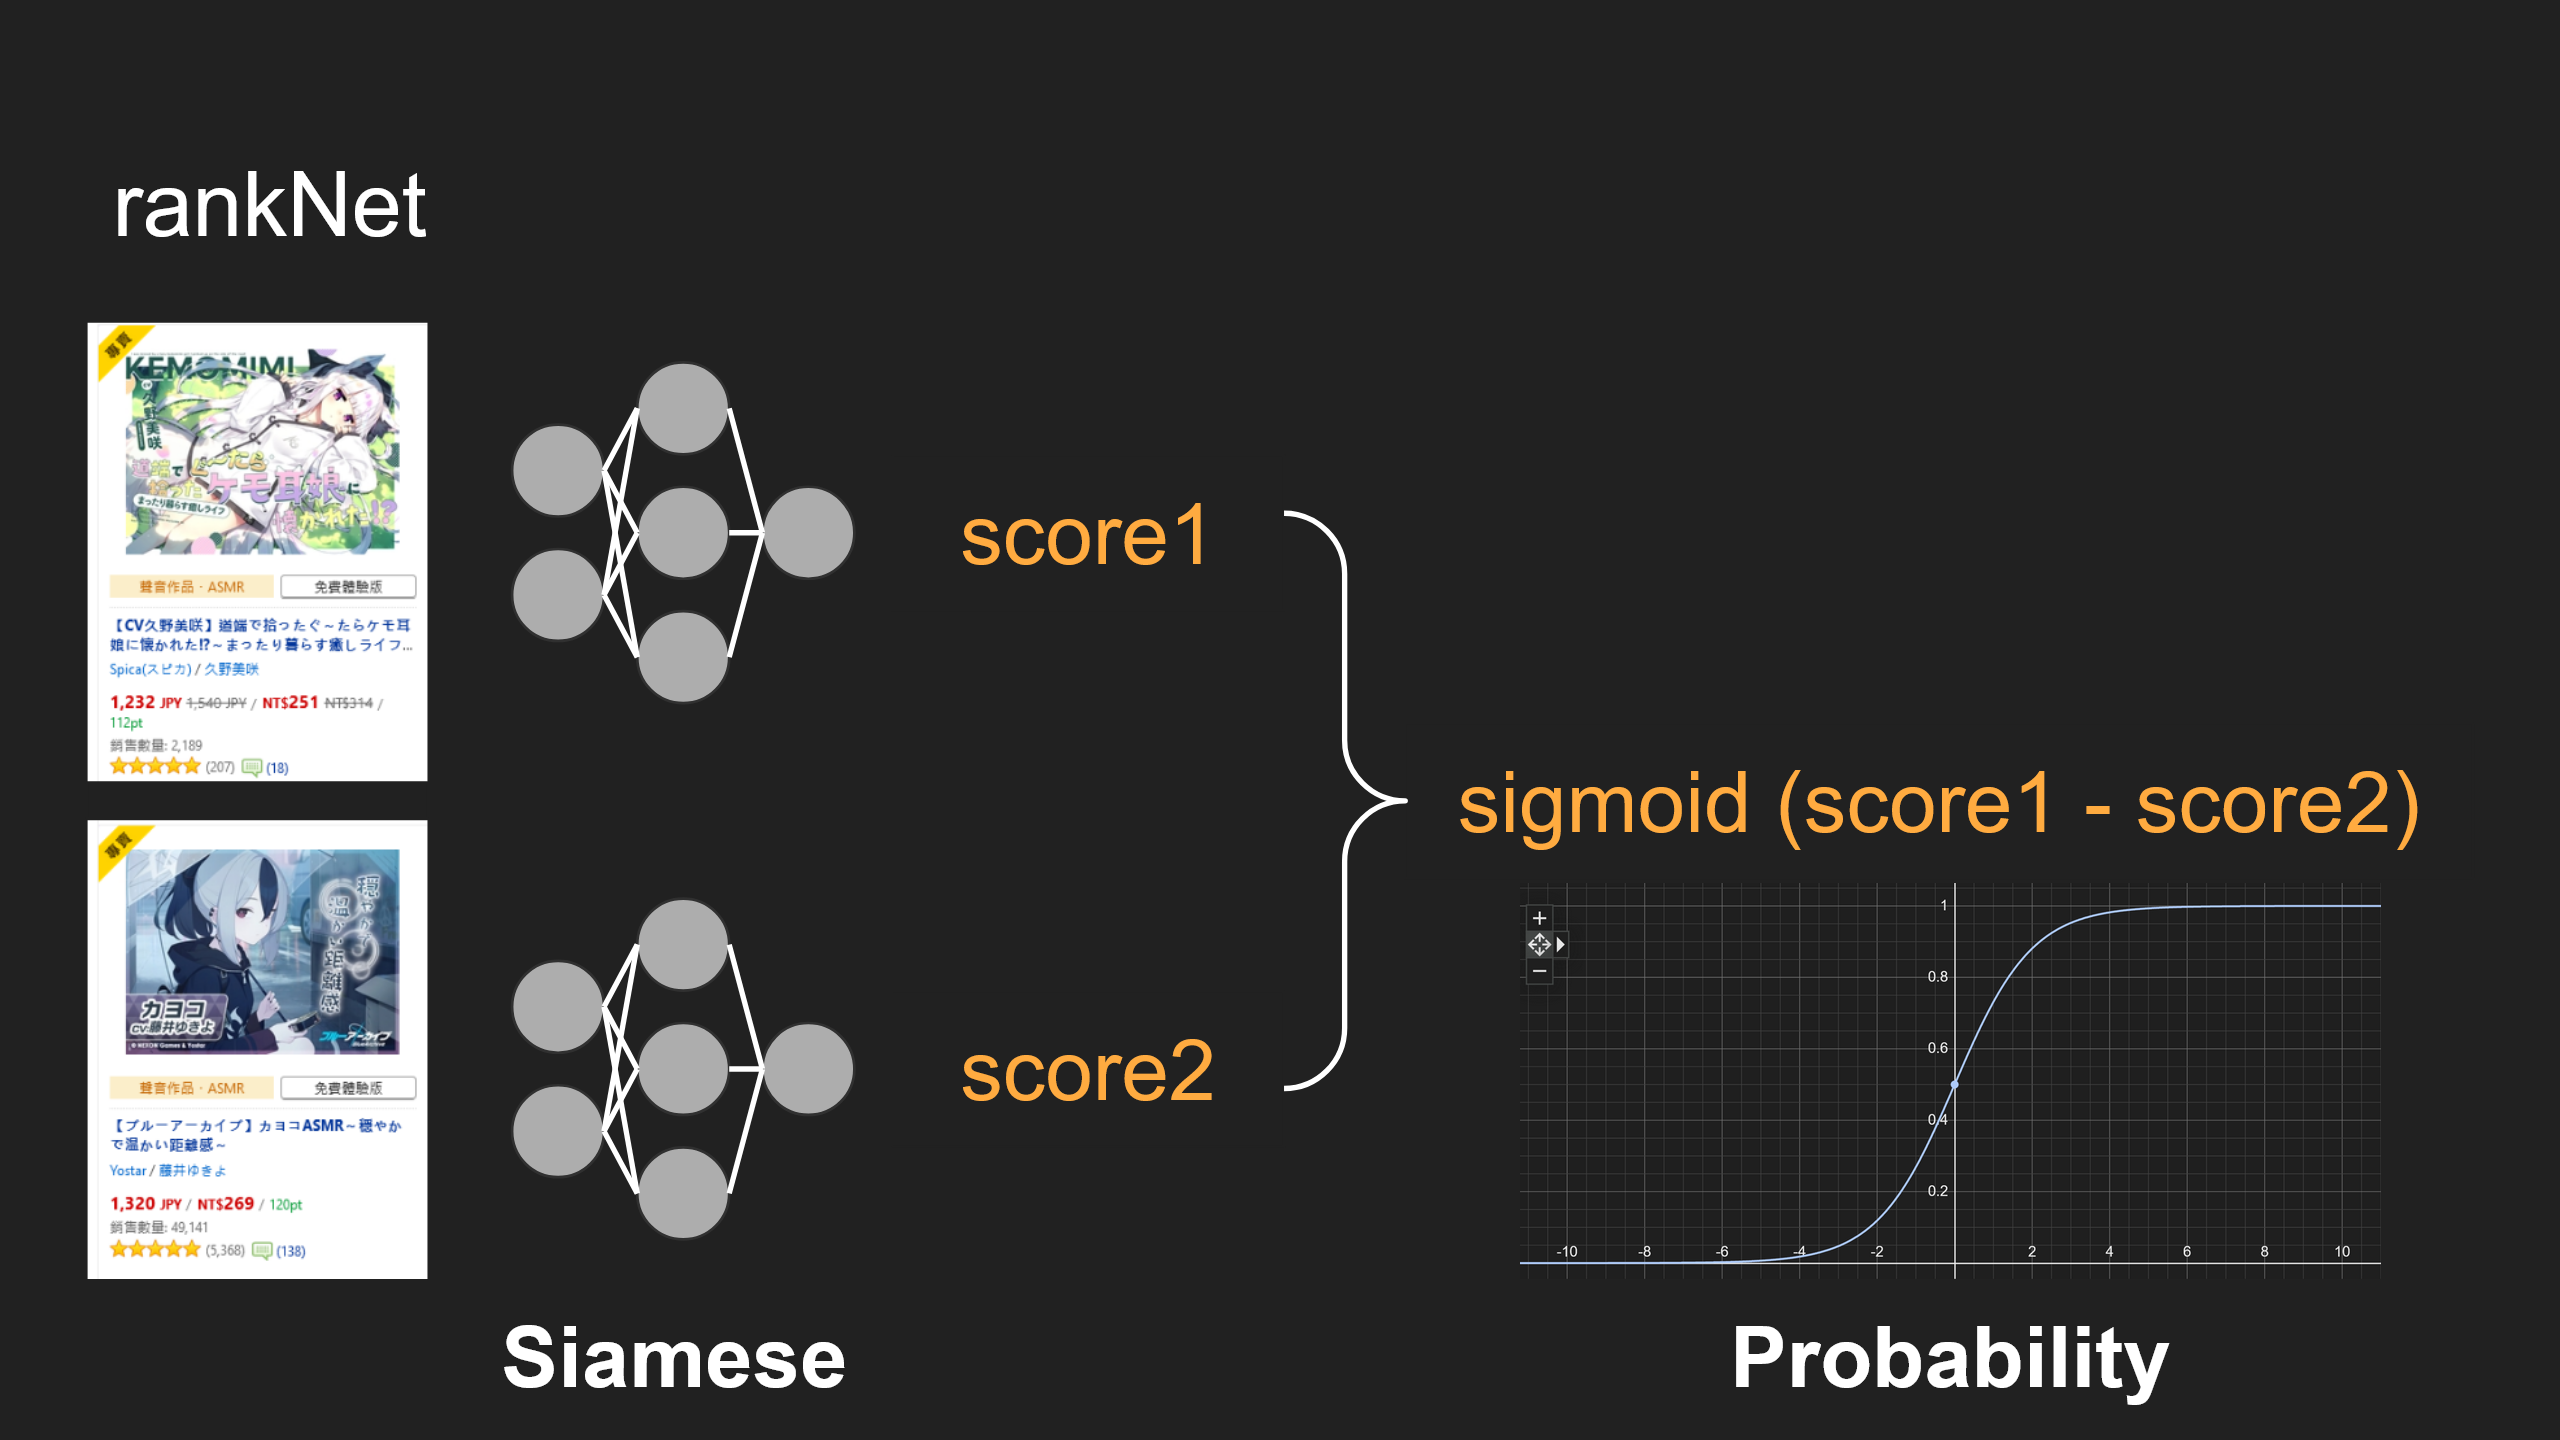
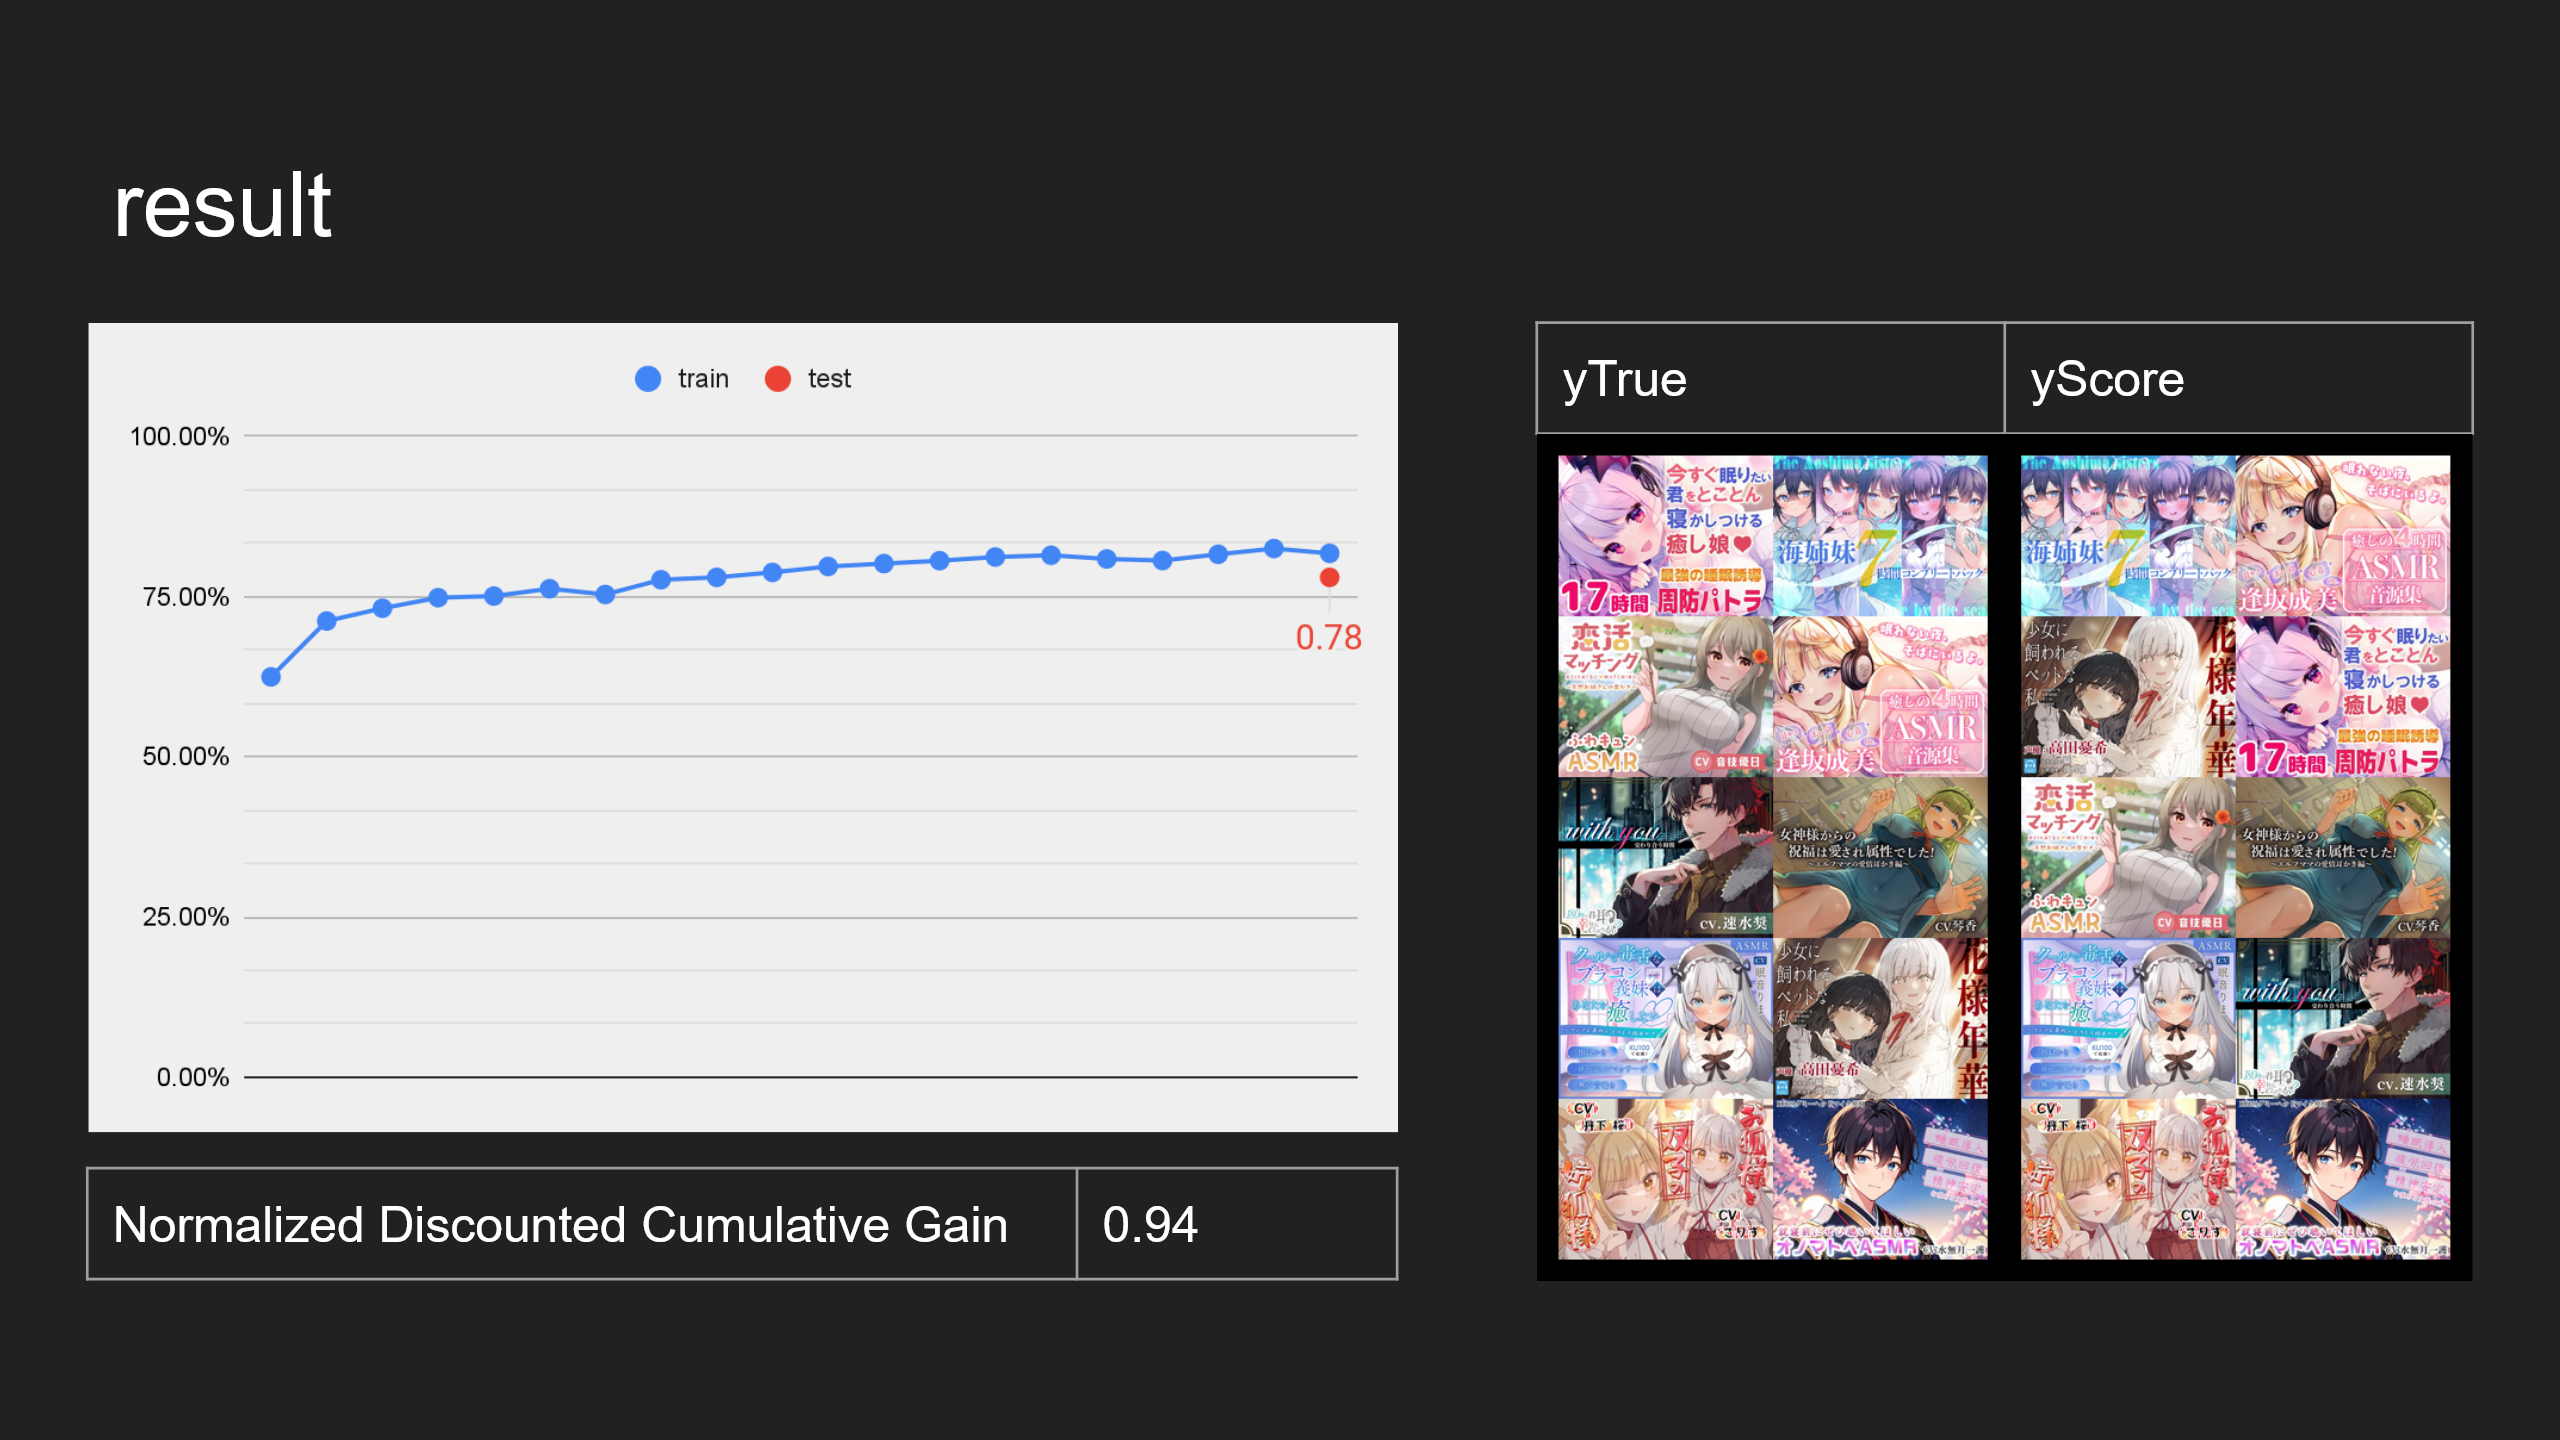
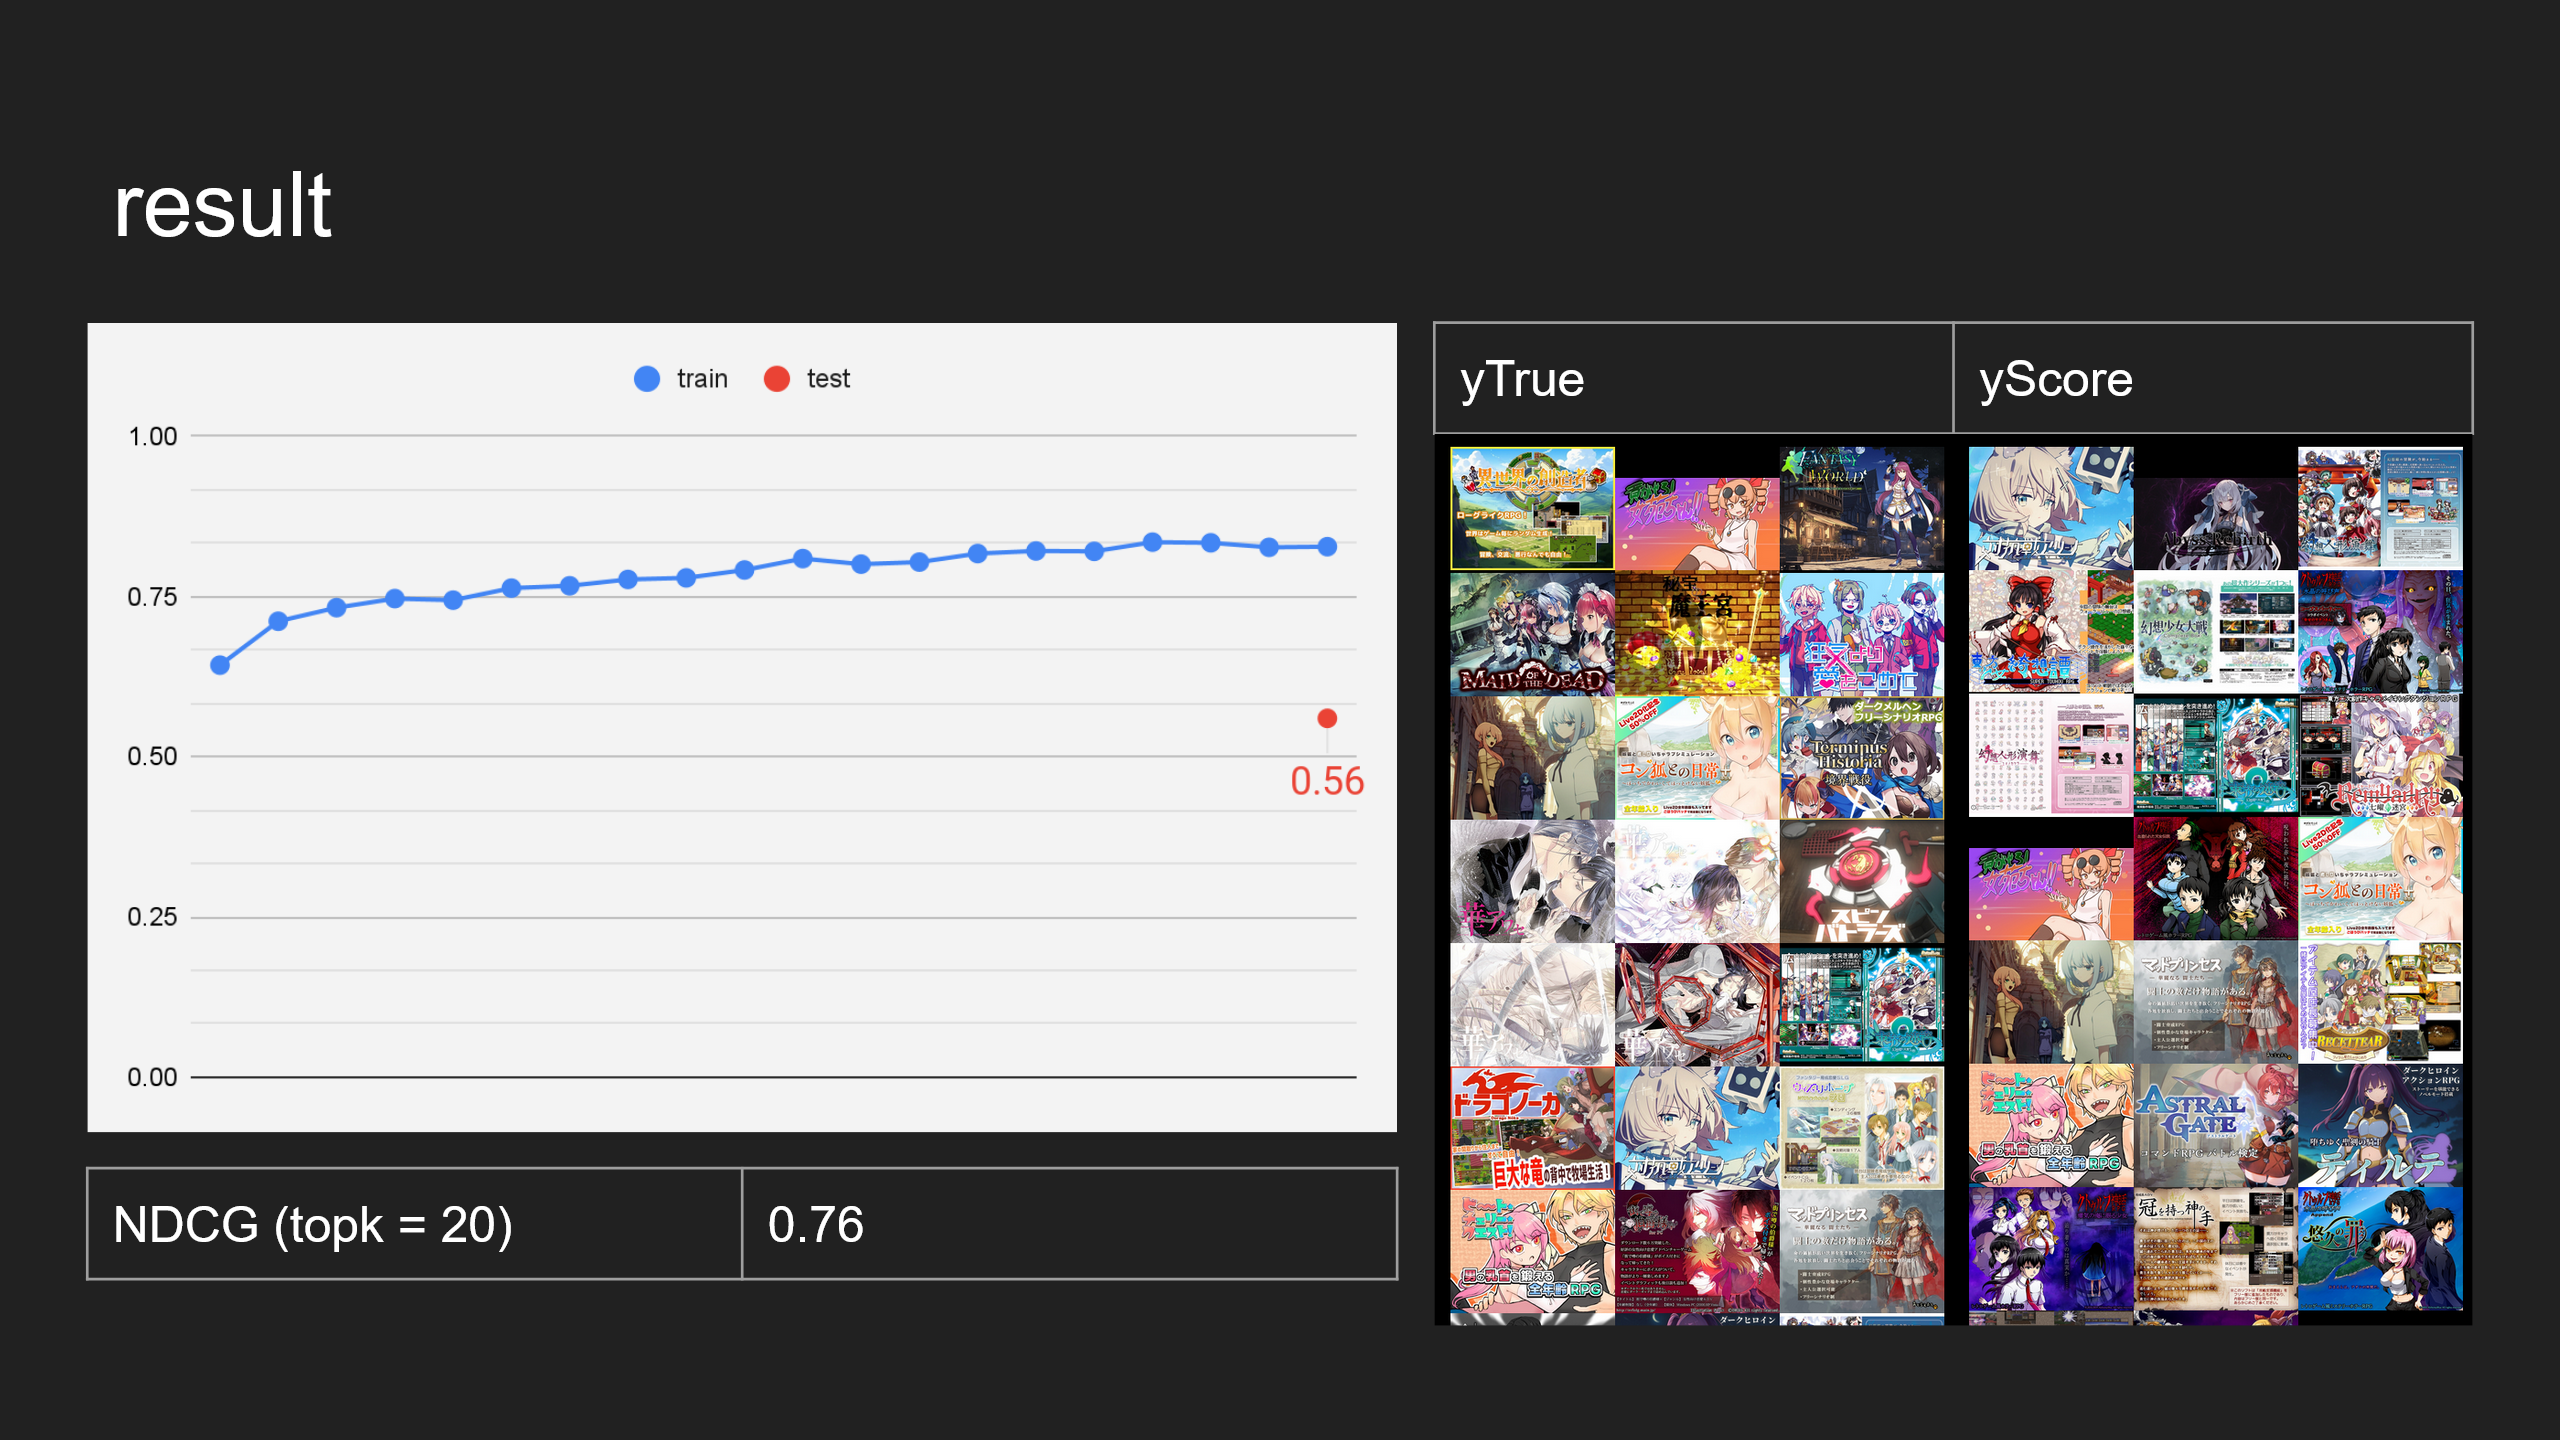
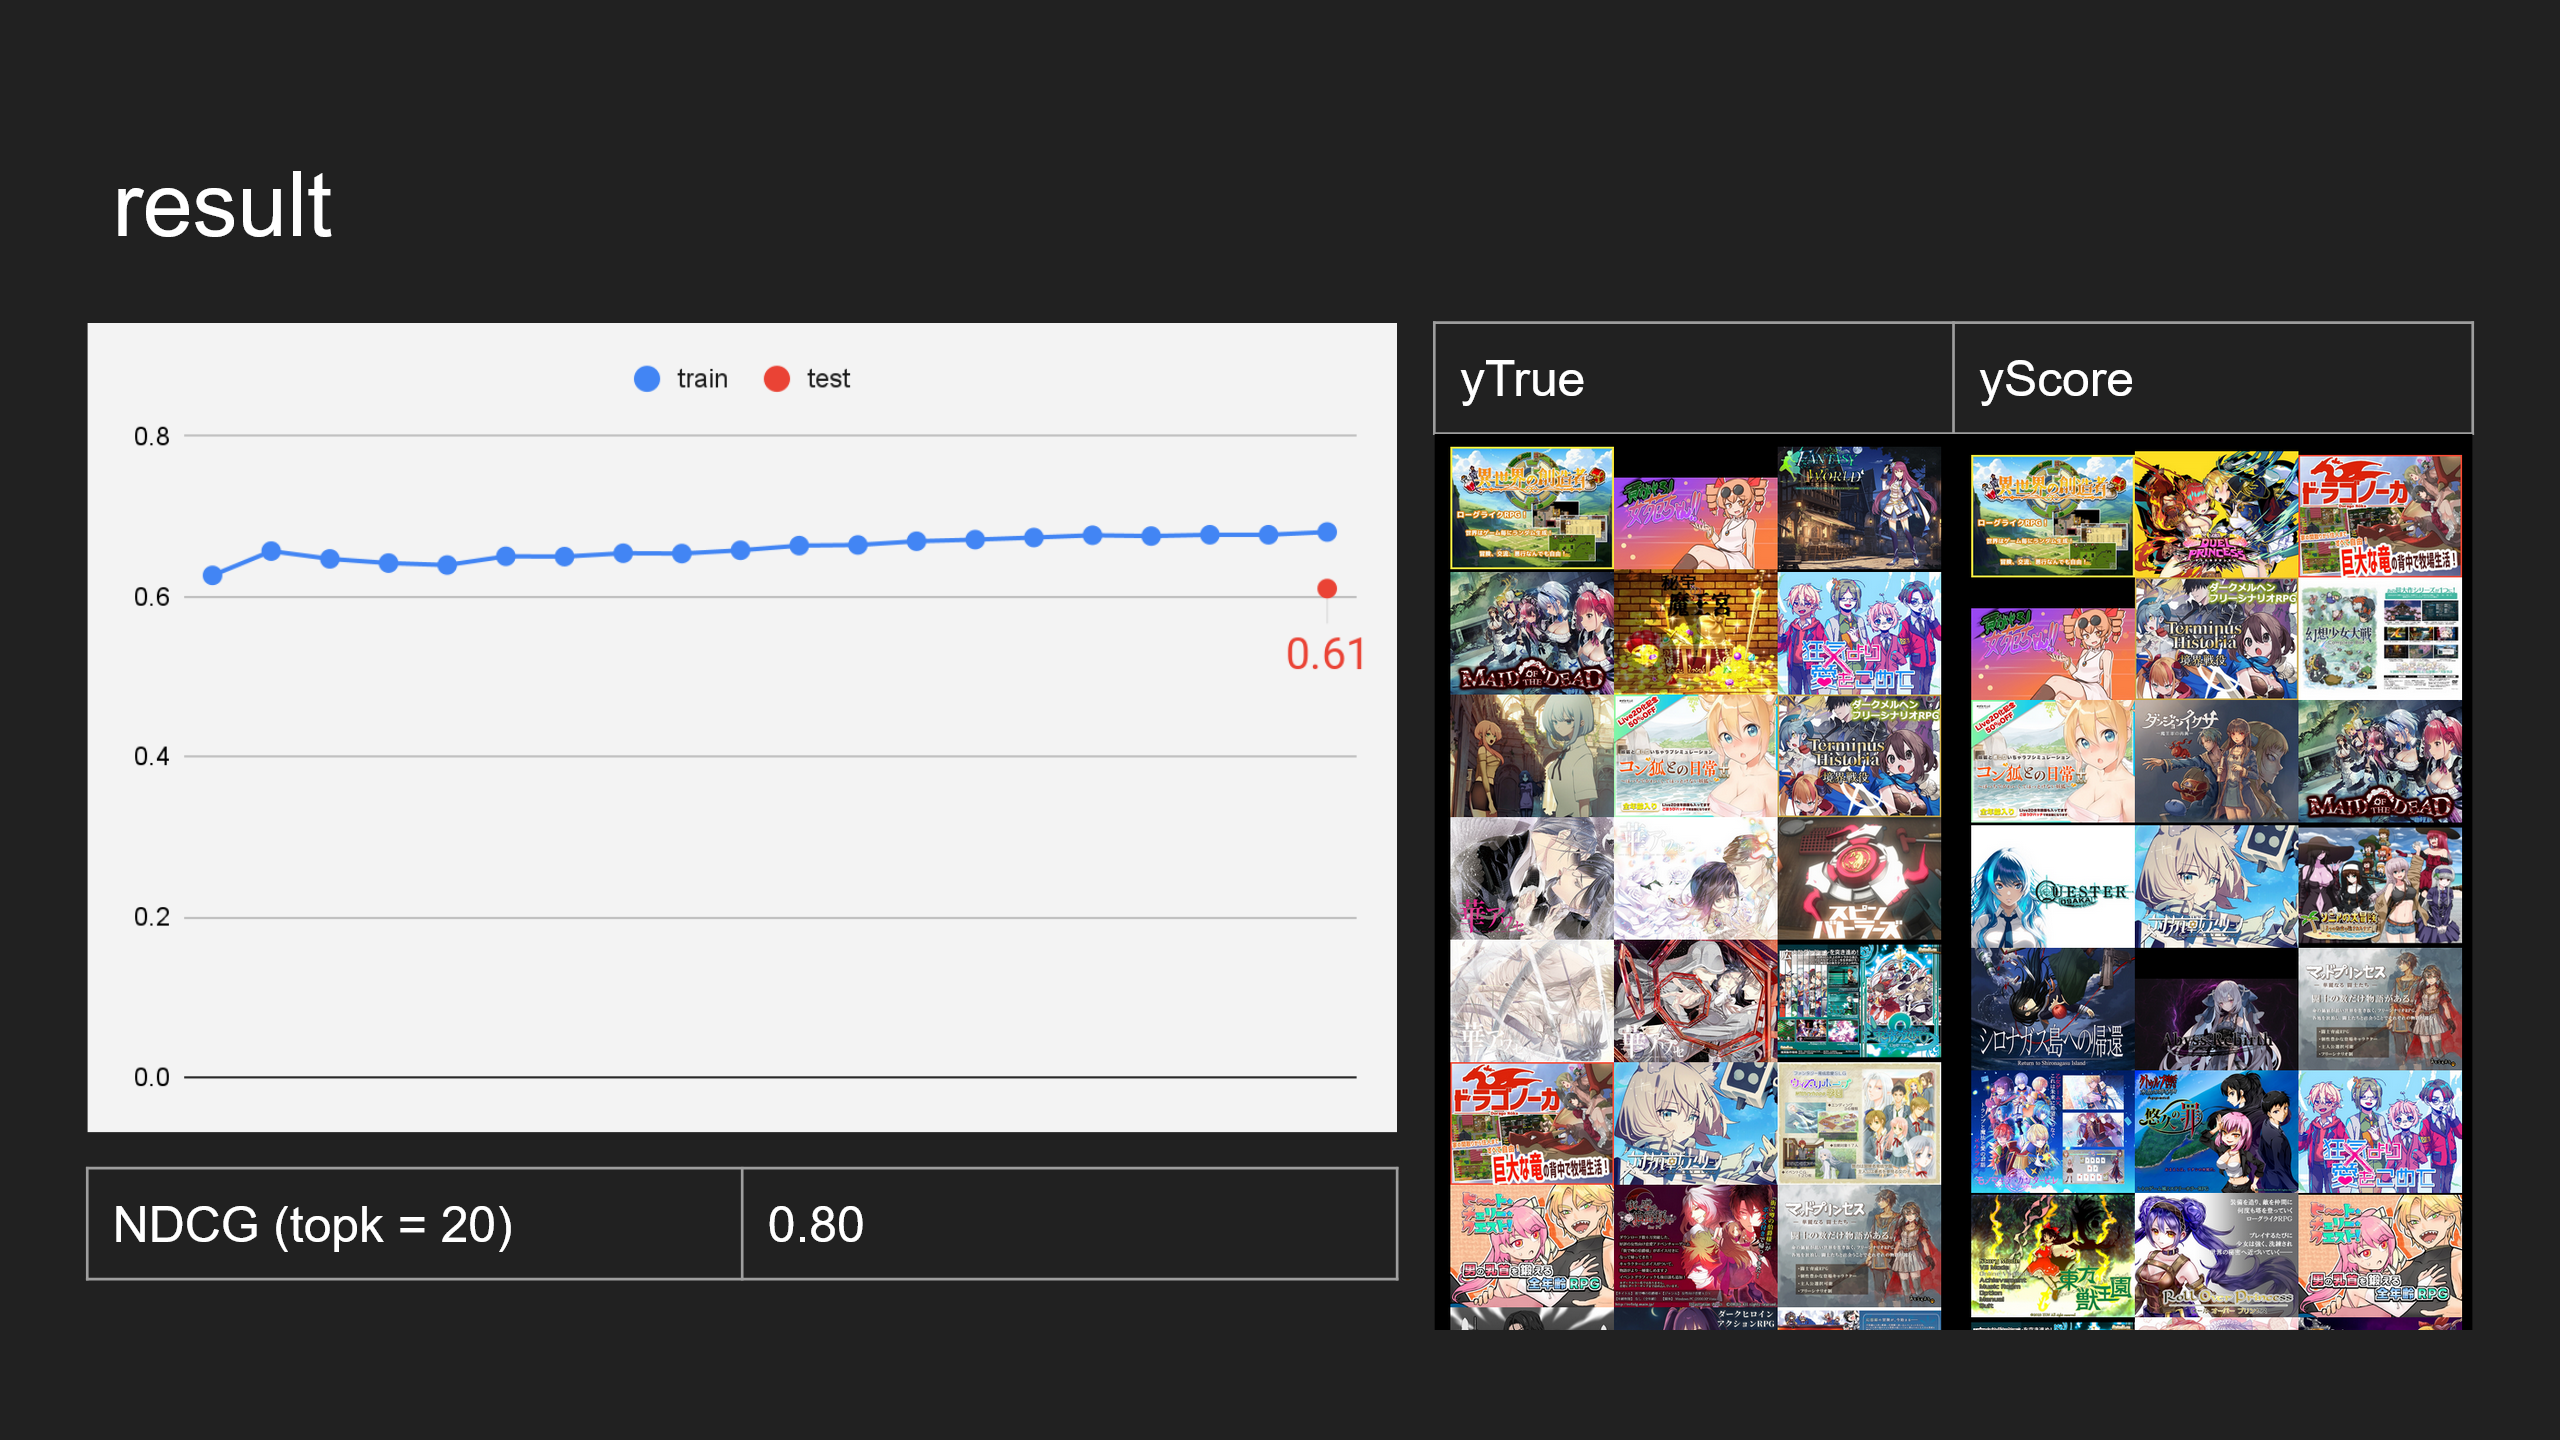
A study about learning DLsite trend function by rankNet and its distribution shift. For more detailed instructions, please see my blog post.
pip install -r requirements.txt
pip install -r pytorchRequirements.txt --index-url https://download.pytorch.org/whl/cu121
The pytorchRequirements.txt only install pytorch. Change --index-url to suit your hardware and software (CPU、GPU、cuda)
$ python -m unittest
.......
----------------------------------------------------------------------
Ran 7 tests in 0.027s

OK
Run dataset preprocessing unittest (some tests depend on timezone Asia/Taipei).
with open('./dataset/asmrAllItemDict.json', 'r') as infile:
    itemDict = json.load(infile)
with open('./dataset/asmrAllRankItem.json', 'r') as infile:
    rankItem = json.load(infile)

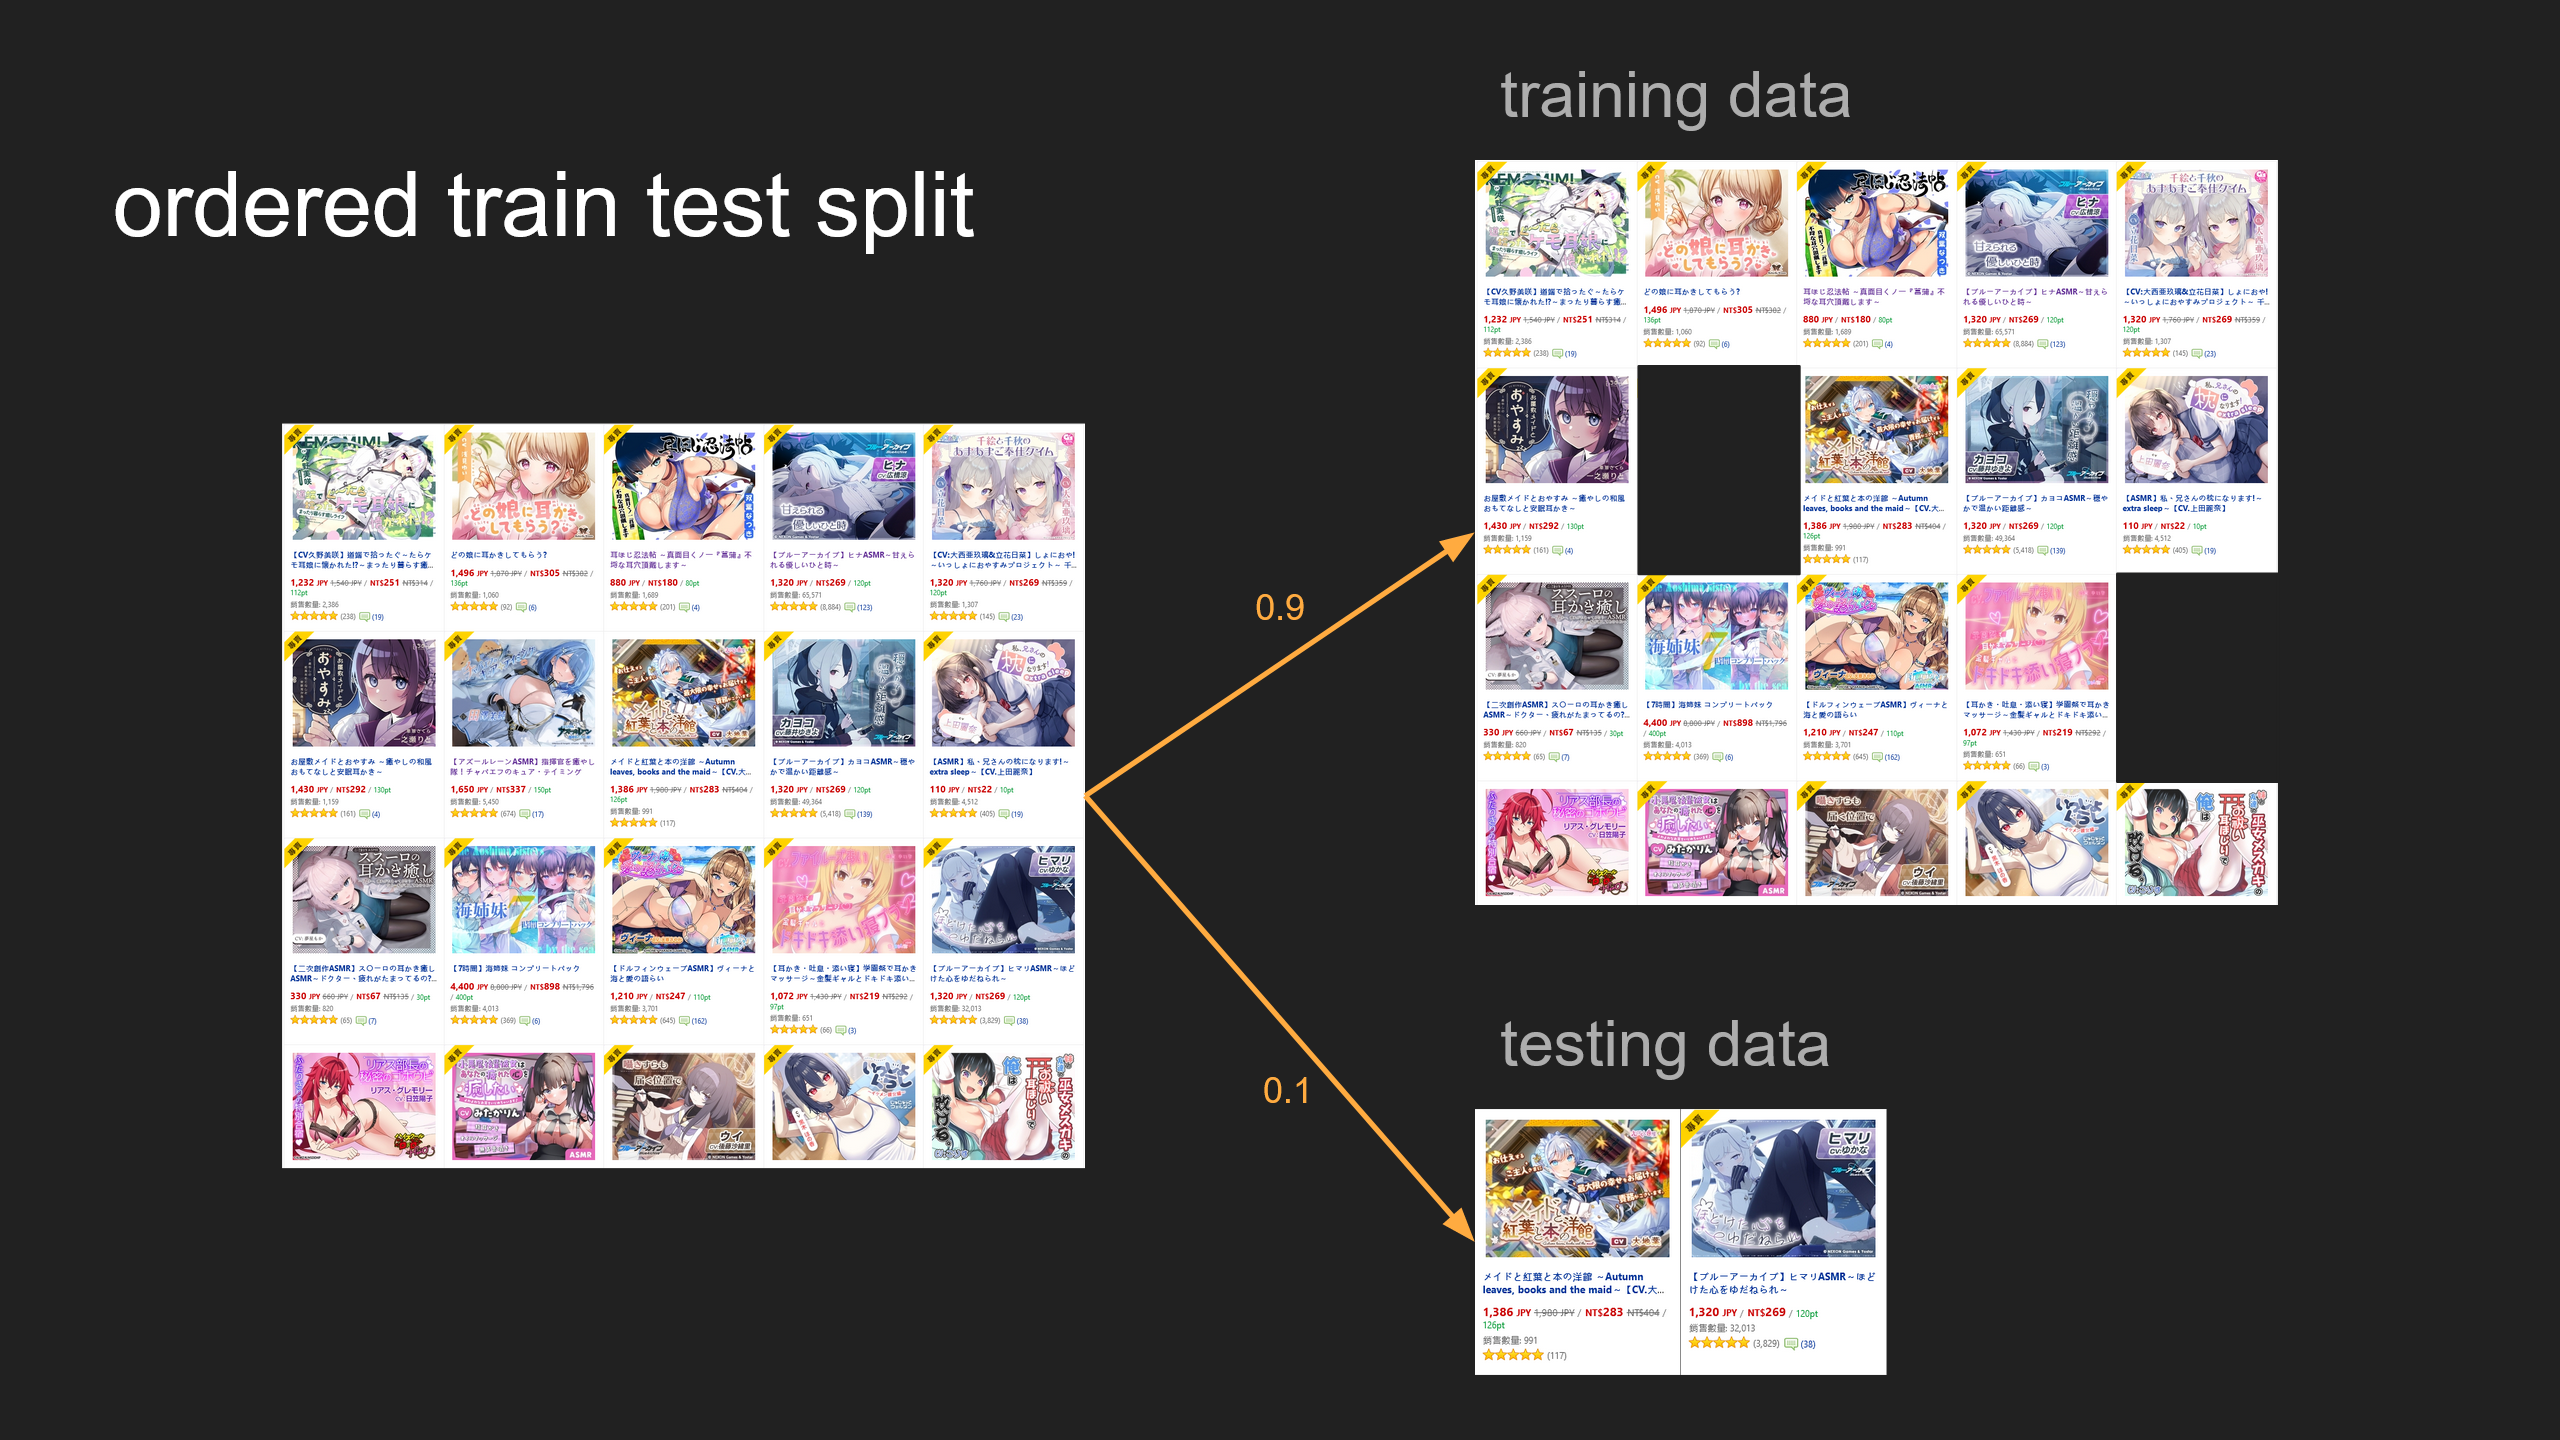
rankItem, testRankItem = orderedTrainTestSplit(rankItem, 0.1)
postivePairsDataset, minMaxScaler = getNormalizedDataset(rankItem, itemDict)
dataloader = DataLoader(postivePairsDataset, batch_size = BATCH_SIZE, shuffle = True)RankItem.jsondataset save items ranking (by order).ItemDict.jsondataset save items features.
This repository does not provide the real dataset (I do not own the copyright). But you can get dataset structure in dataset/toyItemDict.json and dataset/toyRankItem.json.
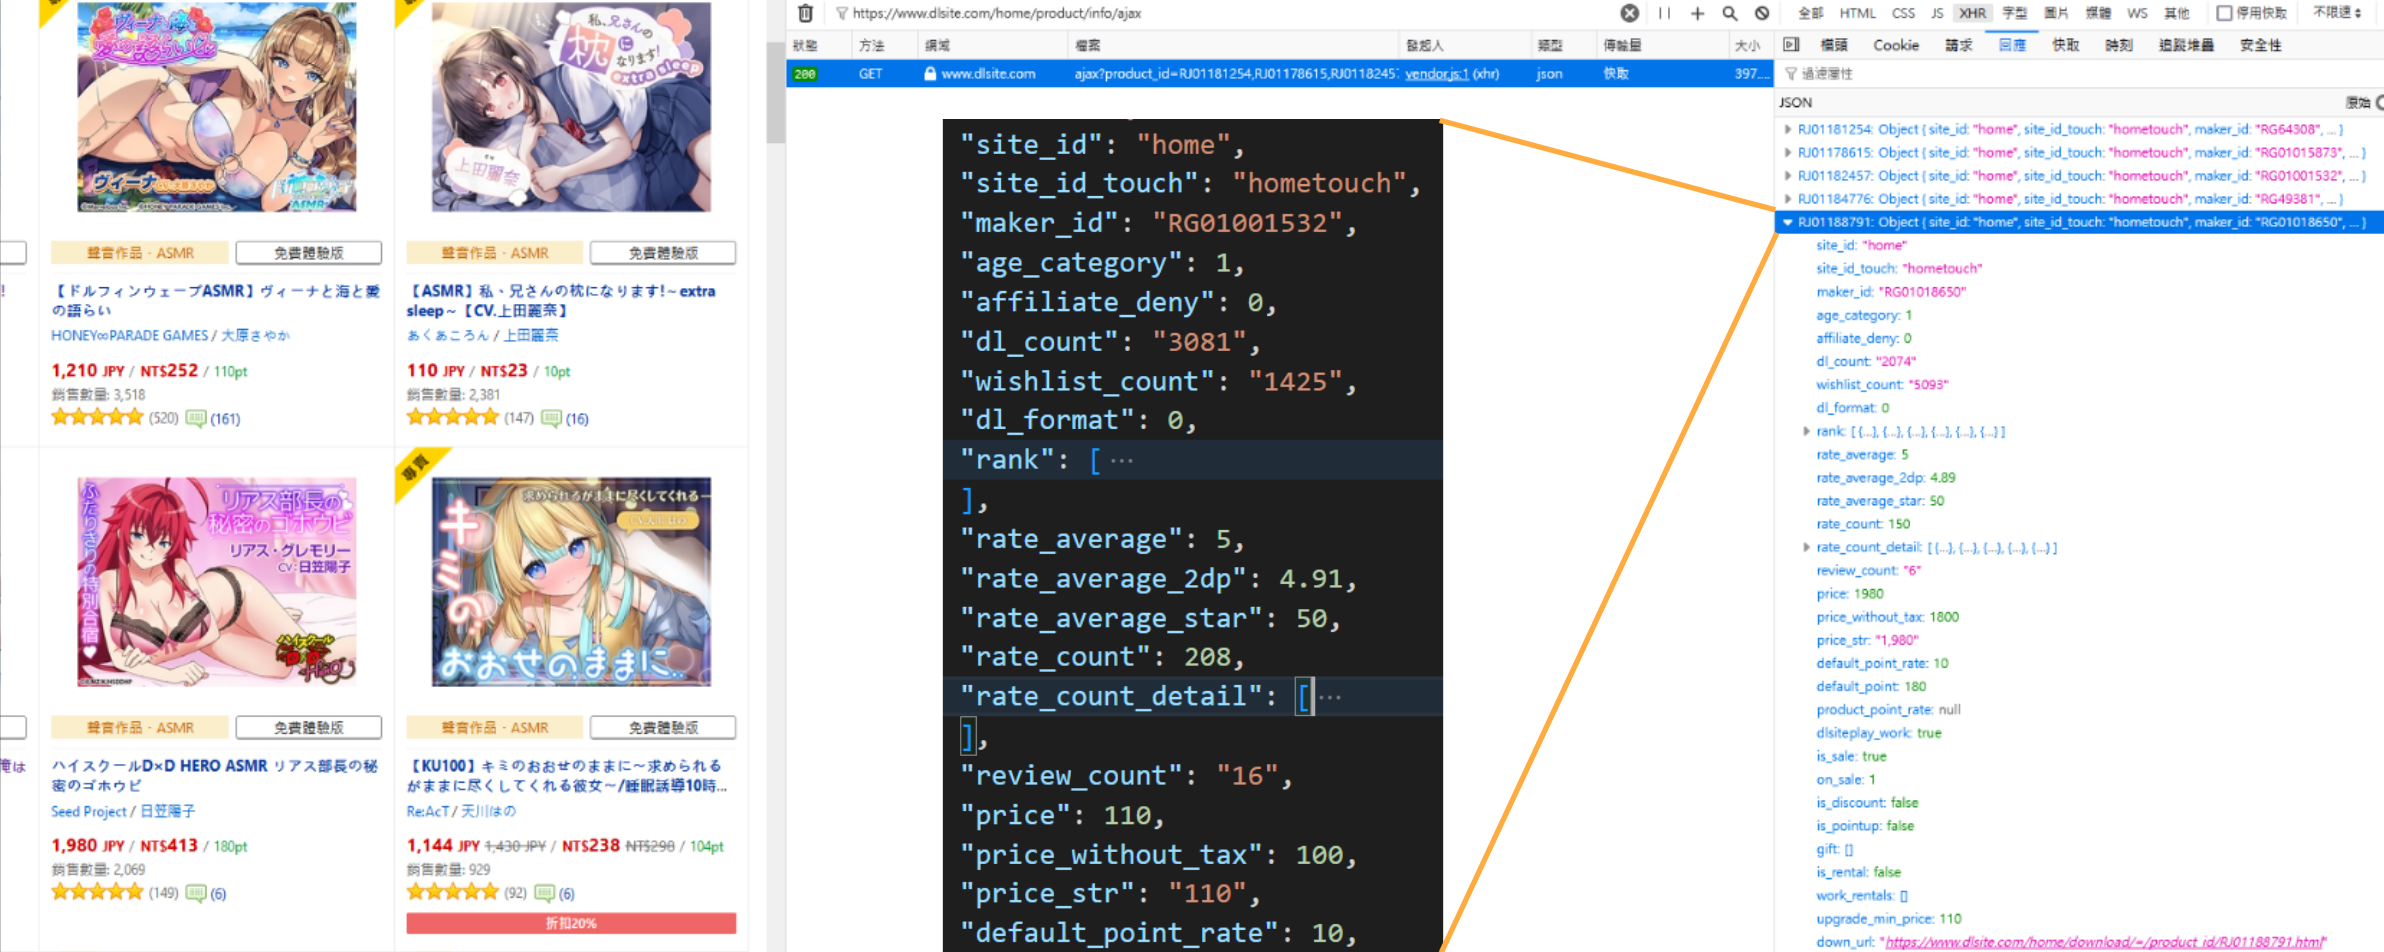
I grab dataset directly from the DLsite website.
I write dataset/getRankItem.js to help me get RankItem.json.
ItemDict.json is from DLsite API.
$ python src/hypothesisTesting.py
sameRankingPage:
KruskalResult(statistic=1.0812276101266591, pvalue=0.2984230935024443)
KruskalResult(statistic=1.2293546877250272, pvalue=0.2675325726507133)
KruskalResult(statistic=4.739247376673478, pvalue=0.02948196620438234)
KruskalResult(statistic=0.2498109742924989, pvalue=0.6172082077070977)
KruskalResult(statistic=0.1342936115544768, pvalue=0.7140211629799282)
KruskalResult(statistic=3.7993428755934544, pvalue=0.051272701398055905)
KruskalResult(statistic=2.3208088635951003, pvalue=0.12765363132515045)
KruskalResult(statistic=0.20121346233637416, pvalue=0.6537431519333335)
KruskalResult(statistic=0.16173364059725473, pvalue=0.6875653860322029)
KruskalResult(statistic=0.00029763515339625575, pvalue=0.9862354939706918)
KruskalResult(statistic=2.6357363673068495, pvalue=0.10448360817354285)
KruskalResult(statistic=5.334489670983912, pvalue=0.020907460507742472)
================================================================
otherRankingPage:
KruskalResult(statistic=5.707629175795012, pvalue=0.016891336683534482)
KruskalResult(statistic=5.662375604642771, pvalue=0.017332631063601354)
KruskalResult(statistic=112.85008127691606, pvalue=2.3272265345661586e-26)
KruskalResult(statistic=0.1183531380745446, pvalue=0.7308275534196667)
KruskalResult(statistic=25.143537615271654, pvalue=5.321769076621548e-07)
KruskalResult(statistic=17.96143852177434, pvalue=2.2542565418223413e-05)
KruskalResult(statistic=10.723489544548972, pvalue=0.0010578398572342951)
KruskalResult(statistic=7.095480025151965, pvalue=0.007727859157872331)
KruskalResult(statistic=1.2862035283540991, pvalue=0.25674877258145284)
KruskalResult(statistic=5.224849009453471, pvalue=0.022266379457297883)
KruskalResult(statistic=0.9354796779285227, pvalue=0.3334430705576221)
KruskalResult(statistic=54.25046497908814, pvalue=1.7649537781872029e-13)
Hypothesis Testing result shows training、testing with different ranking page will occer distribution shift.
==========================
originalCurrentRateRecords
originalMean: 0.56
originalStd: 0.02
==========================
modifiedCurrentRateRecords (L1、L2 regularization and normalization testing data)
modifiedMean: 0.61
modifiedStd: 0.01
==========================
hypothesisTesting
Ttest_indResult(statistic=-11.262083804733697, pvalue=1.1346763672447975e-13)
KruskalResult(statistic=28.839030684057438, pvalue=7.865007317601521e-08)
==========================
Add L1、L2 regularization and normalization testing data to improve distribution shift.
MIT License
