Sediment Analyst is a modularized Python package and dash app that enables sedimentological analyses. By using sieving datasets as input, Sediment Analyst computes sediment statistics. For a complete list of computed statistics see section below (Outputs). For using our app, please watch our video tutorial here.
Python > 3.0 is required, but Python 3.9 is preferable due to stable behaviors in regard to the packages.
The used Python libraries are: numpy, scipy, pathlib, matplotlib, openpyxl, pandas, seaborn, dash, pyproj, plotly.
Standard libraries include: re, locale, logging, glob, sys, os, math
Important! Checkout the requirements.txt file for the version requirements of the packages.
The input data for sediment-analyst consists of CSV files for each sediment sample. Accepted extensions are therefore .csv and .xlsx.
Use Sediment Analyst locally by cloning this repository or online with our app. Checkout:
$ git clone https://github.com/beatriznegreiros/sediment-analyst
For running the code in your computer, clone this repository and make sure to install the necessary packages (checkout the requirements.txt file). Change the input parameters in the config.py and run main.py in the subpackage analyzer.
Please note that the plots provided in the analyzer subpackage are static (not interactive plots). These may be useful for reports and single sediment sample analyses.
Sediment Analyst features a novel app for enabling interactive analyses. The app can be hosted locally if you run web_application.py in the app subpackage.
Click on the link provided by your console (the link is similar to http://127.0.0.1), which is your local host (hosted in your own PC and not served on the web). We provide a full video tutorial on how
you can correctly input where the index information is, so that Sediment Analyst can parse your data files, in case you are not using our template as input file. Optional inputs for the app are: latitude and longitude, SF (sphericity index) and Porosity index.
The app will also be served online soon. More information will be released in February 2023.
Sediment Analyst computes the following:
- A summary of sediment characteristics, which can be exported as csv:
- d10, d16, d25, d30, d50, d84, d90.
- Mean grain size, geometric mean grain size (Bunte and Abt, 2001), grain size standard deviation, geometric standard deviation (Frings et al., 2011).
- Sorting index, Fredle index.
- Skewness and kurtosis.
- Coefficient of uniformity, curvature coefficient.
- Porosity estimators according to empirical equations available in the literature:
- Carling and Reader (1982)
- Wu and Wang (2006)
- Wooster et al. (2008): recommended for gravel-beds with geometric standard deviation between 0.004 m and 0.018 m.
- Frings et al. (2011)
- Hydraulic conductivity estimators computed with the Kozeny-Carman Equation. Hydraulic Conductivity (kf) is computed in m/s with each of the above-mentioned computed porosity values.
- Cumulative percentages according to the Wentworth scale.
- Cumulative grain size distribution curves, which are available as:
- Static plots per sample with the analyzer subpackage.
- Interactive plots with user-selected samples using the app subpackage.
- Only in the app:
- Bar chart of statistics.
- Interactive map listing sample information (optional, is generated when latitude (y) and longitude (x) values are available).
For more information see the readthedocs of the class StatisticalAnalyzer.
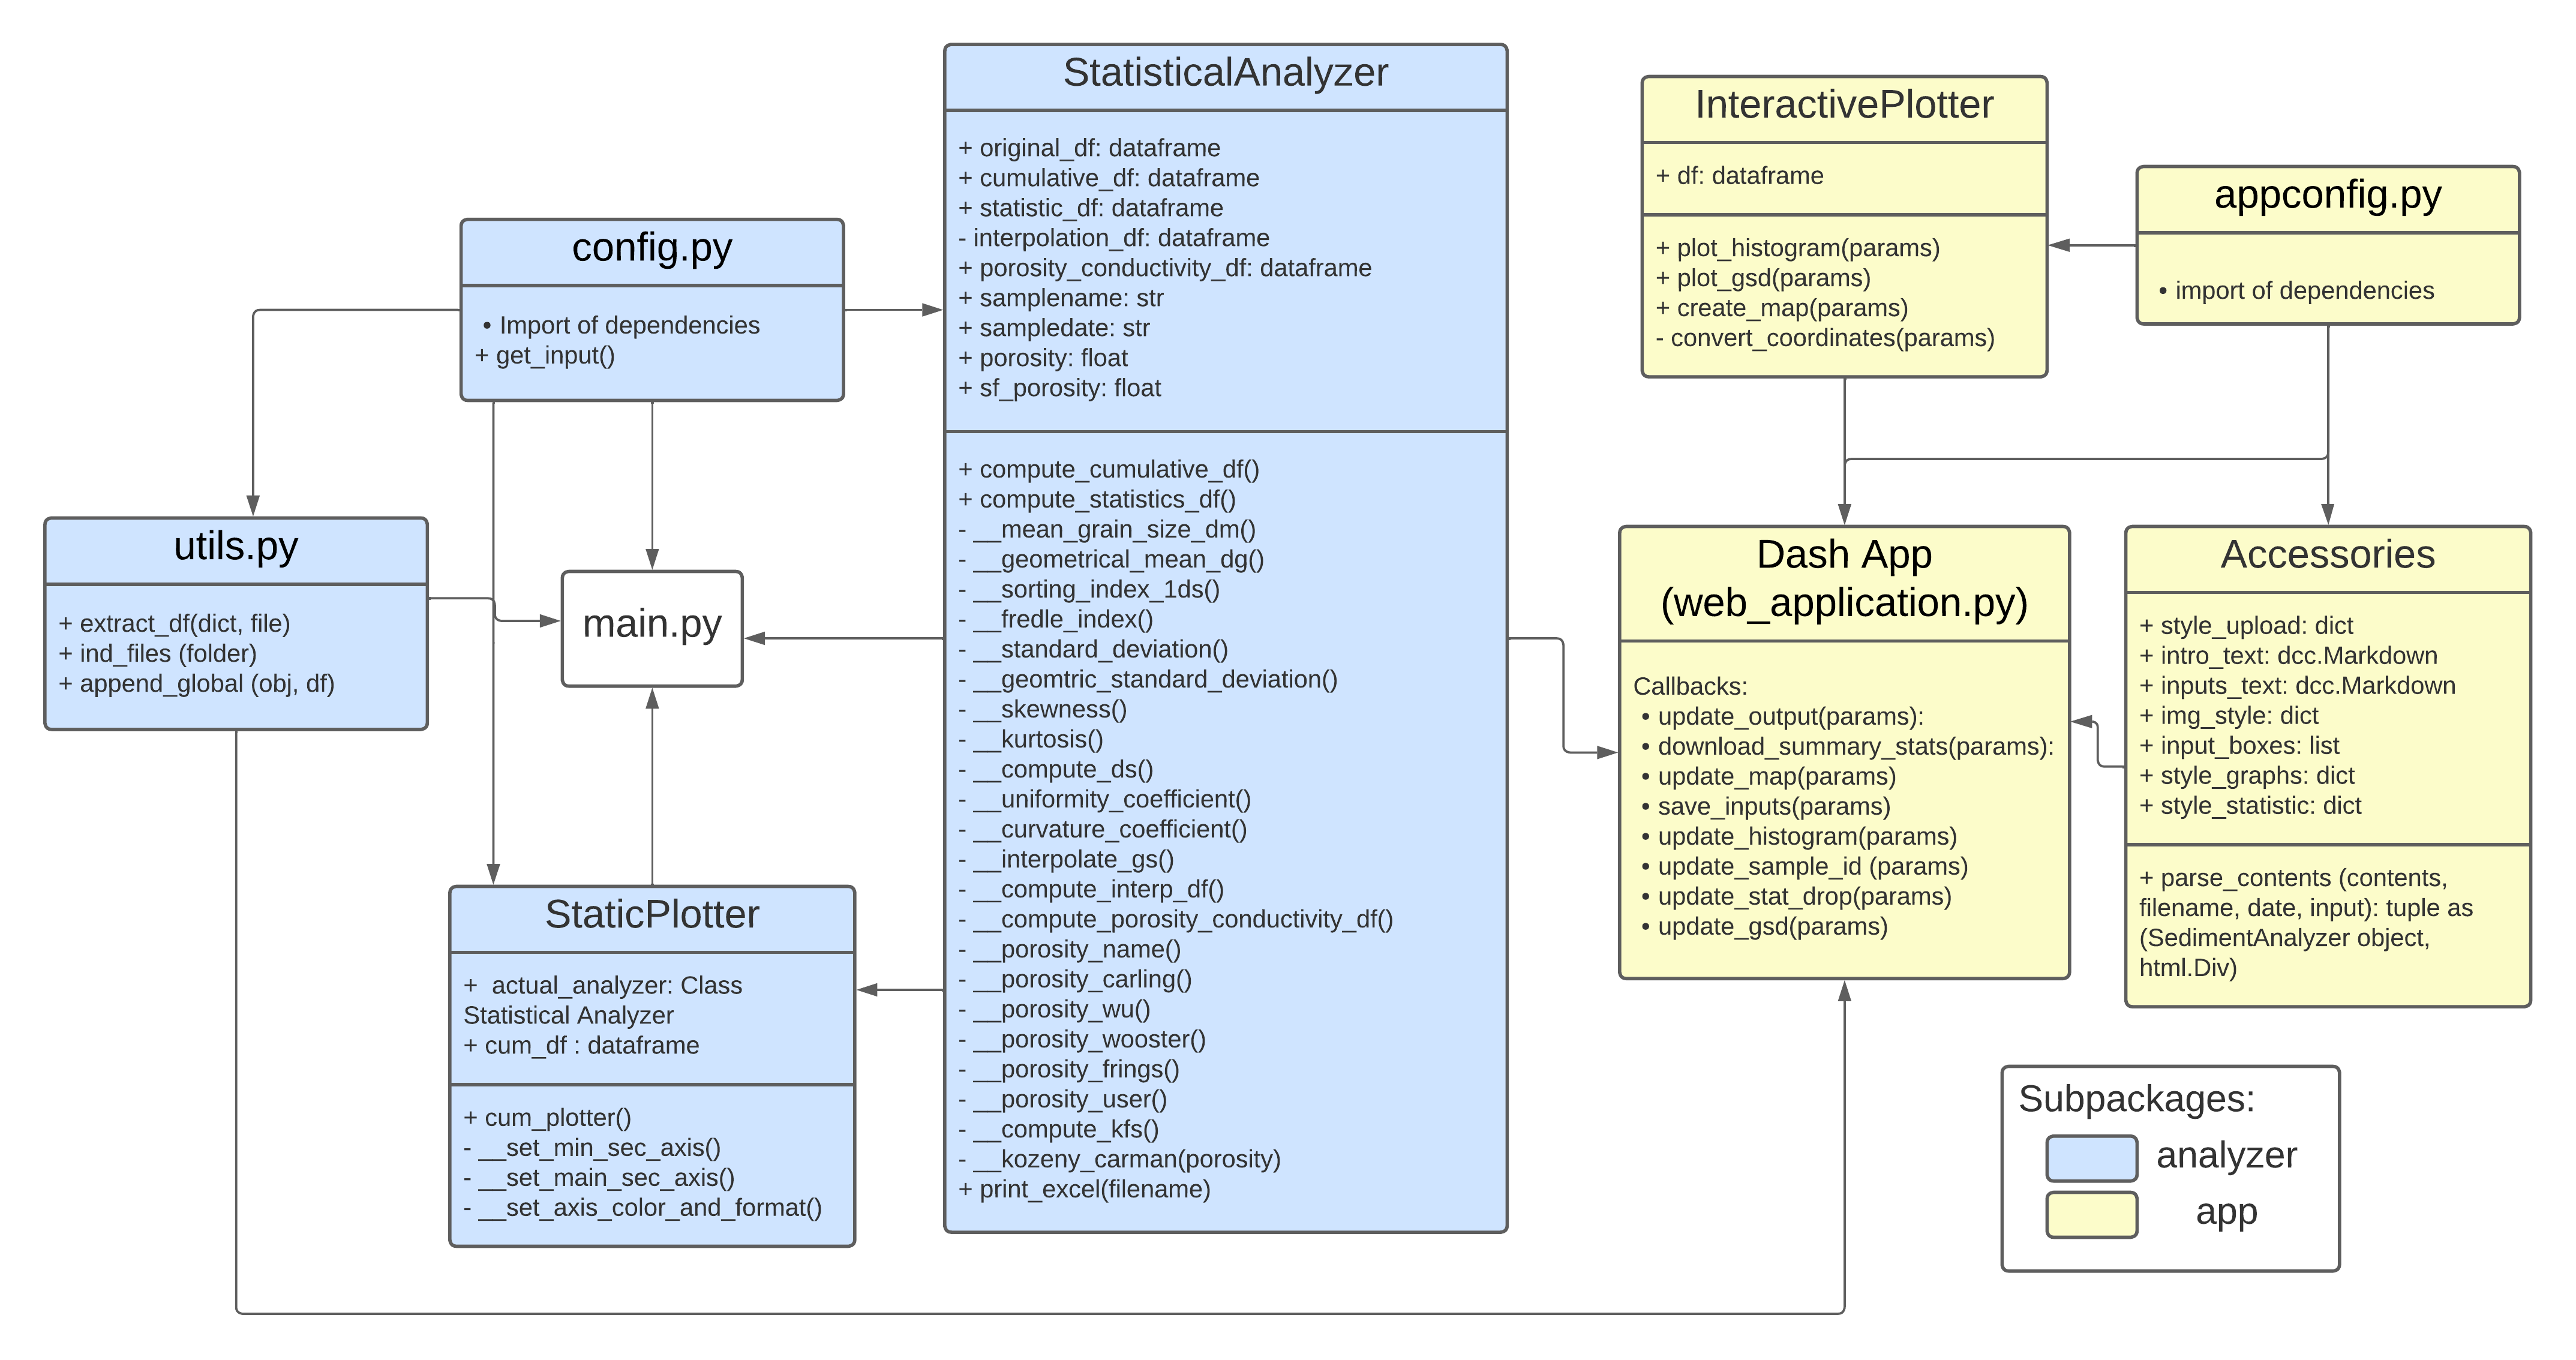
Sediment Analyst is structured in two Python subpackagess: analyzer and app. The app subpackage imports the analyzer subpackage for computing sediment statistics and for using utils.

Access the readthedocs for checking the code documentation. We recommend, however, the usage of our video tutorial for the app.

