Add the Swarm Nodes Dashboard
From the left pane, select +, then select import:

Import the Dashboard from Grafana, by providing the ID: 7461:

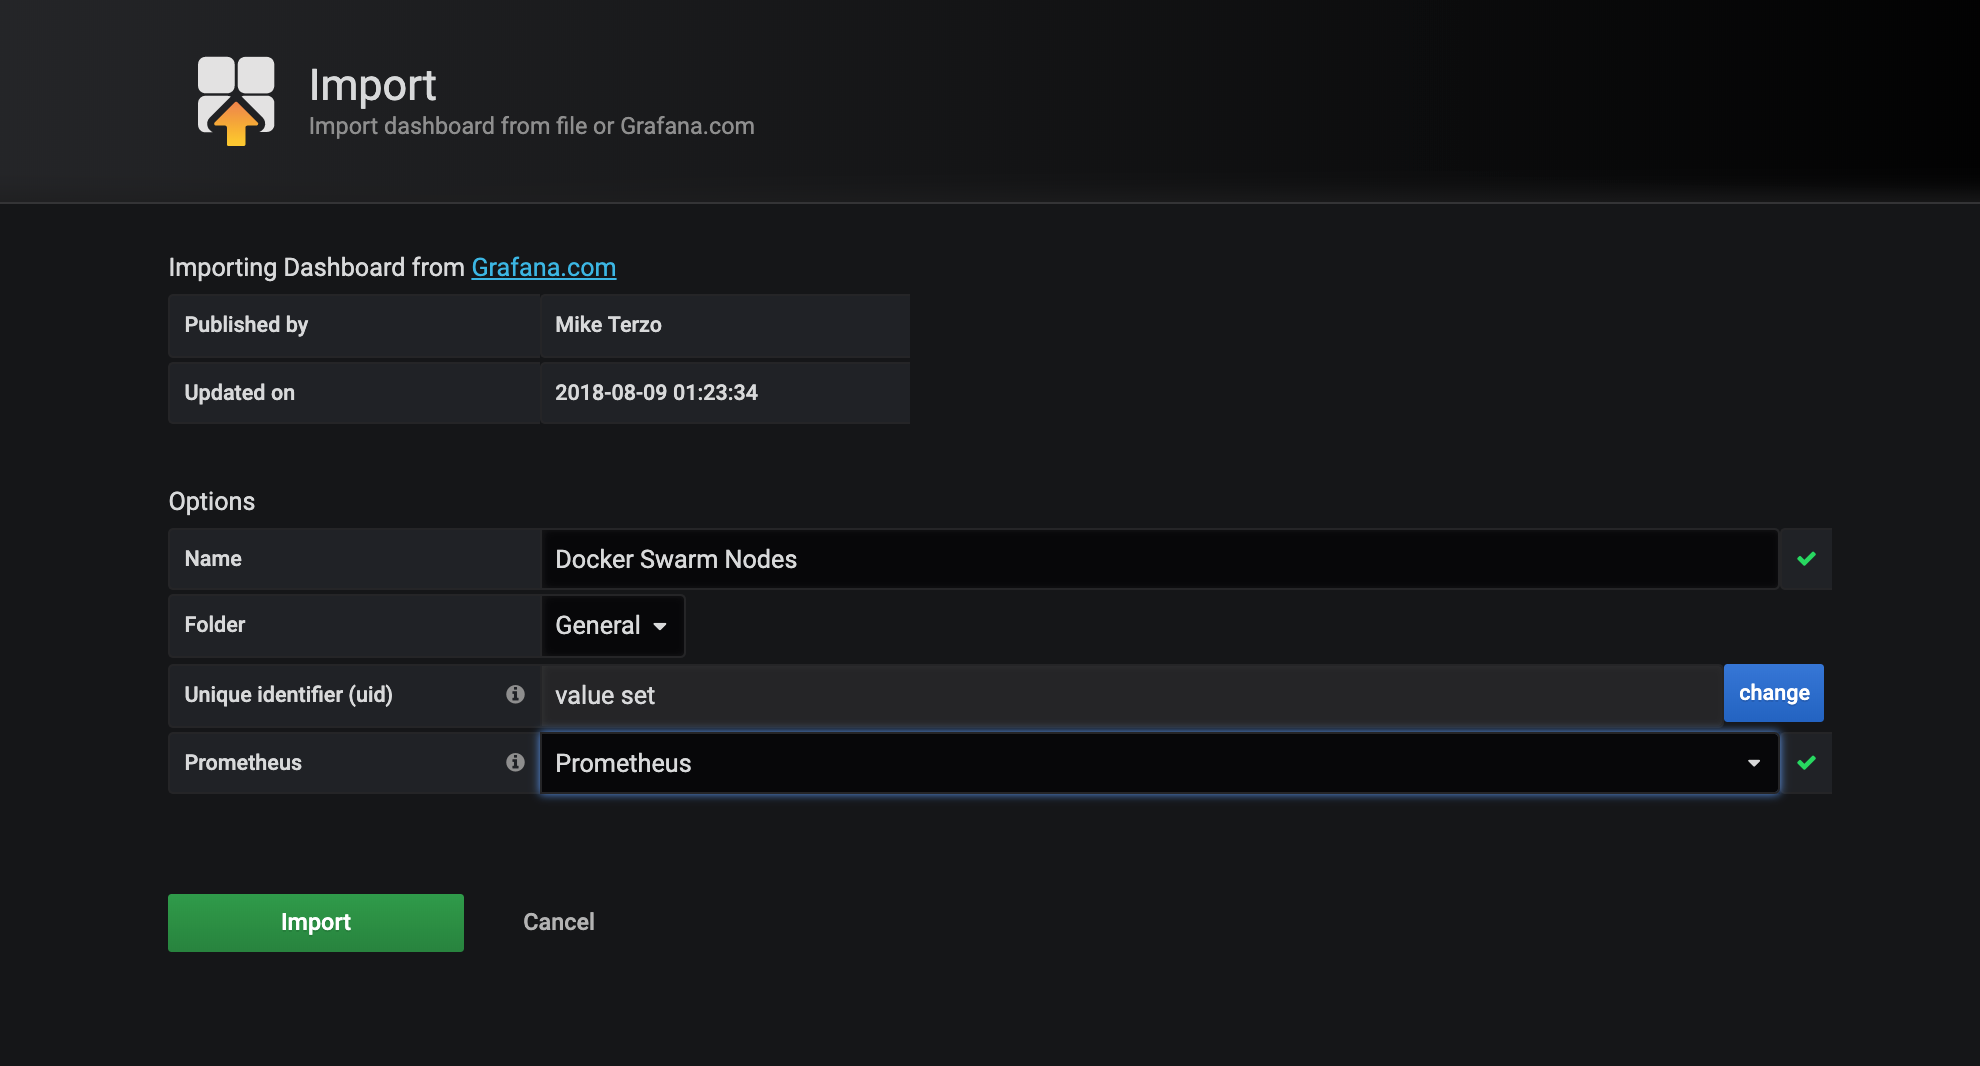
Select your Prometheus Data Source:
Your Dashboard should look like this:

Resource:
From the left pane, select +, then select import:
Import the Dashboard from Grafana, by providing the ID: 7461:
Select your Prometheus Data Source:
Your Dashboard should look like this:
Resource: