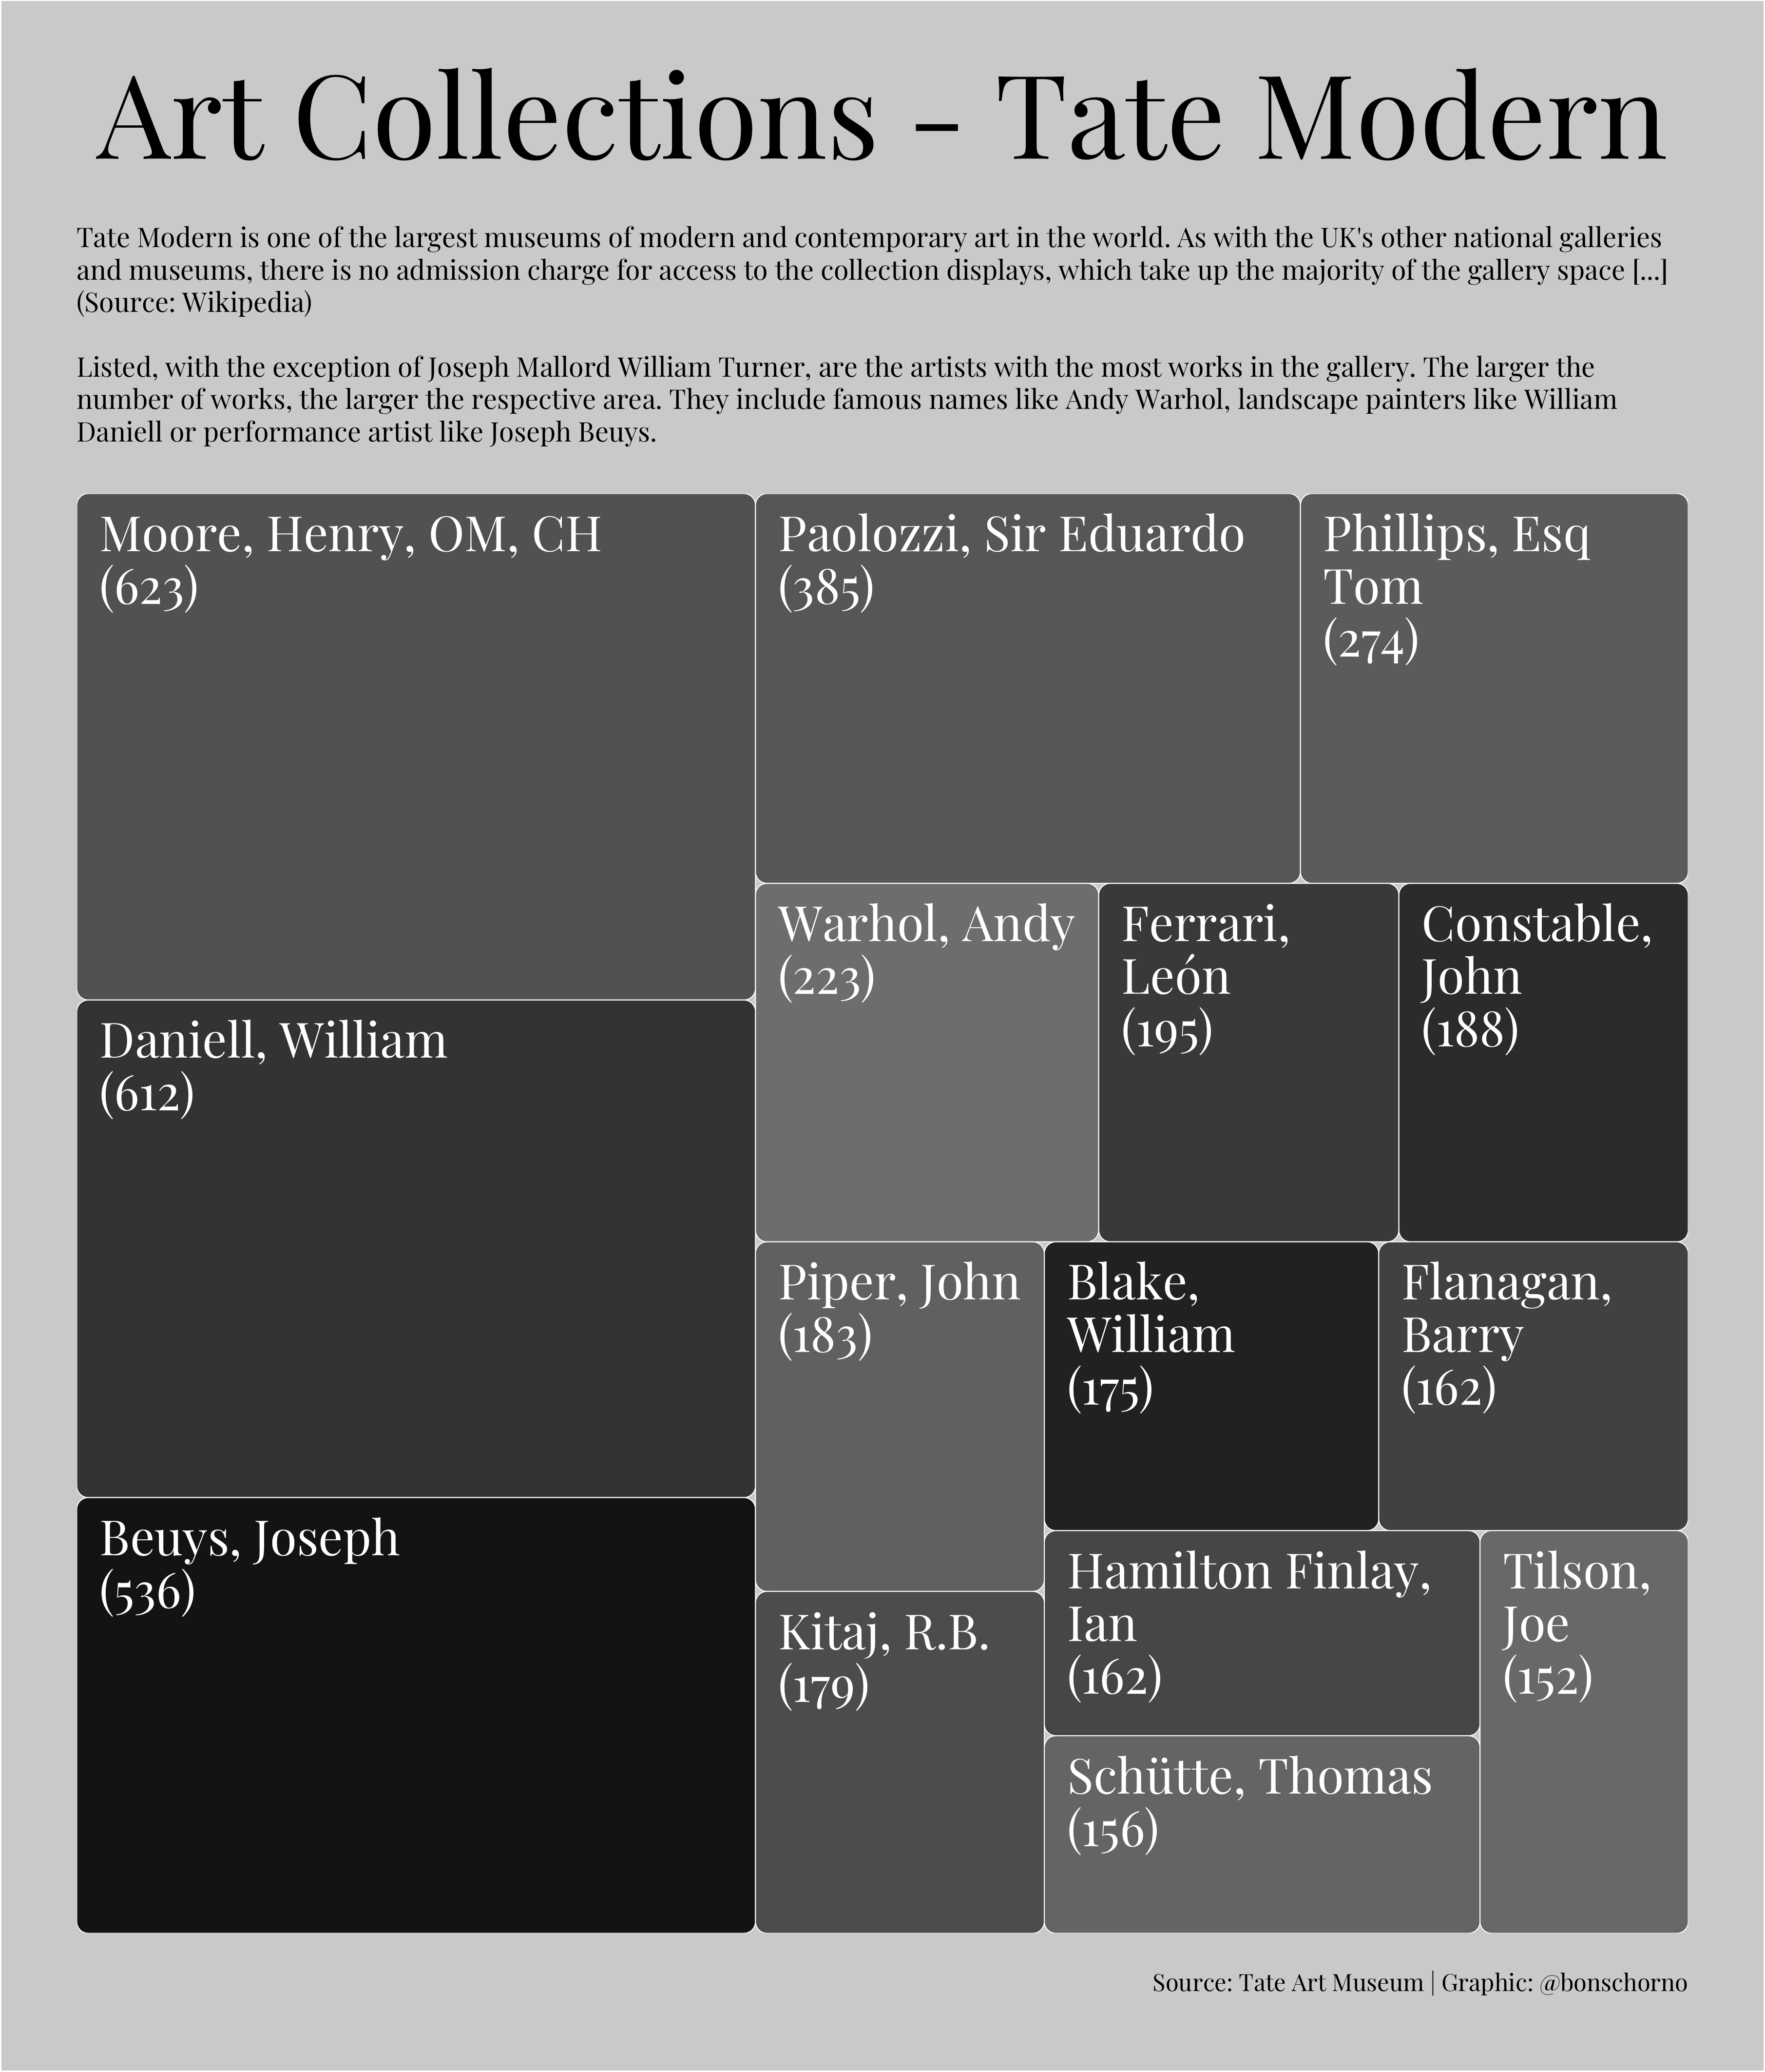
On this page you can find all my contributions to the #TidyTuesday challenge, a weekly social data project that focuses on understanding how to summarize and arrange data to make meaningful and/or beautiful charts with {ggplot2}, {tidyr}, {dplyr} and other tools that are part of the {tidyverse} ecosystem. The project was founded in 2018 by Thomas Mock and organized by the R4DS ("R for Data Science") online learning community. The intent is to provide a safe and supportive forum to practice their wrangling and data visualization skills. Not only for this description, but for the whole github set-up and many visualizations Cédric Scherer offered great inspiration. Other Twitter accounts from which my visualizations have greatly benefited and continue to do so, are Georgios Karamanis, Jake Kaupp, Corrie Bartelheimer, and Yobanny Sámano among many others.
-
Notifications
You must be signed in to change notification settings - Fork 0
bonschorno/TidyTuesday
Folders and files
| Name | Name | Last commit message | Last commit date | |
|---|---|---|---|---|
Repository files navigation
About
All my entries for #TidyTuesday
Resources
Stars
Watchers
Forks
Releases
No releases published
Packages 0
No packages published
