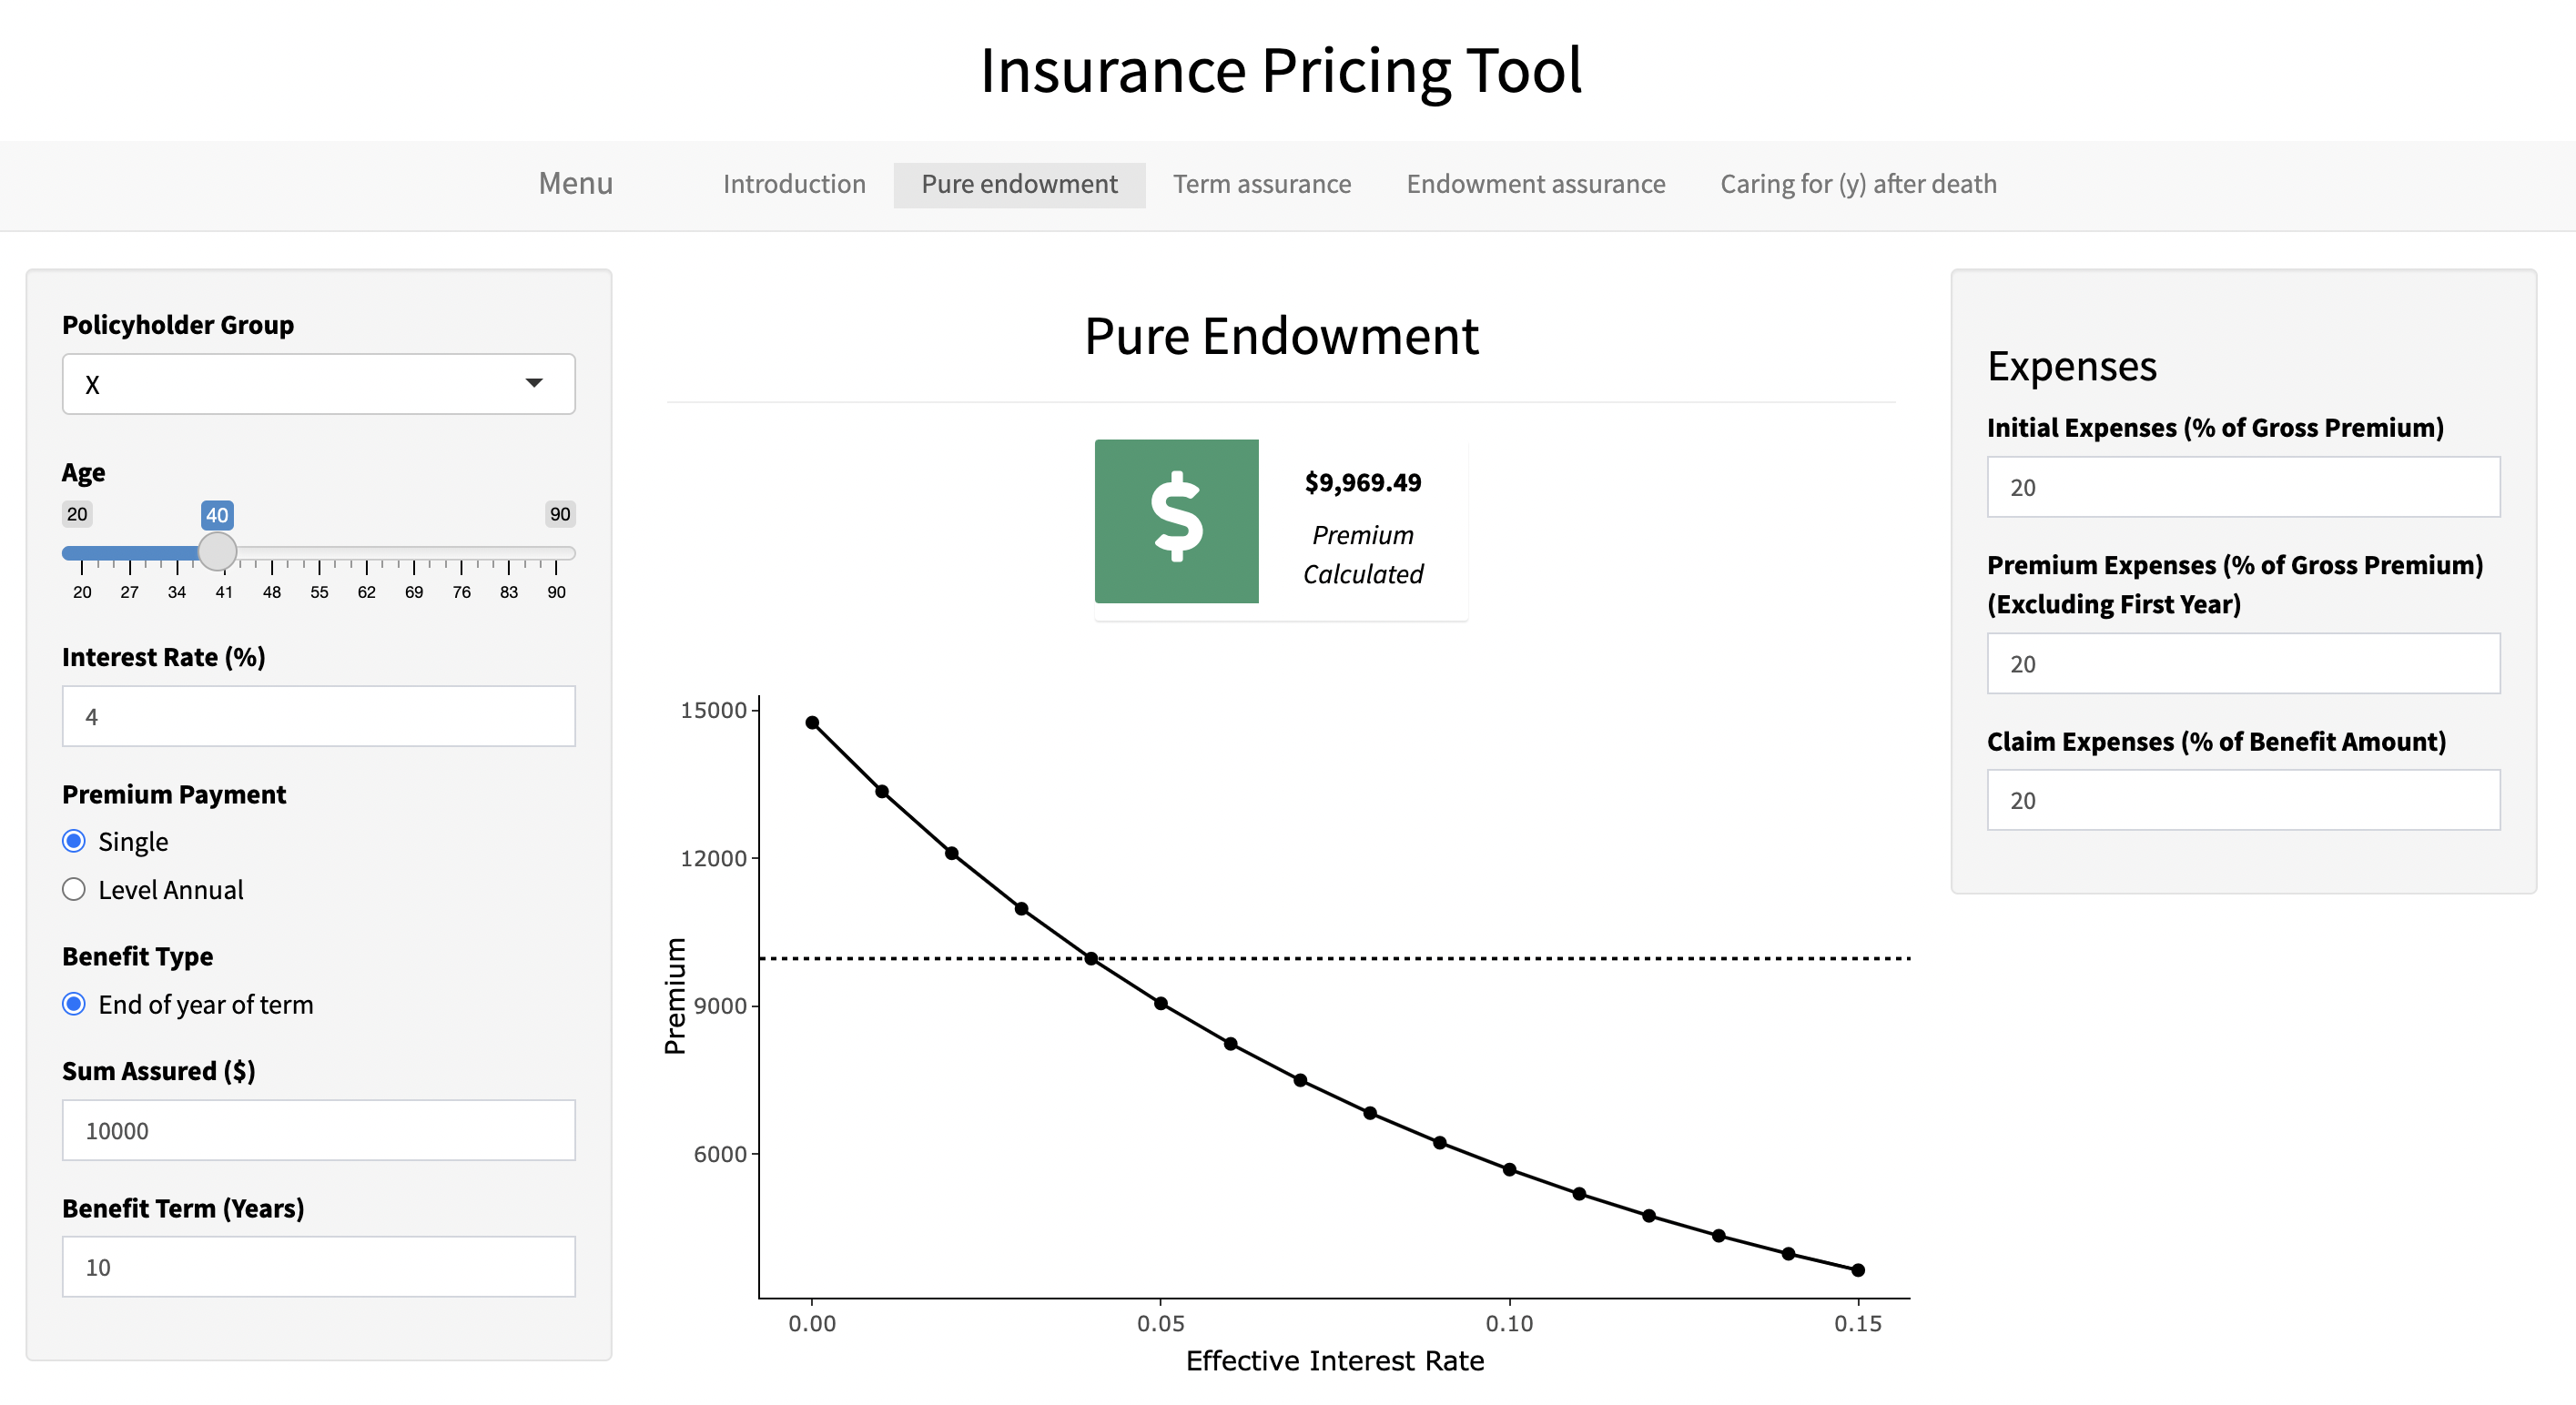
- General insurance, and in particular life insurance, has a number of factors that must be considered when pricing. One method that can be used to calculate premiums is the equivalence principle
- Utilising R Shiny, a number of actuarial equations and AM92 Mortality Tables, I aim to provide an interactive and user-friendly tool for insurance companies to calculate appropriate premiums for various life insurance contracts
- Forecasting is about predicting the future as accurately as possible based on past information that is available. In particular, I have explored ARIMA and ETS models in order to find the most optimal forecasting model based on the data used
- My aim was to predict retail turnover numbers as accurately as possible, providing a method that can be potentially useful for businesses within the particular sector that was analysed
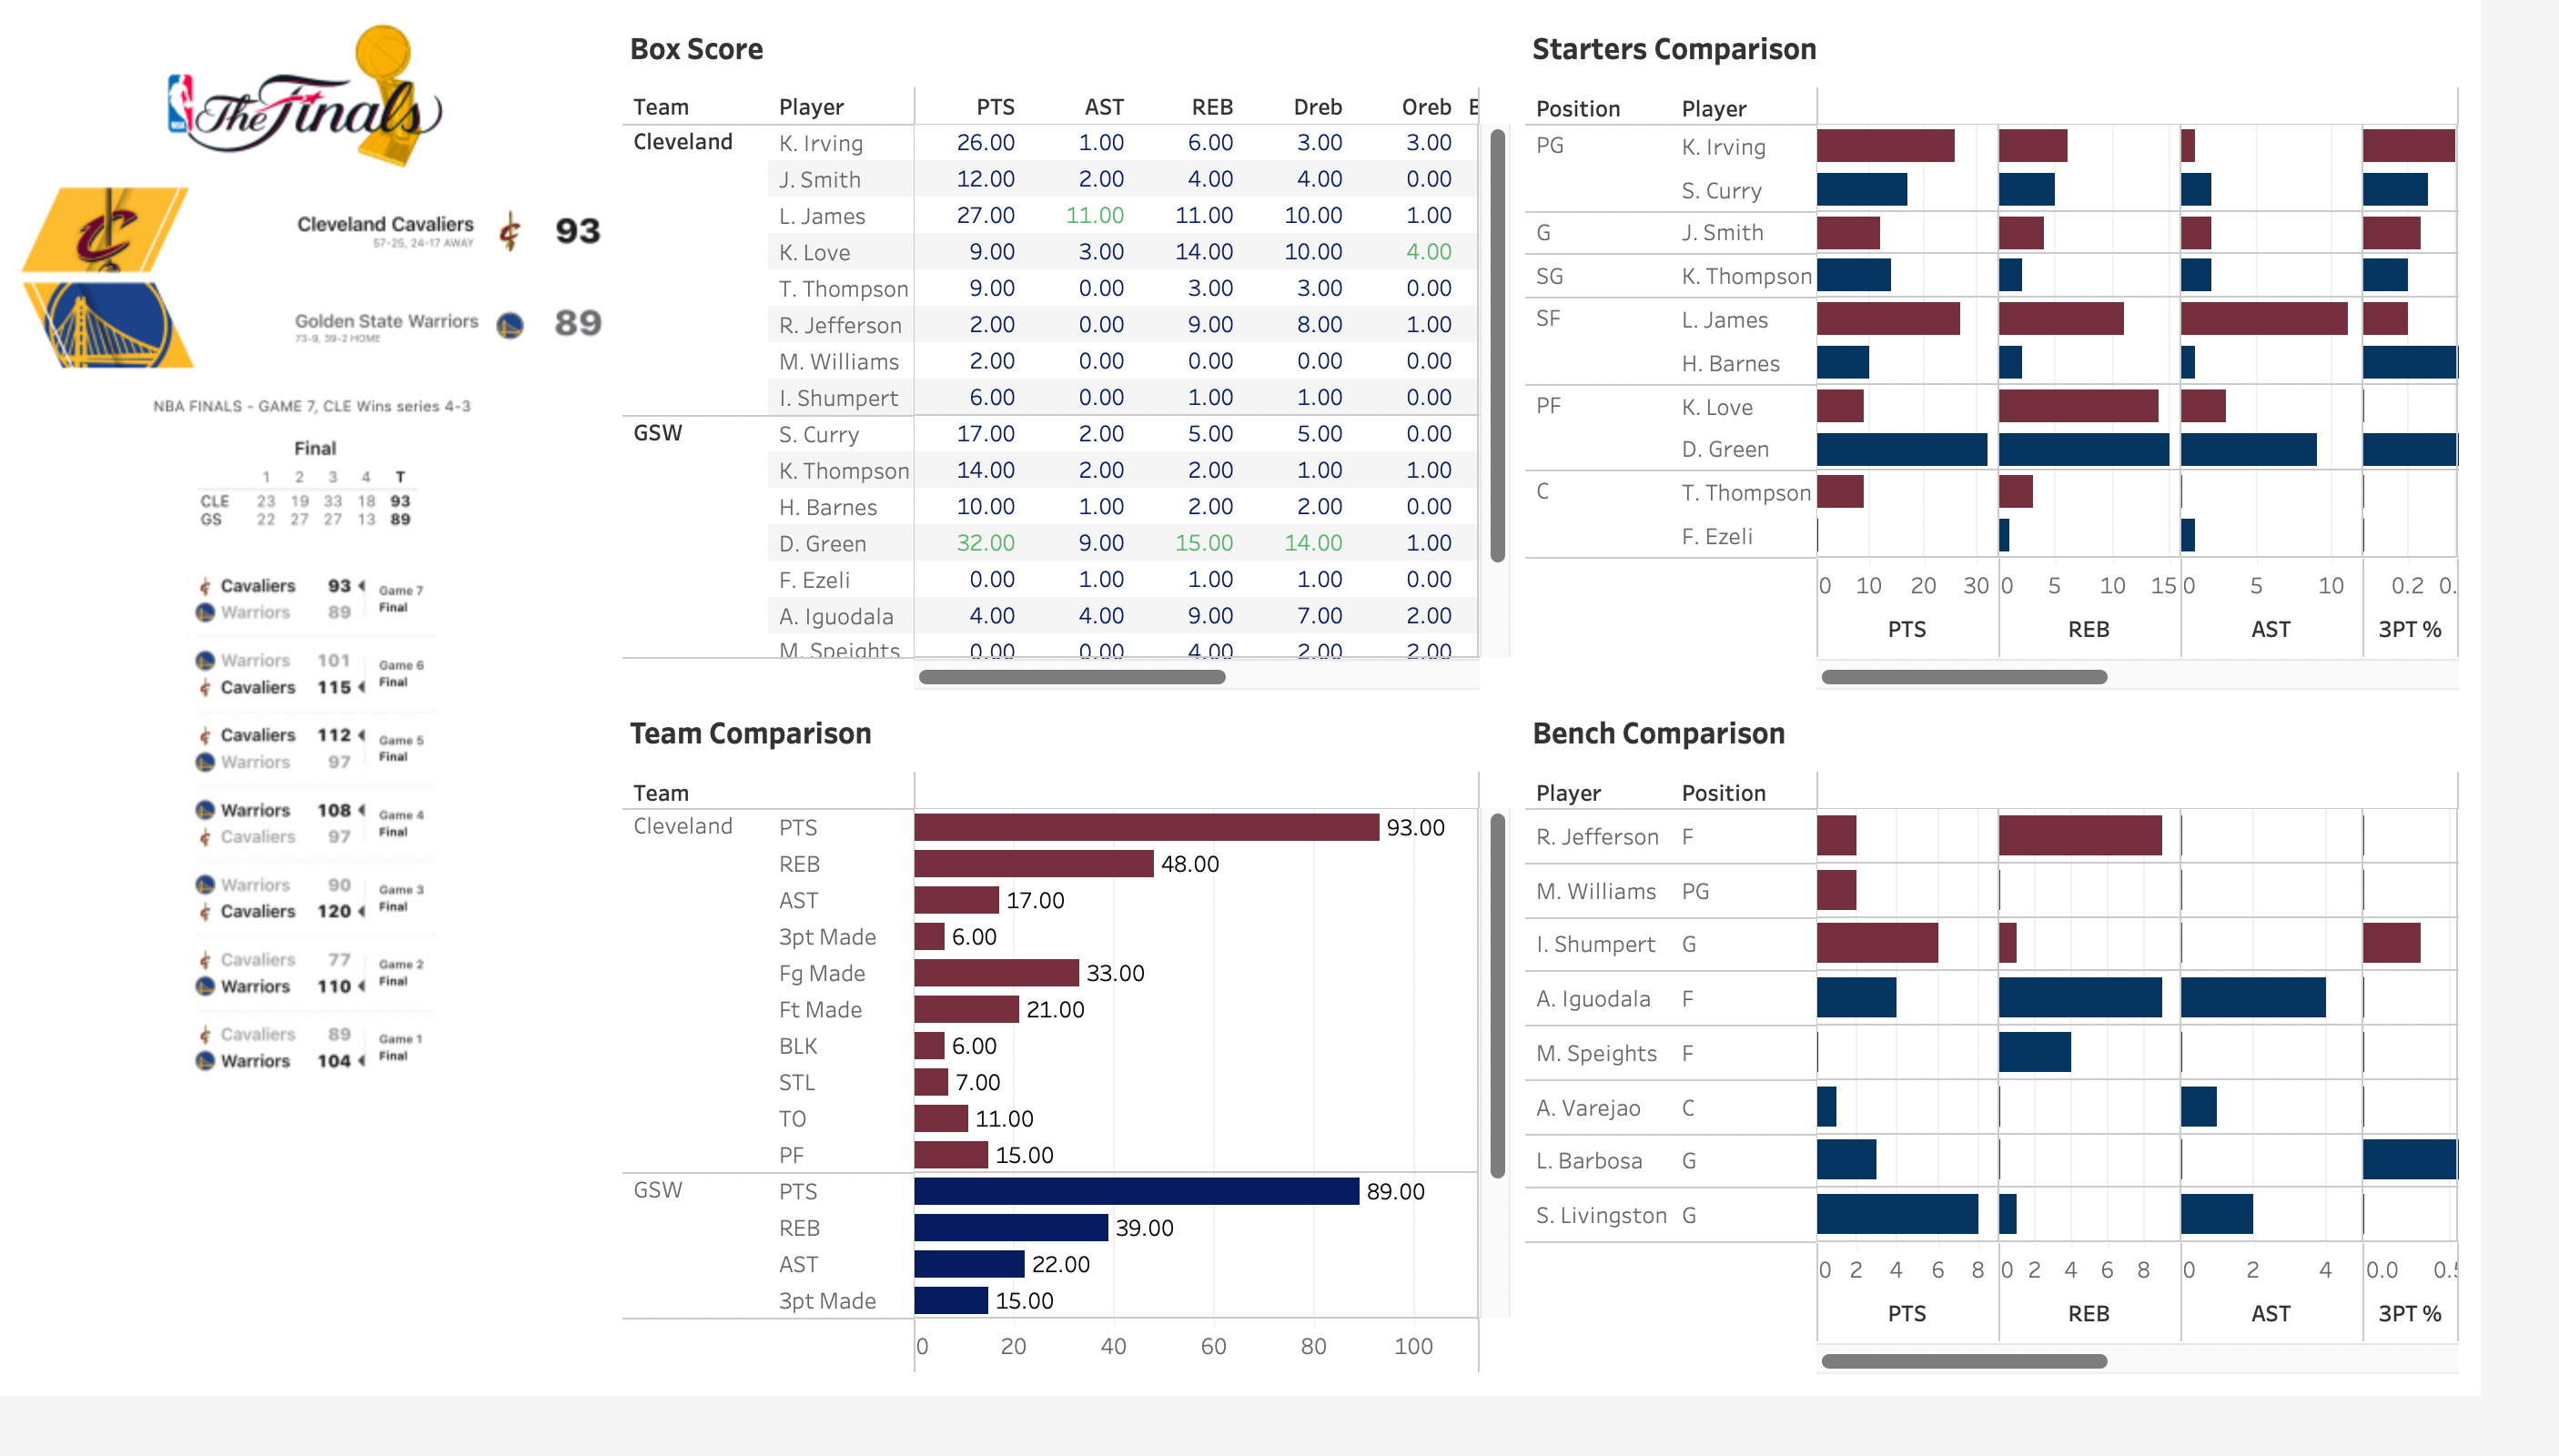
- Web scraping, a highly important tool in the world of data analytics was used to retrieve data from ESPN regarding this particular NBA game
- My aim was to build a dashboard which provides an insight into the individual and team performances in this game between the Cleveland Cavaliers and Golden State Warriors
- By analysing data from Inside Airbnb, I attempted to predict Airbnb prices in Melbourne through the use of the supervised learning technique K-Nearest Neighbours
- Hyperparameter Optimisation was also required to find the optimal value of k for our model
- My aim with this project was to see how well I could predict Airbnb prices in Melbourne, which could be useful for people looking to book holidays, seeking accommdation potentially through Airbnb
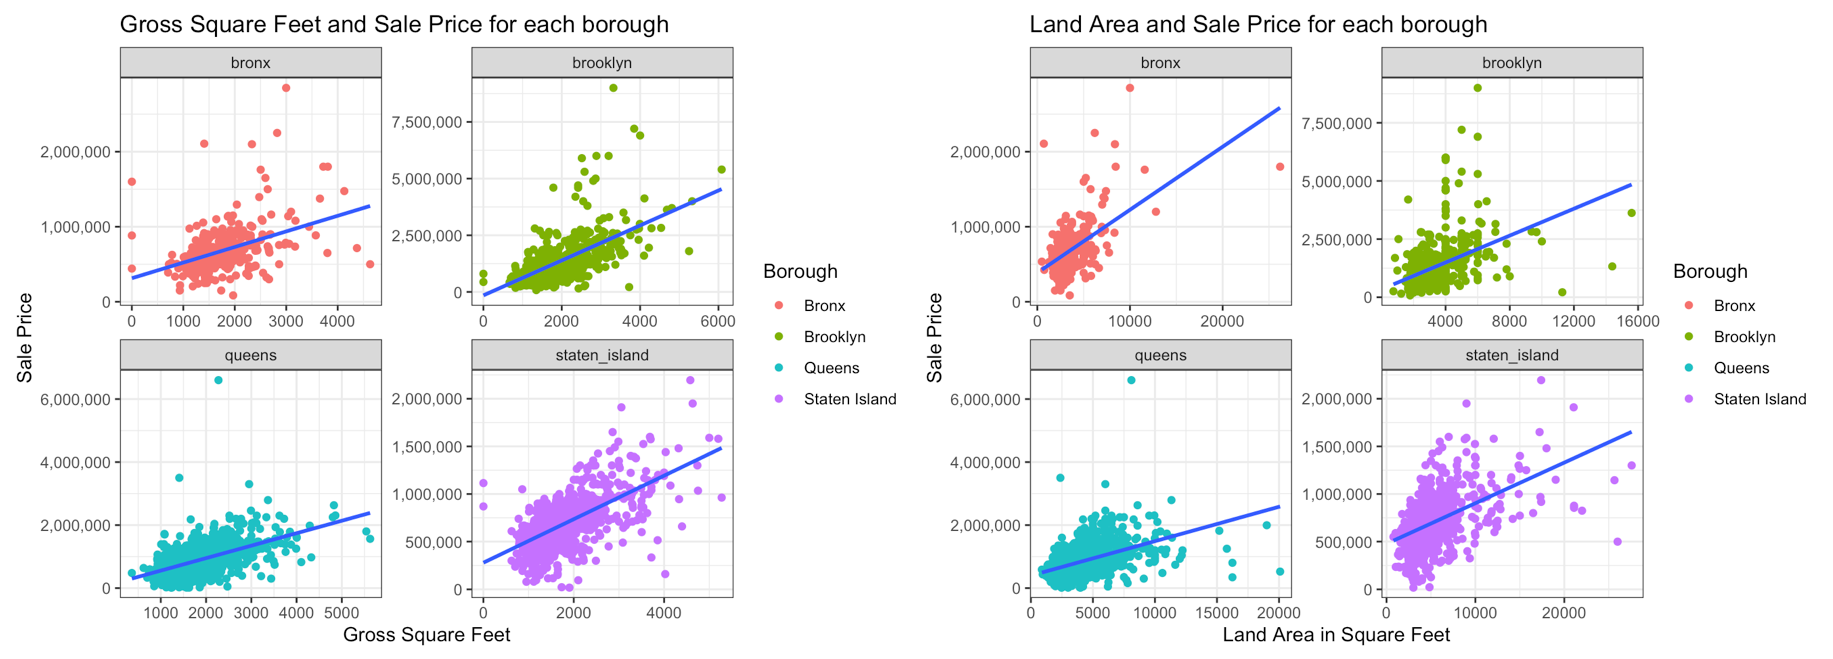
- Utilising data fron NYC Department of Finance, I was attempting to use the data to predict and explain house prices in New York City
- Through linear regression, I was able to create a model using meaningful variables in an attempt to predict and explain the sale price of houses
- K-Fold Cross Validation was used to help determine how skilled my model was
- My aim with this project was to see mainly how well the size of a house explain or predict sale price across New York City
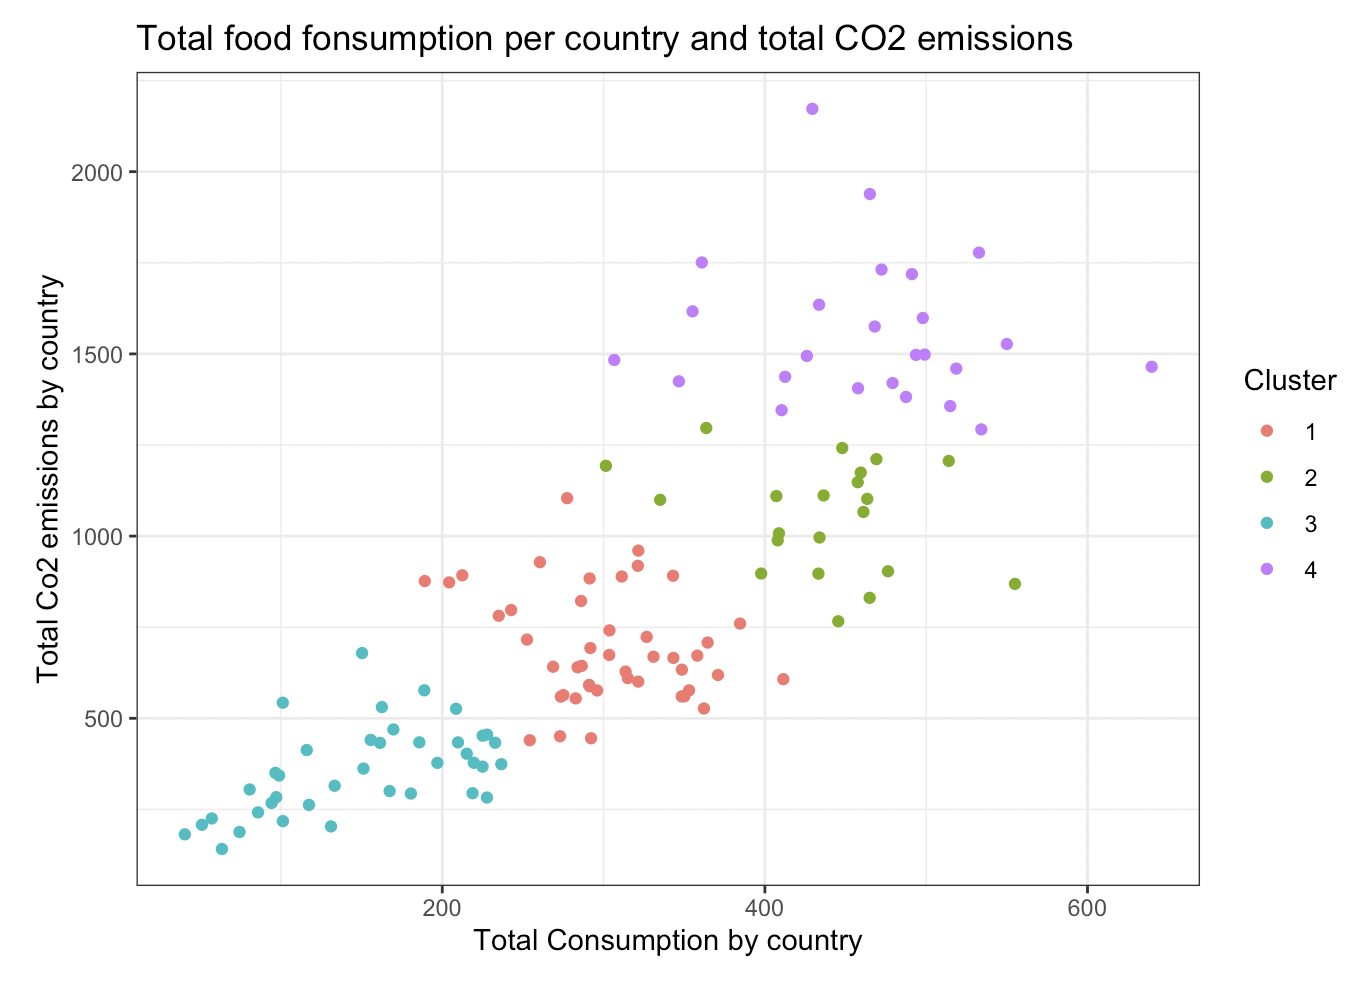
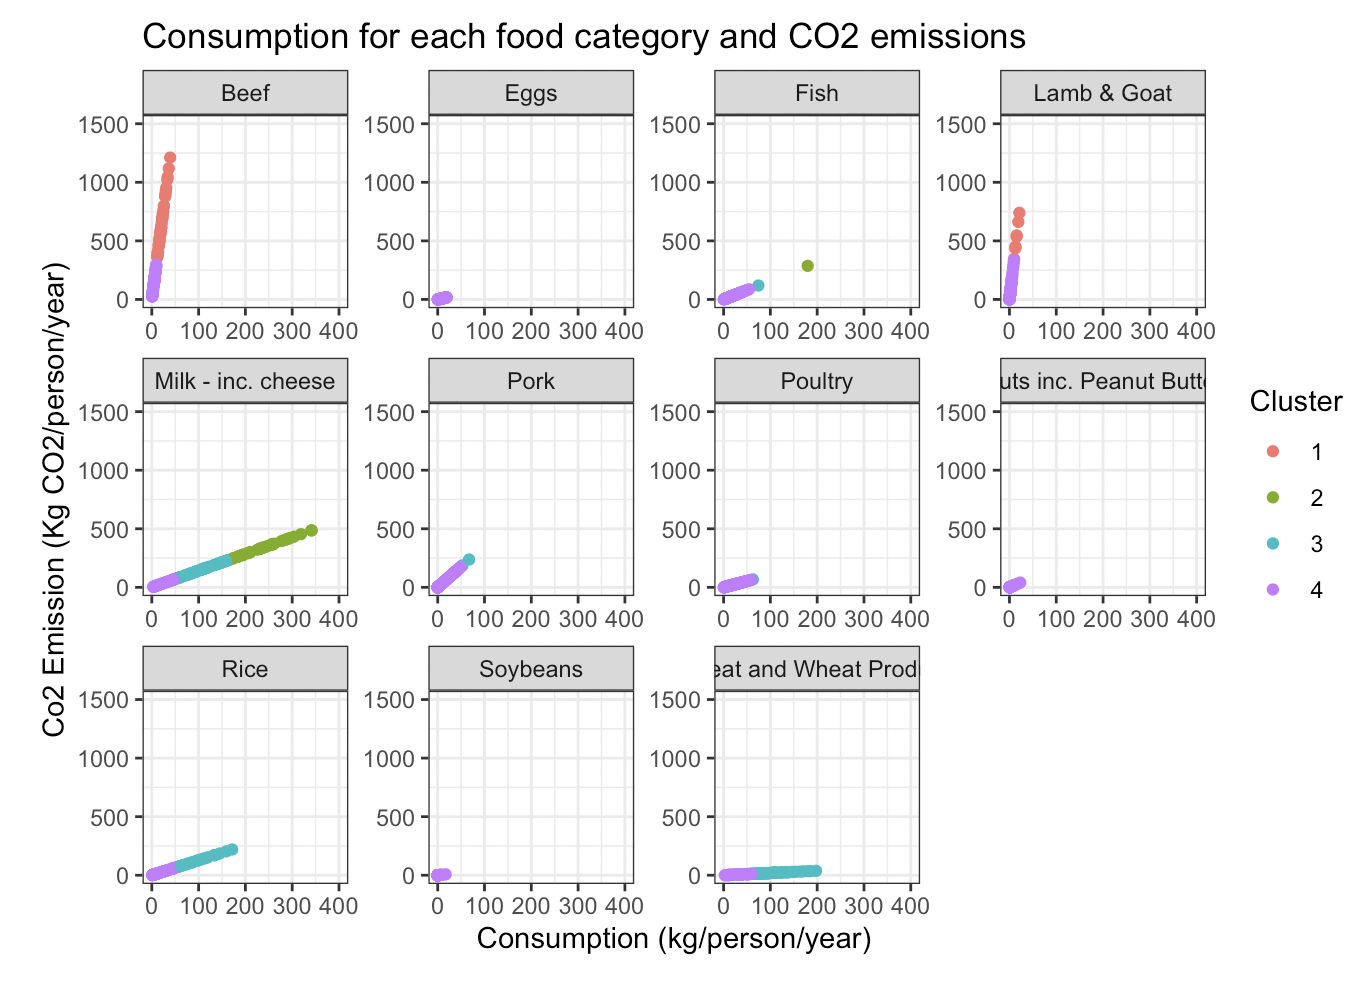
- Primarily through the use of K-Means Clustering, I explored how food consumption contributes to CO2 emissions
- Using the data, I was able to uncover groups of countries, as well as food categories that were responsible for a considerable amount of CO2 emissions
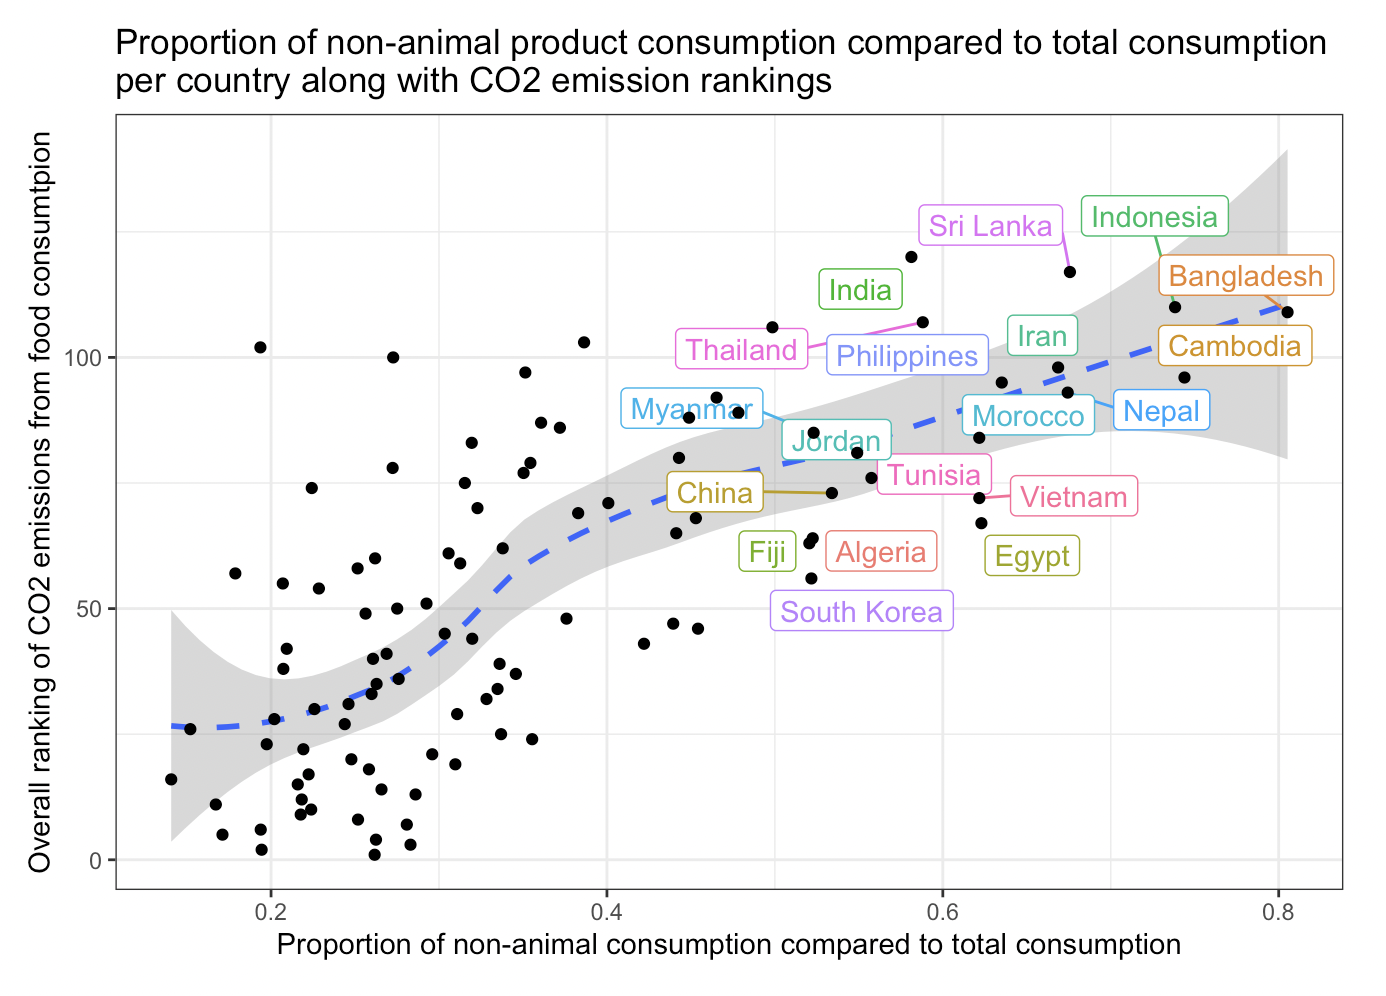
- I also undertook exploratory data analysis to see how non-animal product consumption relates to CO2 emissions relative to other countries
- My aim is to find these countries, and hope that this information can be useful for them to consider encouraging a shift in consumption tendencies of their citizens in aims of slowing down climate change
