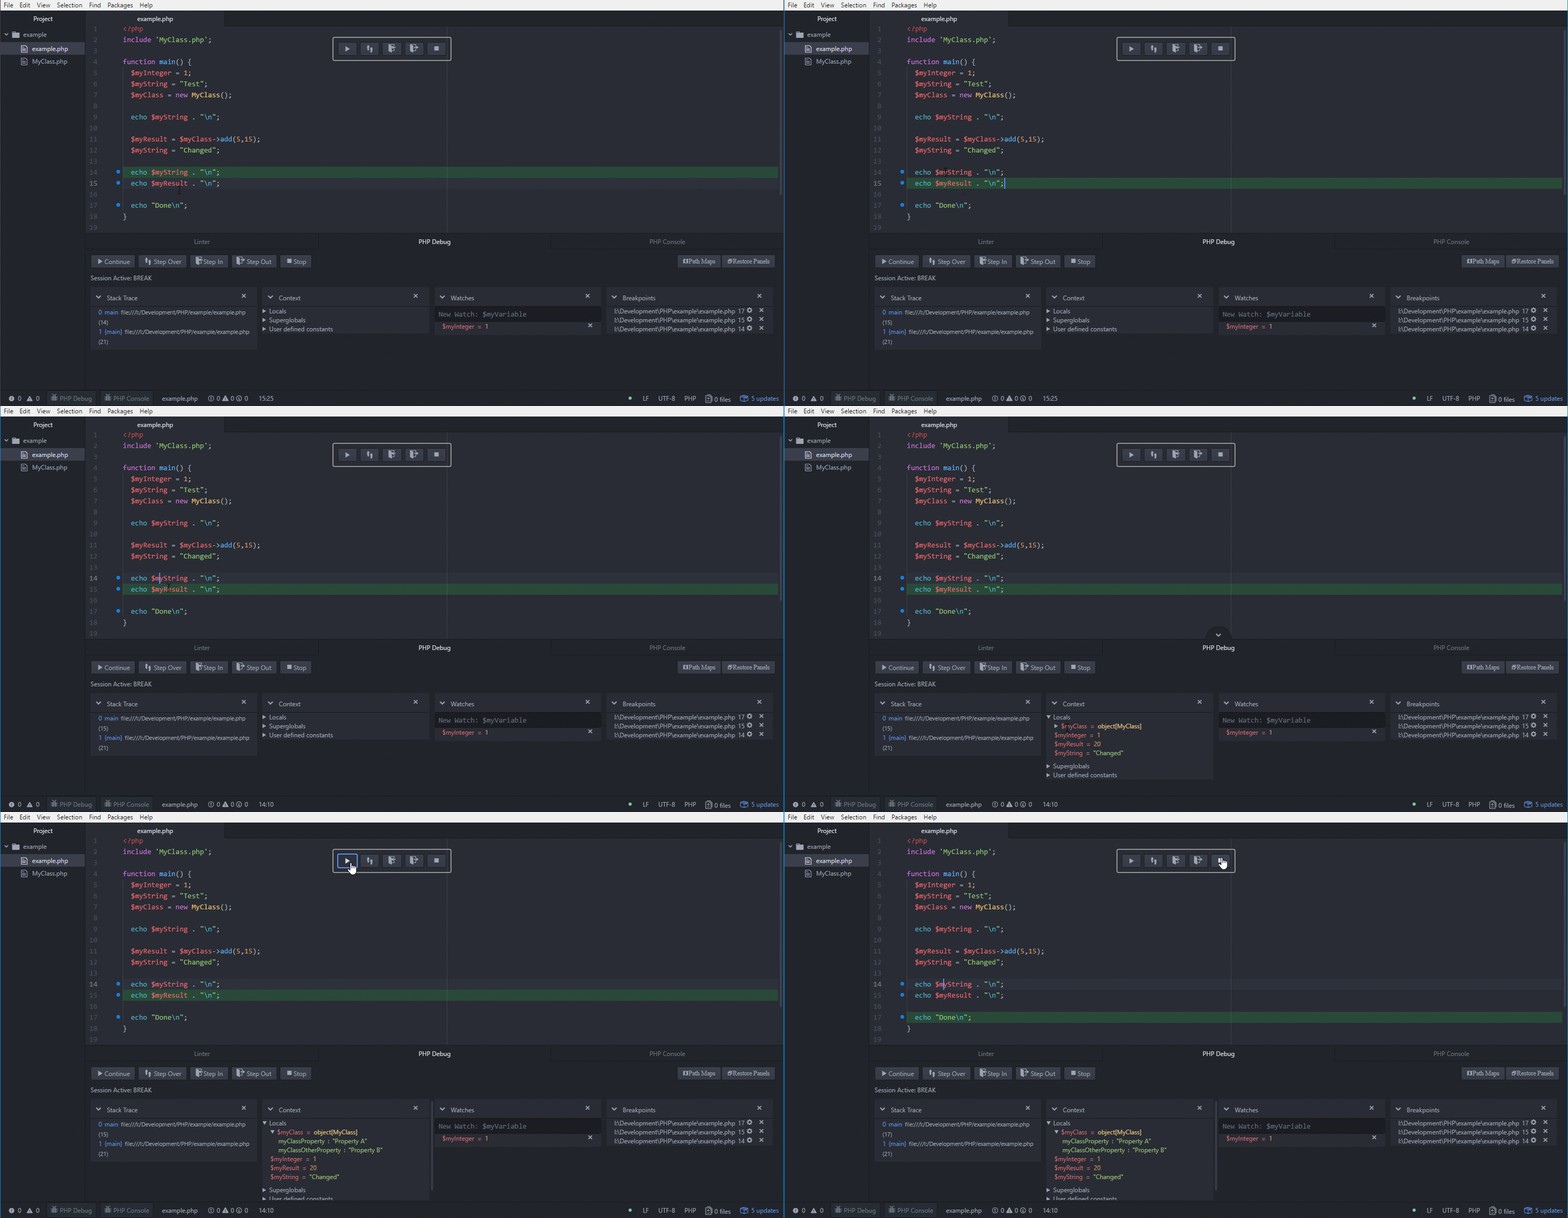
Provides a UI interface and basic functionality for building debugging inside Atom.
- Watchpoints
- Watches
- Breakpoints
- Floating Action Bar
- Standard Debugging Dock Panels
- Service Oriented Architecture
- Internal Logging functionality
- Console View
- Breakpoint Settings
- Customizable Action Bar
The best place to start will be by looking at existing projects like PHP-Debug and by reading the documentation under /docs
Enabled breakpoints to be displayed and toggled via the editor gutter
Display the breakpoint gutter to the left or right of the line numbers
Enable an overlay actionbar for debugging
Brings the Atom window to the foreground when a breakpoint is hit
Attempt to automatically close windows after a session ends. This may not apply for the default debugging window
