##Requirements
- PHP-enabled webserver
- SCSS compiler
##Setup
Clone this repository to your local machine and point your webserver root to src/httpdocs, the application should work out of the box, this repository contains some sample data that can be used for testing.
##Components
####Cards
Report statical information about selected entry (src/httpdocs/js/cards.js).
####Chart
Shows data change over time (src/httpdocs/js/chart.js).
####Treemap
Used as the main navigation component (src/httpdocs/js/treemap.js).
####Table
Alternative navigation technique to a treemap (src/httpdocs/js/tables.js).
####Component Interface Each component implements a common interface of 3 calls:
Initialize: called only once, prepares the component to show dataOpen: opens a data object and displays its contents using the specified componentUpdate: refreshes component data (useful when year changes and new values need to be plotted)
##Directory Structure
- /config: Compass configuration files
- /src/httpdocs: Application root directory
- css: compiled SCSS and libraries (bootstrap, introJs)
- data: CSV and JSON data files
- processing: temporary directory for data conversion
processCSV.py: converts CSV file to nested JSON structureupdate.php: Interface for data update
- processing: temporary directory for data conversion
- img: image assets
- includes: templates and HTML assets
imports.php: CSS and JS assets importsdatafiles.php: json datafiles loaded in each instance (AJAX can be used as an alternative)home.php: homescreen htmlnavbar.php: navigation bar htmltemplates.php: contains Mustache templates (eg. table row templates, cards...)
- js: Javascript assets
avb.js: helper functions and initialization routinescards.js: cards component routineschart.js: chart component routineshome.js: homescreen routines and introJs based tutorials codestatistics.js: functions used to generate statistical info and number formatting functionstable.js: table component routinestreemap.js: treemap component routines
- /src/scss: SCSS files
print.scss: SCSS applied when printing a Visual Budget pageglobal.scss: main SCSS file (imports all the partials defined below)- partials: SCSS assets
_avb.scss: section styles_base.scss: html, body styles, colors and font variables_cards.scss: styles for card component_chart.scss: styles for chart component_home.scss: styles for homescreen_navbar.scss: styles for top navigation bar_table.scss: styles for tabular view_treemap.scss: styles for treemap component
####Required Libraries
- Bootstrap (grid layout, dropdowns..)
- D3 (visualizations)
- Jquery Cookie
- DetectMobileBrowser
- Jquery
- Mustache (templates)
- IntroJS (required for tutorials)
##Sample Datasets
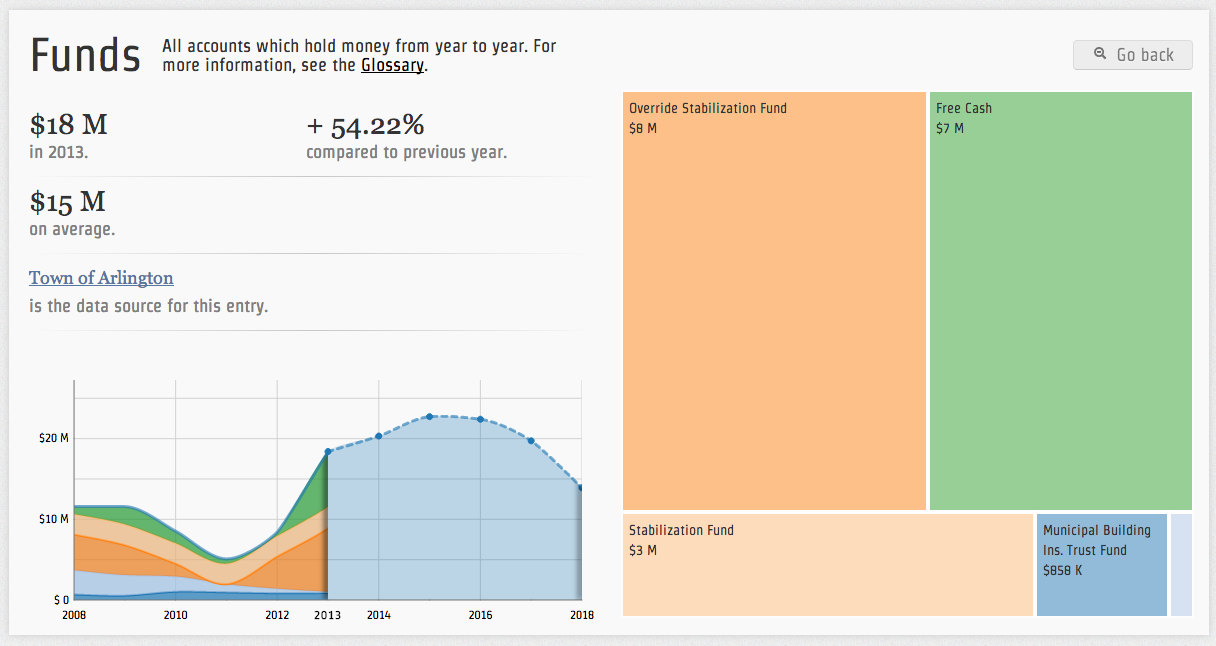
Sample Expenses.json, Revenues.json and Funds.json from Arlington, MA in src/httpdocs/data.
Budget data is kept in JSON and CSV format. The JSON format is actively used for computation while the CSV format is kept for reference and data download.
####Data structure
The base data unit is an object with the following fields:
key{string}: entry namesrc{url string}: link to data source from where entry data was extracted (optional)hash{string}: entry id (can be arbitrary)sub{array of other entries}: subsections that make up current entrydescr{string} : entry description (optional)values{array of value objects} : entry values over time
A simple value object is defined by:
year: year of valueval: value
This data structure could be changed should it be considered not ideal for future uses.
####Data structure sample
The data sample below is partial section of src/httpdocs/data/funds.json.
{
   "key":"Funds",
   "src":"http://www.arlingtonma.gov/",
   "hash":"d42b2bb7",
   "sub":[
      {
         "key":"Tip Fee Stabilization Fund",
         "src":"www.arlin",
         "hash":"68a317f0",
         "sub":[],
         "descr":"The Town of Arlington participated in a regional solid waste consortium, and upon leaving the consortium in September 2005, the Town was entitled to revenue derived from the regional agreement.",
         "url":"",
         "values":[
            {
               "val":1885012.0,
               "year":2010
            },
            {
               "val":1010675.0,
               "year":2011
            },
            {
               "val":562906.0,
               "year":2012
            },
            {
               "val":164000.0,
               "year":2013
            }
         ]
      },
      {
         "key":"Override Stabilization Fund",
         "src":"",
         "hash":"cc5b3ad1",
         "sub":[],
         "descr":"This Fund was created as a result of the 2005 Proposition 2 1/2 override. The Town makes annual appropriations to the fund until the time in which it is necessary to make withdrawals for the purposes of balancing the general fund budget.",
         "url":"",
         "values":[
            {
               "val":1584330.0,
               "year":2010
            },
            {
               "val":0.0,
               "year":2011
            },
            {
               "val":3986819.0,
               "year":2012
            },
            {
               "val":7886125.0,
               "year":2013
            }
         ]
      },
      {
         "key":"Stabilization Fund",
         "src":"",
         "hash":"22772b4f",
         "sub":[],
         "descr":"In accordance with M.G.L. Ch. 40 S. 5B, the Town may appropriate in any year an amount not exceeding, in the aggregate, 10% of the amount raised in the preceding fiscal year's tax levy.",
         "url":"",
         "values":[
            {
               "val":2541858.0,
               "year":2010
            },
            {
               "val":2551951.0,
               "year":2011
            },
            {
               "val":2558551.0,
               "year":2012
            },
            {
               "val":2667328.0,
               "year":2013
            }
         ]
      }
   ],
   "descr":"All accounts which hold money from year to year. For more information, see the Glossary.",
   "url":"",
   "values":[
      {
         "val":8538240.0,
         "year":2010
      },
      {
         "val":5089098.0,
         "year":2011
      },
      {
         "val":8423147.0,
         "year":2012
      },
      {
         "val":18398926.0,
         "year":2013
      }
   ]
}
####Data pipeline Town representatives are likely to be proficient in editing spreadsheets. The Visual Budget application currently uses a pipeline that converts CSV files (created with Microsoft Excel) to nested JSON files used for computation.
A python script src/httpdocs/data/processing/processCSV.py converts a flat CSV file into the nested JSON structure listed above. A php script src/httpdocs/data/processing/update.php orchestrates the entire data update procedure.
For more information about CSV data formats or update procedures check docs/data.
- Decoupling town related assets (budget sections, links, logos, data..) from core visualization techniques
- Changing data sections (eg. Replace 'revenues' with 'Town Departments') requires to manually change links (
navbar.php), homepage data (home.php), initialization javascripts (avb.js) and update routines (processCSV.py,update.php). This process should be simplified to allow a simpler migration between different types of data. - Grid space. As of now, although each viz component implements a common interface, each visualization is tied to specific div (or html section), the creation of a 'grid' space that allows any visualization to be 'attached' to any area of the screen and would greatly enhance the customization and upgradability of the application.
##Core Contributors
####Involution Studios (Design and Coding)
- Lead Developer: Ivan David DiLernia
- Creative Director: Juhan Sonin
- Lead Designer: Roger Zhu
####Town of Arlington (Data Collection and Testing)
- Mike Bouton
- Andrew Flanagan
- Alan Jones
- Annie LaCourt
##License
Visual Town Budget is licensed under the Apache-2.0 open source license. You can find more information on the Apache-2.0 license at http://www.apache.org/licenses/LICENSE-2.0


