Designing Reports
One aspect of singleCellTK is the generation of comprehensive reports that input data with corresponding parameters and generate a PDF/HTML report that contains the description of overall process, methods or algorithms used, results computed, various related plots along with a brief summary, all integrated together in a single easy to read document.

- Descriptive form makes it easier for the users to understand the analysis (data, steps & results)
- You don’t have to run each step separately (as with GUI or Console)
- Everything including data description, input params, code for the analysis, description of the analysis, results (tables & figures), summary of the results, is integrated in a single document
- Easier if you want to share your results or the analysis
- Just needs input data and params
Load up the data into a SCE object, define parameters such as the assay to use and and the groups for differential expression. The report compiles the results of the differential expression including a table that shows the top differentially expressed features and various plots to visualize these features.
Differential Expression report can be found here: https://github.com/compbiomed/singleCellTK/tree/master/inst/rmarkdown/de
Typically, you load up data into a SCE object and use the ‘runSeuratReport’ function to run the workflow and generate a report. This runs all steps in the Seurat workflow controlled by the parameters to the ‘runSeuratReport’ function.
The output document generated contains description of the input data followed by all steps of the Seurat workflow that contain the description of the workflow step, the code for this part of the analysis, resulting plots or tables, and additionally a small summary for this part of the analysis that can be copy pasted to papers or presentations.
The markup of the report is defined in such a modular and flexible manner that if a user desires to re-run the analysis (and re-generate the report document) by changing parameters to a specific part of the workflow, the report will re-compute only that specific part and the parts that depend on it, essentially saving computational resources and time.
Overall structure of a report:
- Header Section: Title, authors, report output params, analysis params
- Content: Analysis description, code, plots, tables.
- Summary: Paragraph that describes the analysis run and the results computed.
- SessionInfo
Seurat Report can be found here: https://github.com/compbiomed/singleCellTK/tree/master/inst/rmarkdown/seurat

a. If a short individual report (e.g. differentialExpression or a single algorithm from QC):
- Create rmarkdown file in /rmakdown folder (confirm dir)
- Insert/update the header section (add required analysis parameters and control parameters)
- Add content including library calls, description/introduction, analysis code, summary, sessionInfo
- Create an R function “reportAlgorithmName” that calls this rmarkdown and stores the output file.
b. If a large report that calls a number of distinct functions possibly a workflow (e.g. complete Seurat workflow or a collection of algorithms from QC such as cellQC):
- Divide the workflow into individual steps where each individual step as a separate report (refer to a)
- Create an rmarkdown for file for the workflow
- Insert/update the header section
- Add introduction, summary, sessionInfo.
- Compile individual reports using knit_child function and store in variables.
- Call variables to display content usint cat() where appropriate.
- Create R function “reportWorkflowName” that calls this overall workflow rmarkdown and stores the output file.
Add report markdown files in the following directory:
singleCellTK/inst/rmarkdown/yourAlgorithm/yourAlgorithmReport.rmd
An R function that can be called with input data and params from the R environment to generate a report. Typically, this function checks for validity of the input object and params (or sets default values), checks for the output path, calls the rmarkdown to render the report and finally saves both the output object (includes all computed data) and the report document to the defined directory.

- Create an R function "reportAlgoName" and add parameters including the input SingleCellExperiment object (inSCE), technical parameters (such as which assay to use, choice of dimensionality reduction components, clustering resolution, variable features etc.), control parameters (such as choice of description, if a plot should be displayed, what level of heading to use etc.) and the output path of the rendered document.
- In the function, first test if the input SCE object is valid and return an error if it is not.
- Check if the values against the technical parameters are valid, i.e. if the values specified actually exist in the input SCE object. Return error or use a default value with warning if a parameter is not valid.
- Check if the output path specified by the user is valid and exists, otherwise use a default path (possibly the current working directory) and return a warning.
- Render the rmarkdown file for this algorithm/workflow by using the render rmarkdown::render function and specify the output path to store the rendered file.
- Save the SCE object (which now contains the computations from the report) in the output path for later use.
- Return the SCE object from this function, so this object can be used from the same R environment where this function was called from.
Function call for the rmarkdown should be created in the R file below:
singleCellTK/R/htmlReports.R
A modular structure helps with re-usability and is generally less error-prone. If you want to create a report for a larger workflow, it is better suited that you create a modularized structure where the highest level (workflow) calls other individual reports for different sections/processes of the workflow.
For example, in the figure below, "xyzReport" is a larger workflow report that calls "fmReport" (a report that curates marker selection algorithms along with required visualizations) multiple times with different parameters. This report gets rendered and populates the section in the larger report where it is called using the "knit_child" function. Similarly, the "fmReport" calls a very general "visualizationReport" that creates and renders various plots depending on the input parameters. This hierarchal structure makes it easier for you as developer to maintain and fix bugs in the long run.

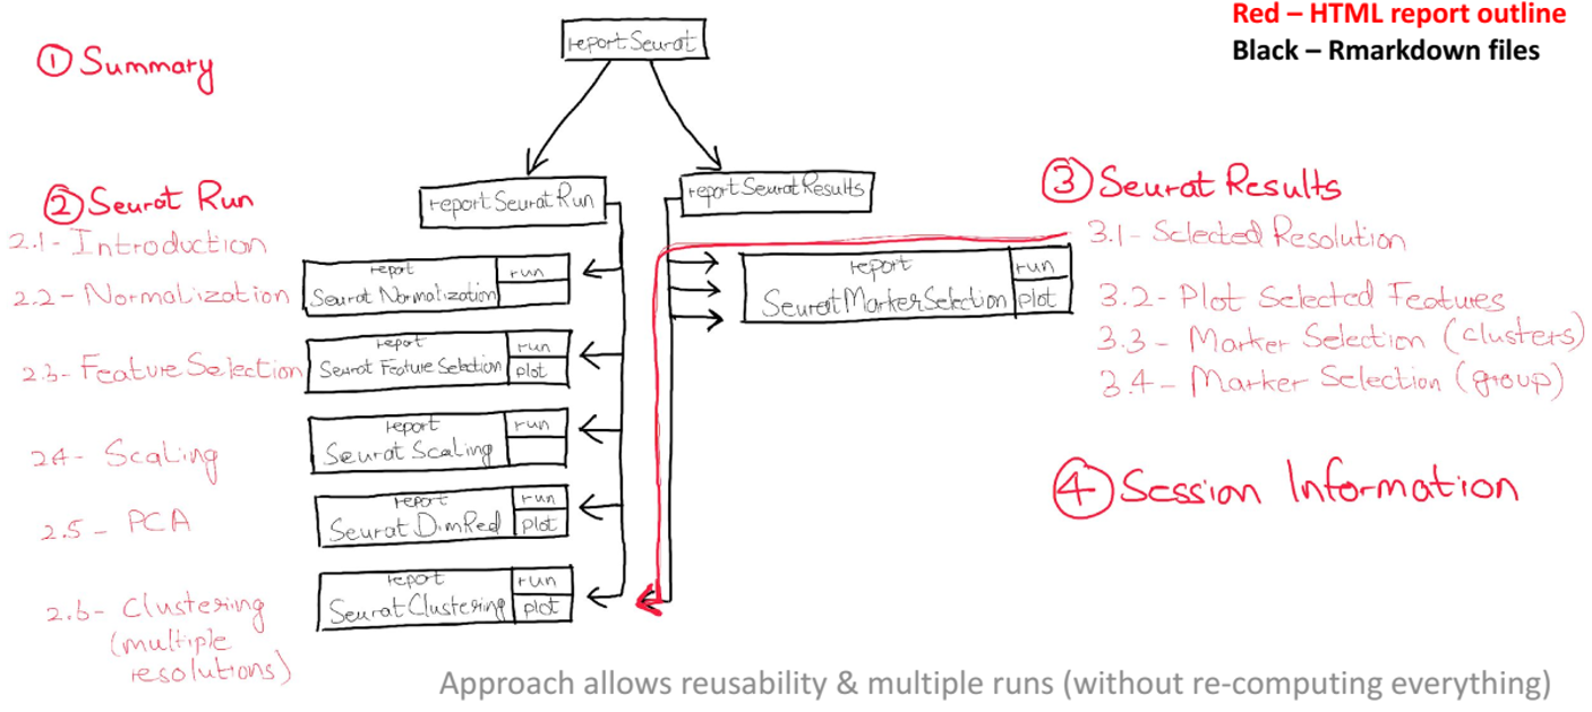
The figure below highlights the modular structure of a currently existing report (add link here) for the Seurat workflow. The Seurat workflow is quite detailed, therefore, it is a good idea to divide it into individual modular reports that can collectively make up the whole Seurat workflow. The red highlighted text shows the contents of the output rendered document, while the black boxes indicate the individual rmd files that make up the report. Initially, a separate report is created for each individual task, e.g. Feature Selection, Dimensionality Reduction etc., which are then called in higher level rmd files i.e. Seurat Run or Seurat Results (based on the intended target of the report), which are finally called in the highest level of report i.e. the SeuratReport.
Control variables differ from other parameters in the sense that they do not affect the analysis, but only on the output document. These control variables control different levels of headings, to show or hide description and plots in a particular report, or if the computation from an analysis should be re-run or skipped when the document is re-rendered.
Below we define and describe a few of the use-cases of control variables:
1. Control if a snippet/section of code should be evaluated in the report Imagine if there is a section of code in your individual report that you might need to run in a specific instance but not all times. In such cases, it is better to use a control variable that can turn this on or off with some default value.
2. Control if a particular plot should be visualized in the report You may have multiple plots in a single report and might want to turn one or the other on or off.
3. Control the level of heading to use in a report When you render a report individually, the headings start from level 1 (#) and onwards (## and ## etc.). However, if you call this individual report in a larger report, it might be a good idea to keep a variable that adjusts these heading levels in the individual report, i.e. # (first level) to ## (second level) and onwards, to make sure that the final output document has correct heading levels rendered. Incorrectly doing so may result in a cluttered final document.
4. Control the text of titles and descriptions in the report Sometimes you may want to have dynamic titles and in such cases, you might want to use variables that can store the titles or the descriptions when particular reports are called instead of having permanent text.
5. Control if a description should be shown or hidden in the report In specific cases, just plots or the tables from the report may be required from individual reports. In this case, it is better to have a control variable that can turn off the description from the individual report.
7. Control report specific plotting options It is helpful to have variables that control various plotting options such as defining number of rows and columns for multiple plots, text to describe the plots and other such options which cannot be directly passed onto the plotting functions and are only concerned with how plots display in reports.