Expense Tracker is a mobile-first financial management application designed to help users easily track their daily and monthly expenses. The application emphasizes a user-friendly UI/UX tailored specifically for smartphones, allowing seamless personal finance management on the go.
This application leverages Angular as the frontend framework and Tailwind CSS for responsive and modern UI styling. All user data is stored in LocalStorage, making the app lightweight and independent of backend dependencies.
| Technology | Purpose |
|---|---|
| Angular | Frontend application logic |
| Tailwind CSS | Styling and responsive UI |
| LocalStorage | Persistent data storage |
-
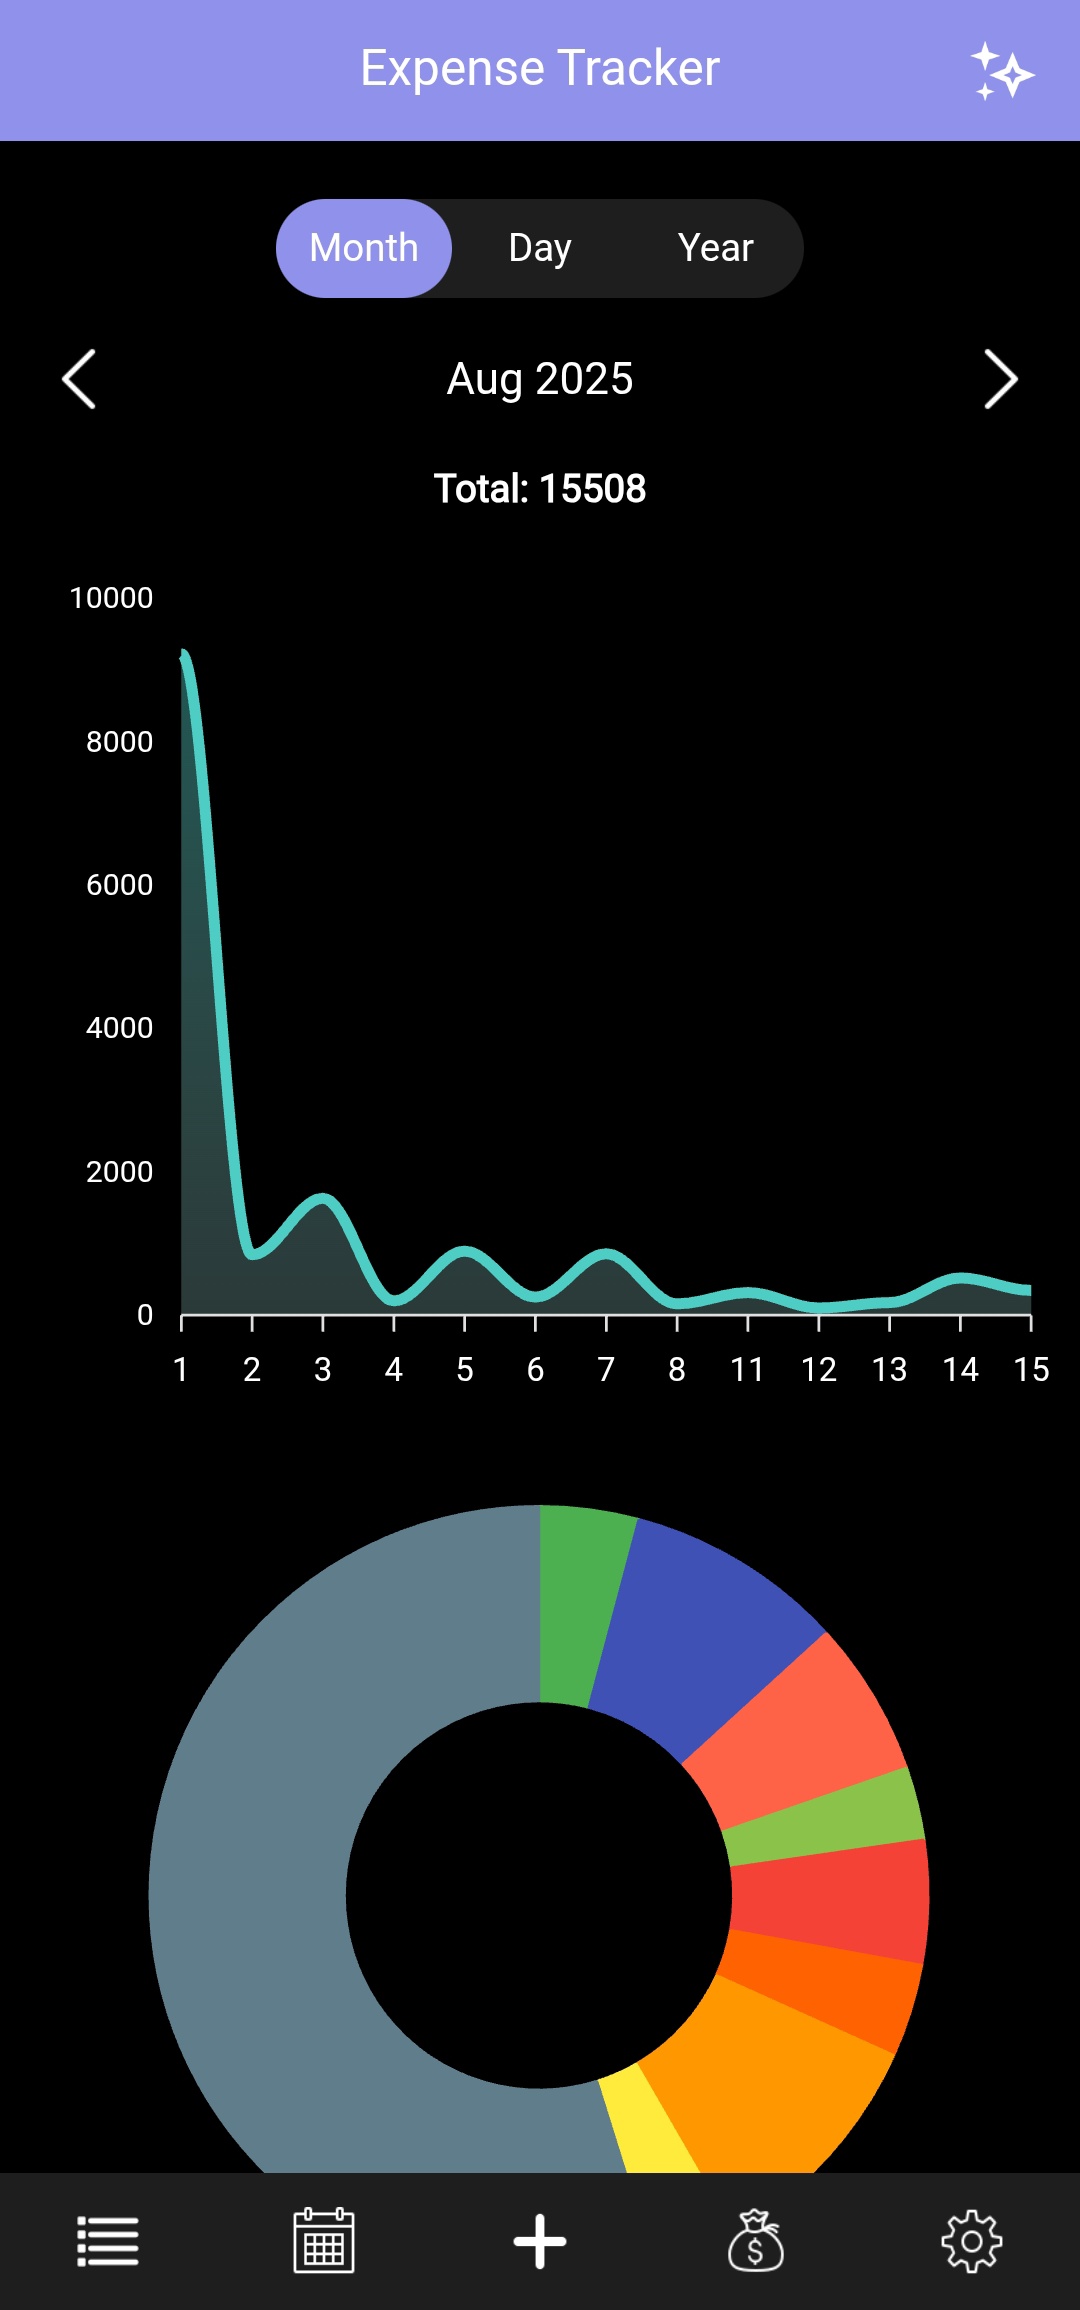
Upon launch, users are greeted with two interactive graphs:
- Expense Graph (Toggle: Monthly / Daily / Yearly): Displays a line graph representing user expenses over time. Users can switch between Monthly, Daily and Yearly views.
- Category-wise Pie Chart: Visualizes how the expenses are distributed across different categories (e.g., Food, Travel, Shopping).
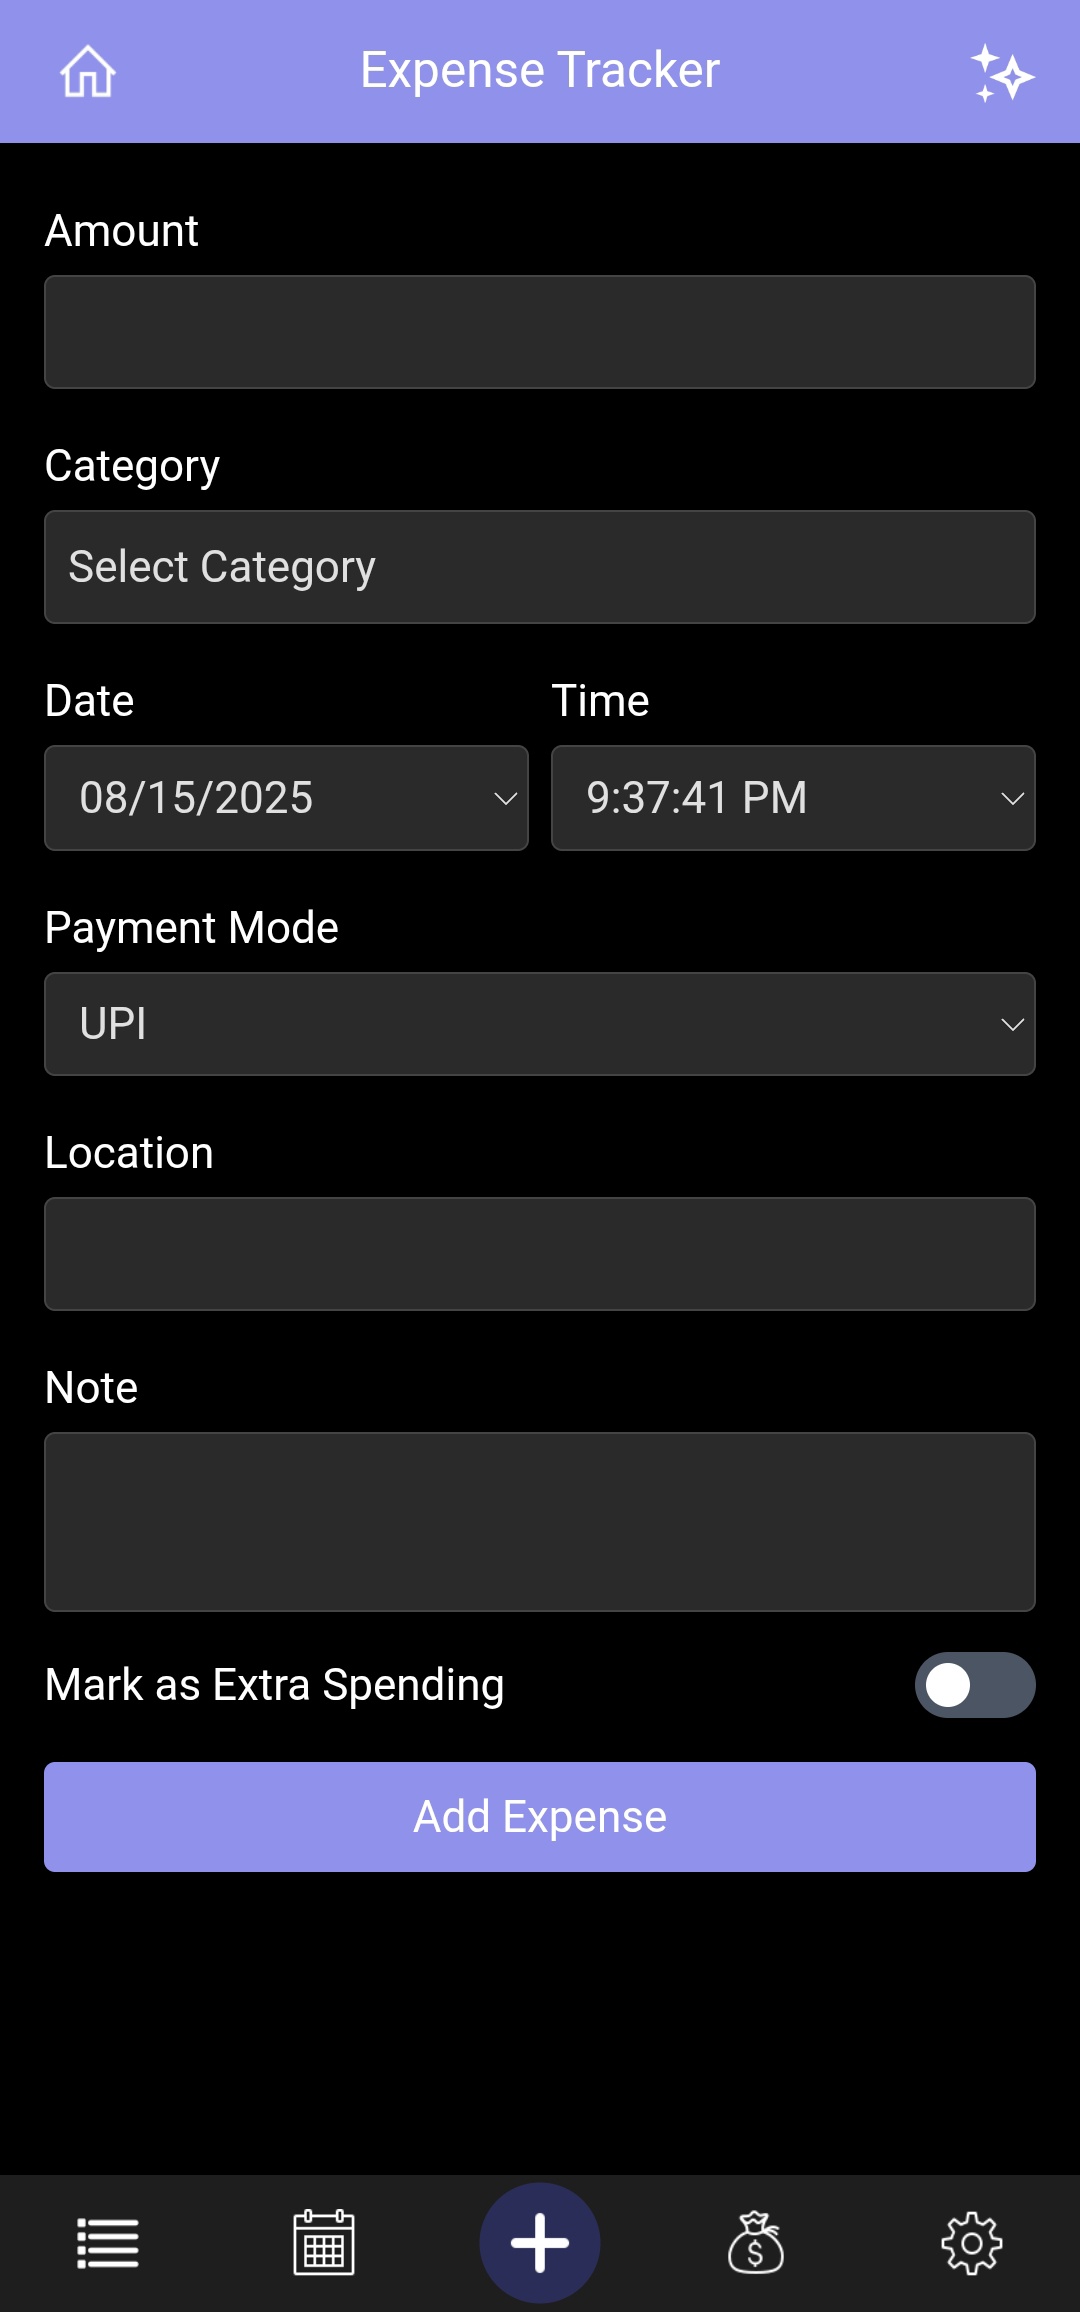
Allows users to add new expense entries through a form. Input fields include:
- 💰 Amount
- 📅 Date & Time
- 🏷️ Category (chosen from a dropdown list)
- 💳 Payment Mode
- 📍 Location (chosen from a dropdown list or manually typed)
- 📝 Note (chosen from a dropdown list or manually typed)
- 💡 Extra Spending
All expenses are stored in the device's LocalStorage and reflected immediately in graphs and listings.
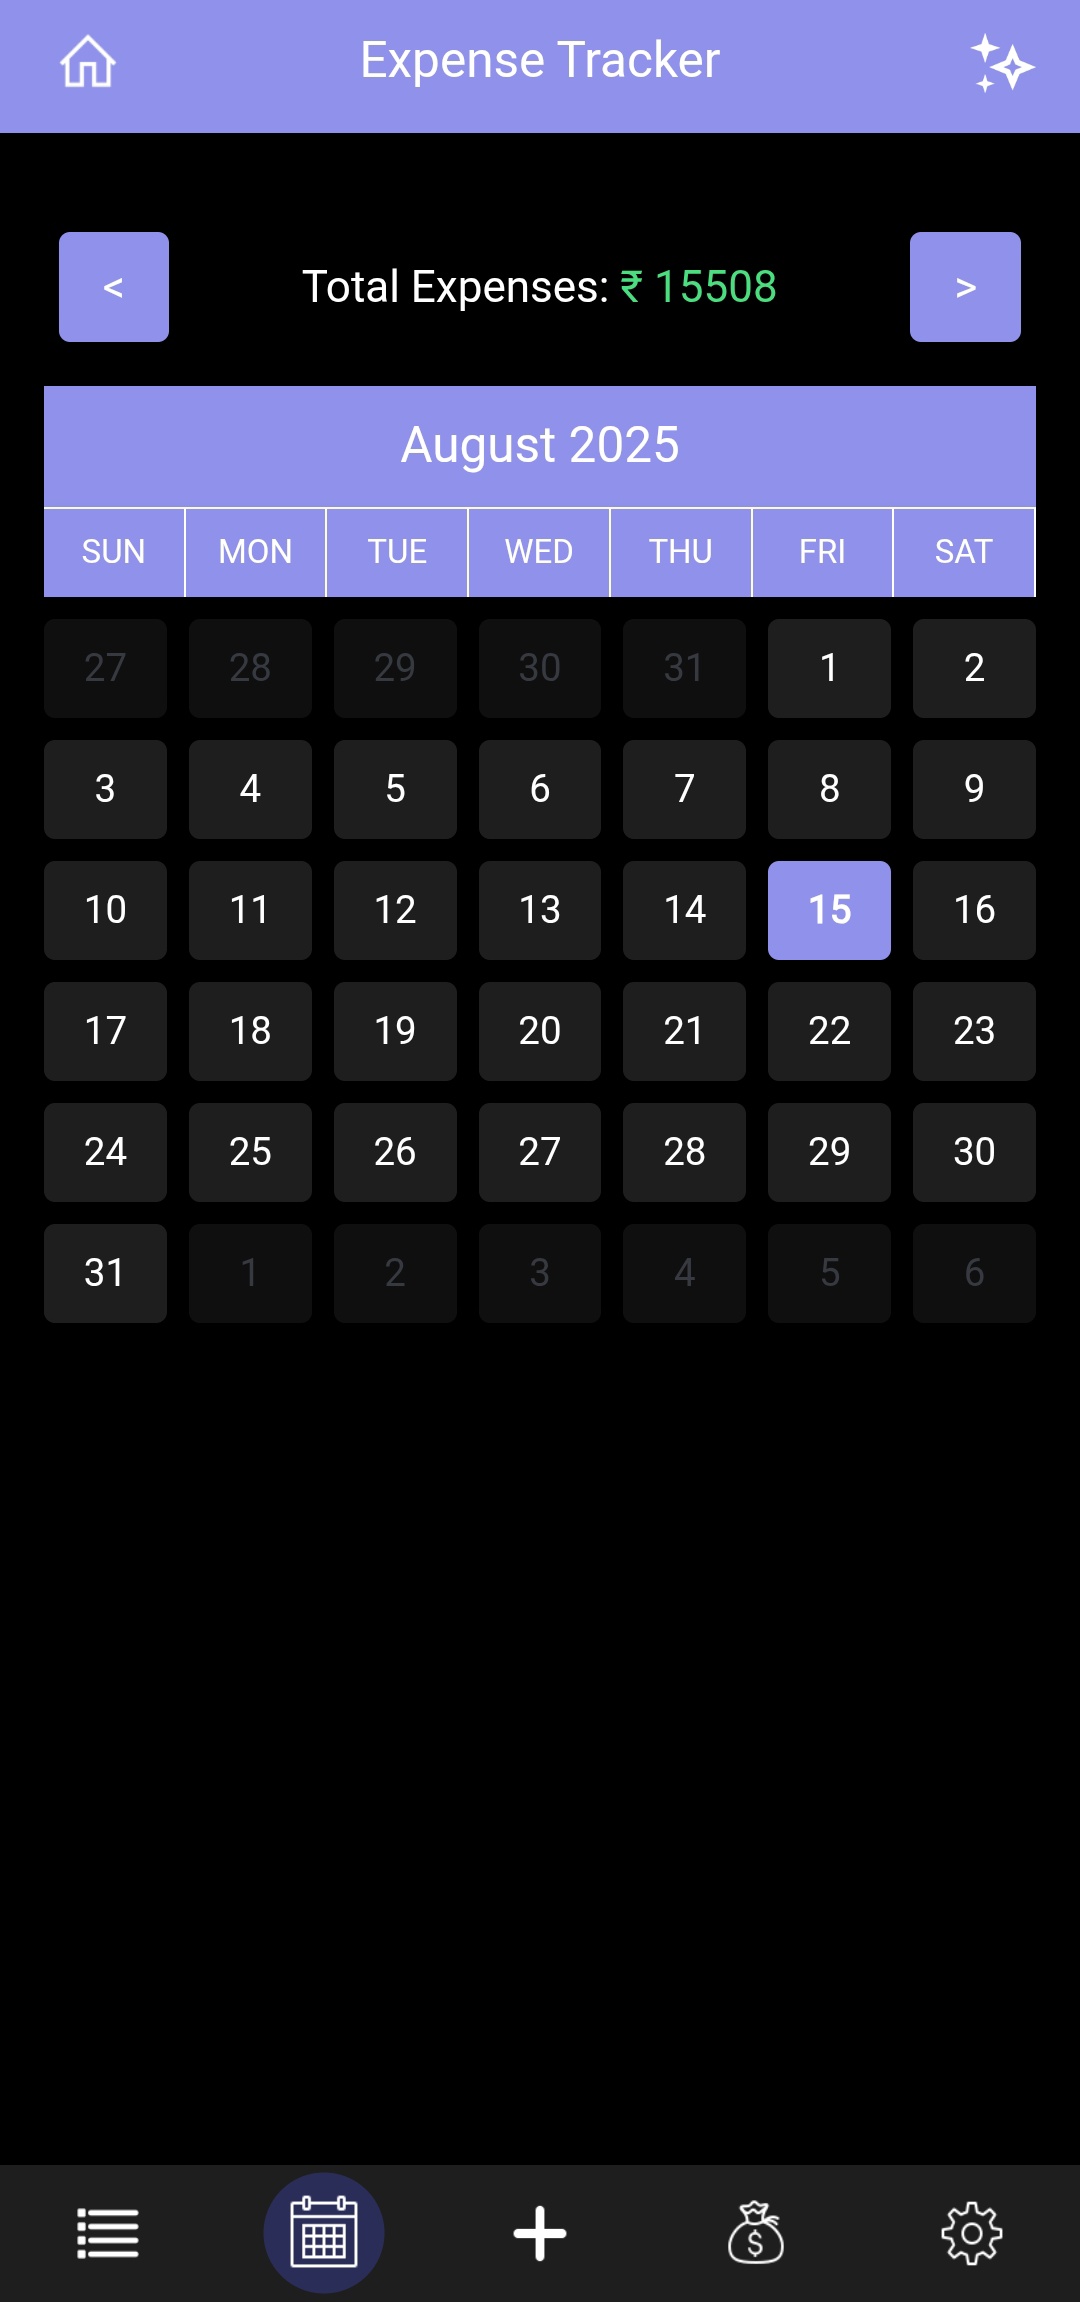
- Users can view a monthly calendar to explore expenses on specific dates.
- Tap any date to open a popup modal displaying all expenses for that day.
- Navigate across months and years to view past or future expenses.
- Toggle the Show HeatMap switch to highlight each day based on spending intensity.
- Days are color-coded based on spending thresholds (e.g. No expense, < threshold, between thresholds, > threshold) for quick insights.
- Users can now customize the threshold amounts for each heatmap color:
- Red (Rose) – default > ₹1000
- Yellow (Amber) – default ₹500 - 1000
- Green (Emerald) – default < ₹500
- A summary table displays each color, the number of days, the total expense, and an Edit button for updating the thresholds.
- Editing allows users to set a new amount for the corresponding color, immediately updating the heatmap visualization.
-
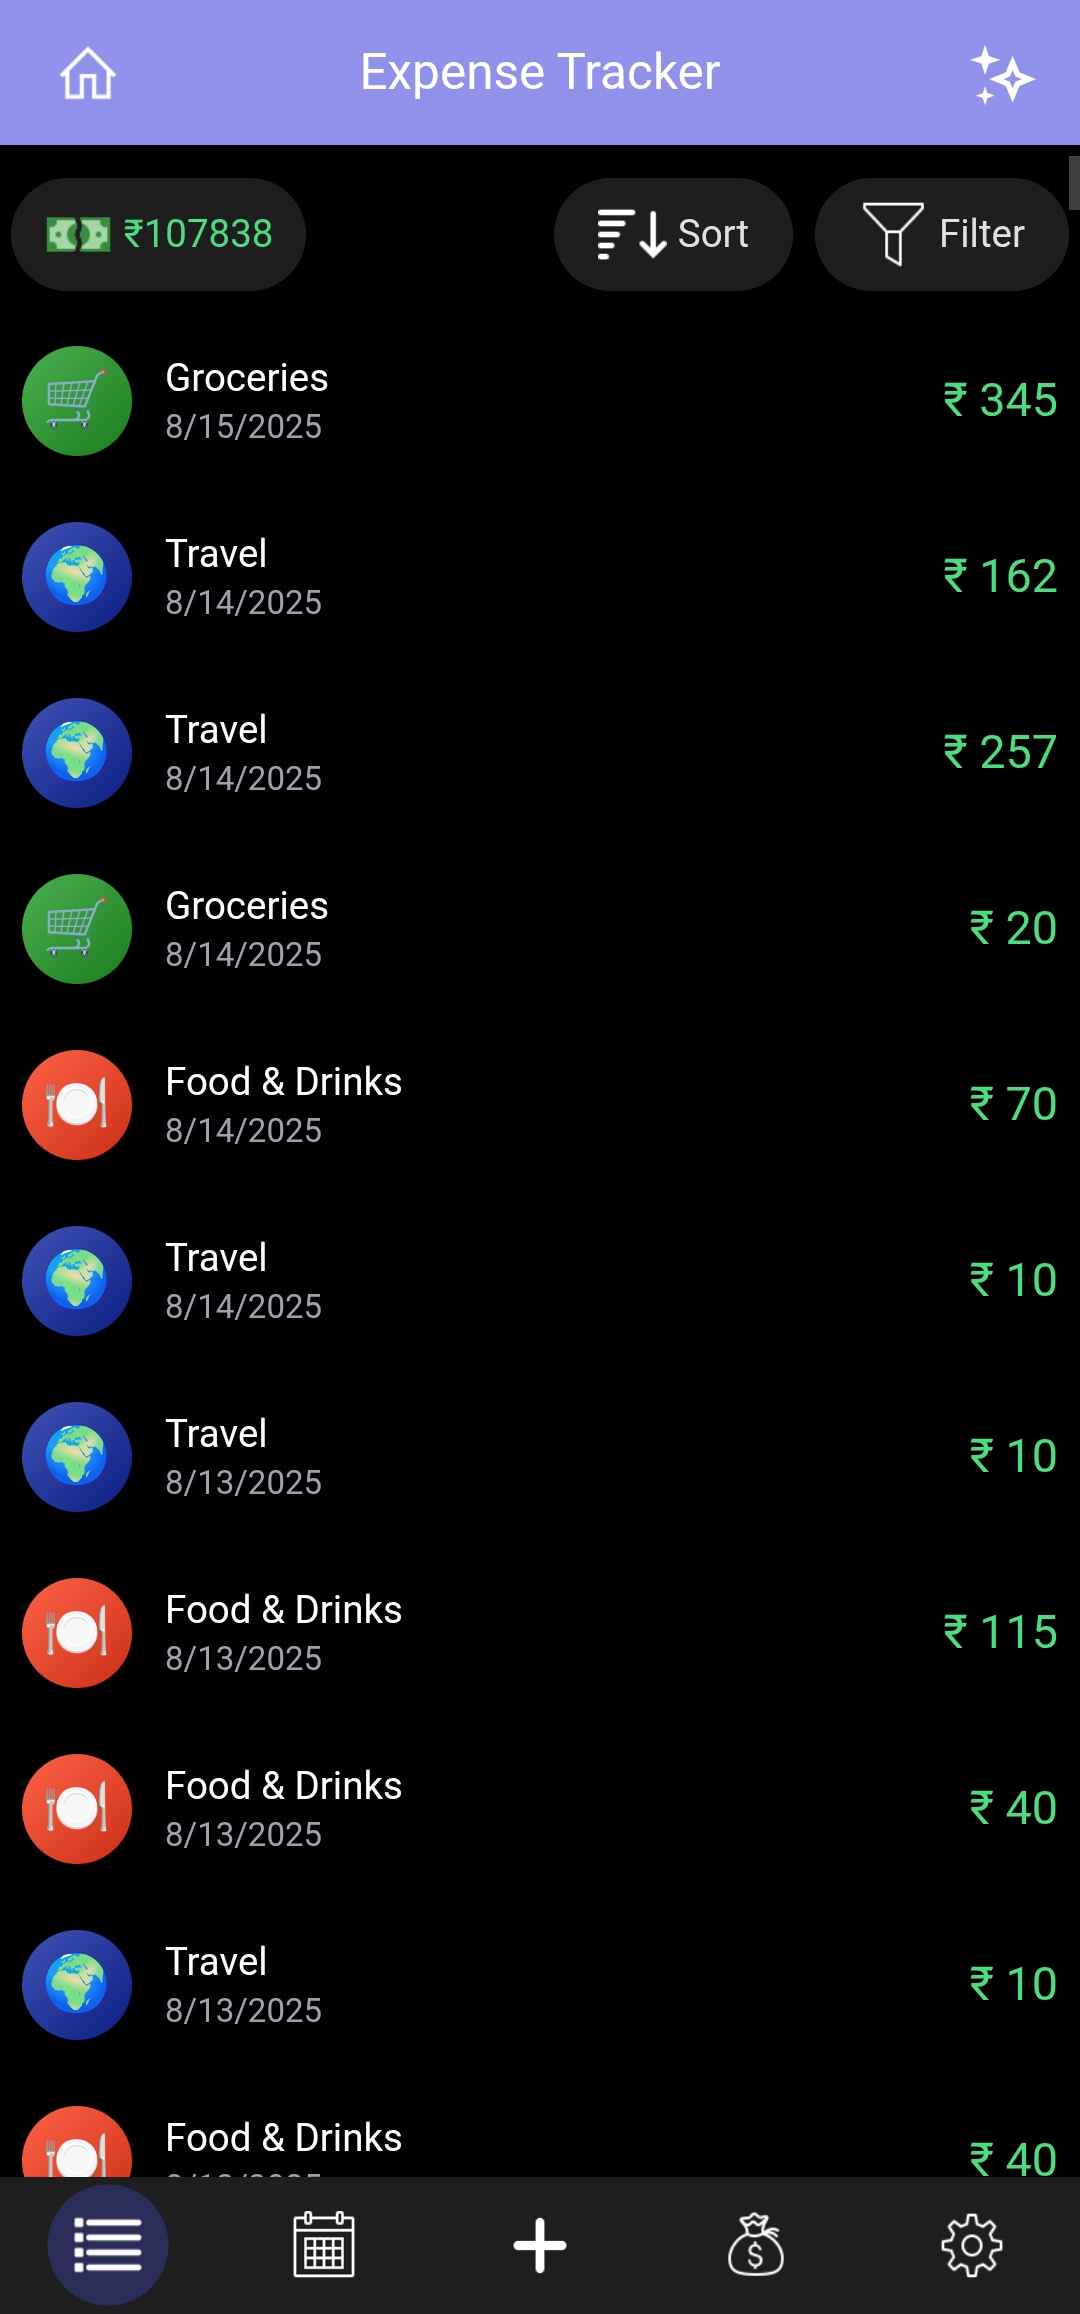
Displays all user expenses in a scrollable, and sortable list.
-
Users can:
- 🔍 Search expenses quickly by typing keywords (category, note, or payment mode).
- 🧾 Sort expenses by date, amount, or category.
- 🎯 Filter by category, date, extra spending, and payment mode.
- 🖱️ Tap any entry to open a modal with complete details and options to edit or delete the expense.
-
Users can define a budget range by selecting a start and end date.
-
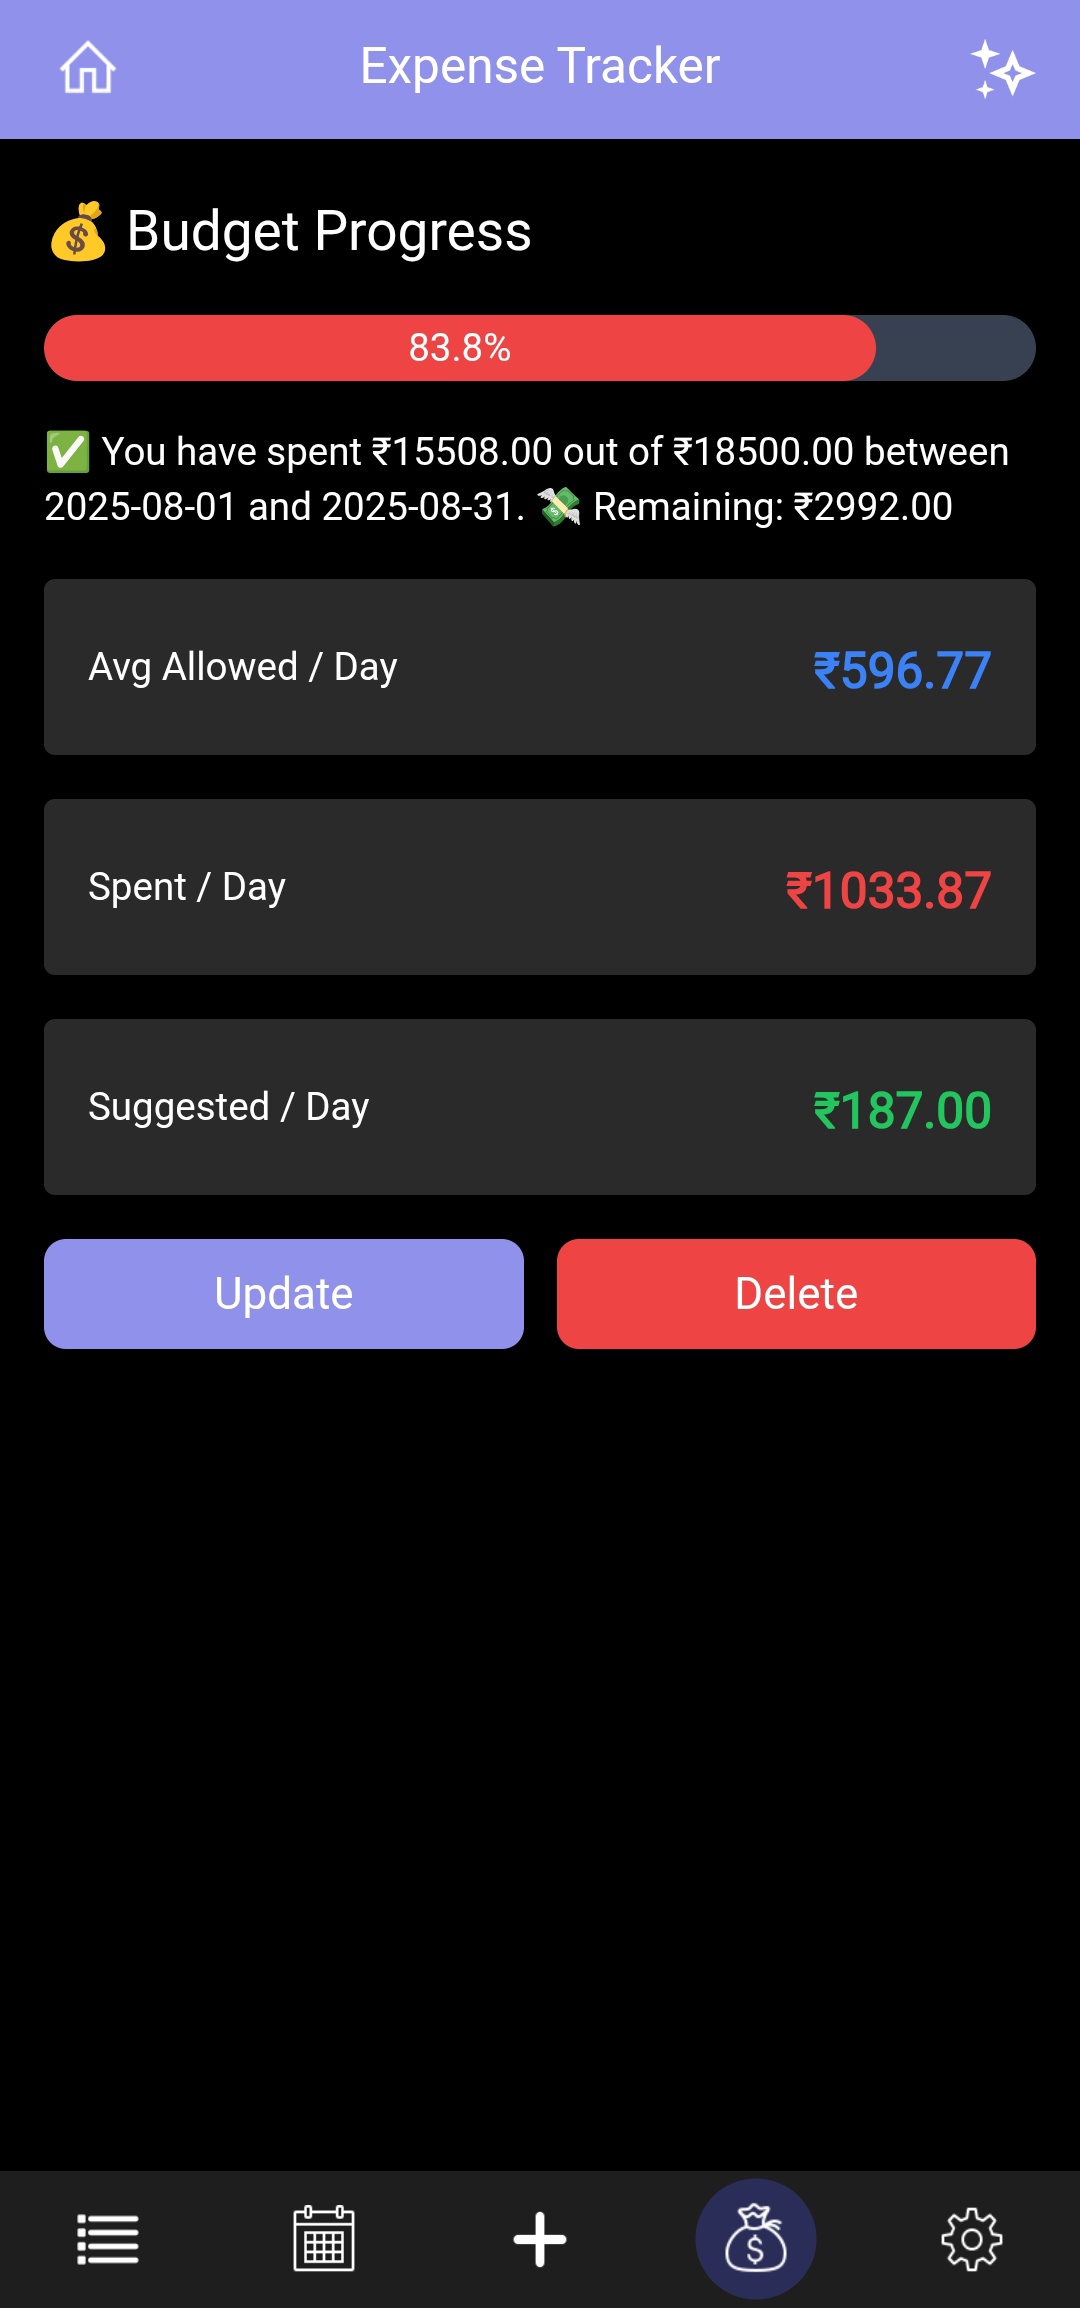
Once a budget is set:
-
A progress bar visually represents how much of the budget has been spent.
-
Informative summary boxes display:
- Avg Allowed/Day
- Spent/Day
- Suggested/Day (based on remaining budget and days)
-
Users have the ability to edit or delete the budget for better flexibility and control.
-
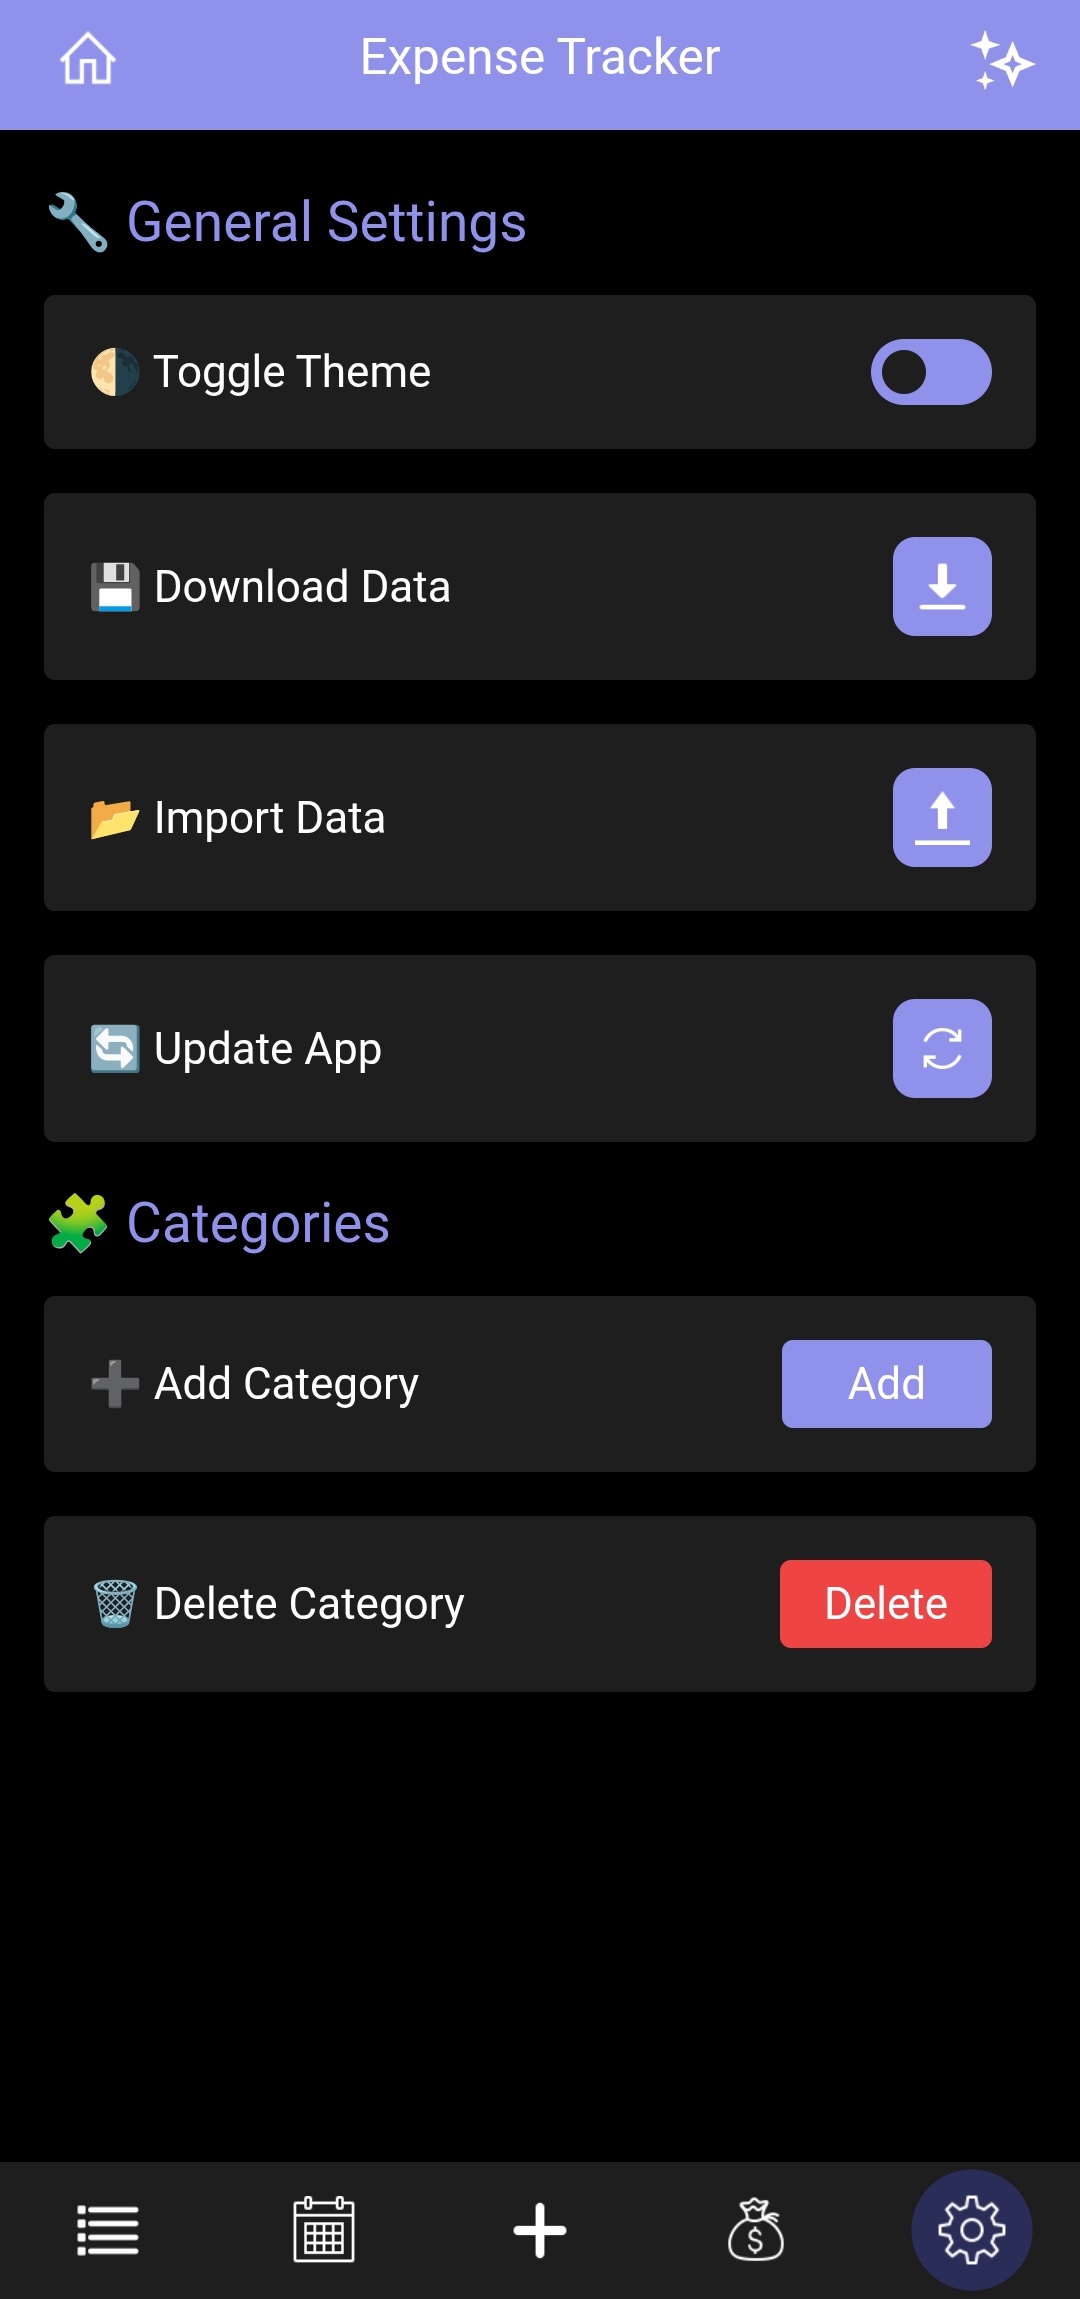
Provides customization and utility options for better personalization:
- 🎨 Theme Mode Toggle — Dark / Light
- ⬇️ Download Data — Export your expenses in PDF, JSON, or Excel formats between the selected date range. Users can also choose All Data to export all expense records.
- 📤 Import Data — Upload expense data.
- 🔄 Update App — Update the application to the latest release.
- ➕ Add Category — Create custom categories for better organization.
- ✏️ Edit Category — Modify existing categories.
- ❌ Delete Category — Remove unused or incorrect categories.
- The application is specifically designed for mobile devices.
- Features responsive components, intuitive touch controls, and visually appealing UI optimized for small screens.
- Not intended for laptop or desktop usage (though it works as PWA).
All user data is stored using the browser’s LocalStorage API, ensuring:
- ✅ No need for a backend or server
- ⚡ Fast read/write operations
- 🔒 Data stays on the user's device for privacy and control
-
Launch App → View Expense Graphs (Toggle between Month/Day).
-
Add Expenses via the ➕ tab.
-
Navigate to:
- Calendar to view per-date expenses.
- List for detailed log with search, filter, and sort options.
- Budget to monitor spending.
- Settings for customization.
For developers and contributors, detailed code-level documentation is available here: 👉 Documentation