


ecscope lets you monitor AWS ECS resources from the terminal.
It does so by offering a TUI which shows services, tasks and
containers in a single view. Instead of having to log into several accounts (or
change regions) via the AWS website, you're able to view relevant information
for ECS deployments in one place. You can group services by configuring them via
a "profile", and have ecscope load it up. Besides the TUI, ecscope can also
show deployments updates via a minimal web interface.
homebrew:
brew install dhth/tap/ecscopecargo:
cargo install ecscopeOr get the binaries directly from a Github release. Read more about verifying the authenticity of released artifacts here.
Usage: ecscope [OPTIONS] <COMMAND>

Commands:
  deps      List ECS deployments
  profiles  Manage ecscope's profiles
  monitor   Open monitoring TUI
  help      Print this message or the help of the given subcommand(s)

Options:
      --debug  Output debug information without doing anything
  -h, --help   Print help
ecscope.mp4
The first thing you'll do after installing ecscope is to set up a profile. A
profile is simply configuration that groups together ECS resources you want to
monitor in one go. You set up a profile using:
ecscope profiles add <PROFILE>This will generate a TOML file in your config directory that looks like this:
[[clusters]]
keys = ["<KEY>"]
arn = "arn:aws:ecs:eu-central-1:<ACCOUNT_ID>:cluster/<CLUSTER_NAME>"
services = [
  "service-a",
  "service-b"
]
# use this to provide configuration and credentials via environment variables
# https://docs.aws.amazon.com/sdkref/latest/guide/environment-variables.html
config_source = "env"

[[clusters]]
keys = ["<KEY>"]
arn = "arn:aws:ecs:eu-central-1:<ACCOUNT_ID>:cluster/<CLUSTER_NAME>"
services = [
  "service-a",
  "service-b"
]
# use this to leverage a profile contained in the shared AWS config and credentials files
# https://docs.aws.amazon.com/sdkref/latest/guide/file-format.html
config_source = "profile:<PROFILE_NAME>"

[[clusters]]
keys = ["<KEY>"]
arn = "arn:aws:ecs:eu-central-1:<ACCOUNT_ID>:cluster/<CLUSTER_NAME>"
services = [
  "service-a",
  "service-b"
]
# use this when you want to provide configuration and credentials via environment variables
# but want to assume another role for performing the actual operations
config_source = "assume:<IAM_ROLE_ARN>"You can list configured profiles using ecscope profiles list.
ecscope supports getting AWS configuration from the following sources:
This is configured by setting config_source to "env" in the profile config.
The following environment variables need to be set for this option.
- AWS_ACCESS_KEY_ID
- AWS_SECRET_ACCESS_KEY
- AWS_SESSION_TOKEN
- AWS_REGION
Read more about this here.
Use this option when you want to leverage profiles set in the shared AWS config for authentication and configuration.
ecscope can be configured to use this option by setting config_source to
"profile:<PROFILE>" in the profile config.
ECS deployments can be viewed using the deps command.
$ ecscope deps -h

Usage: ecscope deps [OPTIONS] <PROFILE>

Arguments:
  <PROFILE>  Profile to use

Options:
  -s, --service-filter <REGEX>  Filtration query for service names
  -k, --key-filter <REGEX>      Filtration query for cluster keys
  -S, --state <STRING>          Deployment state to query for [possible values: finished, in-progress, failing]
  -c, --config-dir <PATH>       Config directory (to override ecscope's default config directory)
  -f, --format <STRING>         Format to use [default: json] [possible values: delimited, json, plain]
      --debug                   Output debug information without doing anything
  -m, --mode <STRING>           Output mode [default: default] [possible values: default, web]
      --web-skip-opening        Whether to skip opening web results in browser (when --mode=web)
  -h, --help                    Print help (see more with '--help')
ecscope deps <PROFILE>

# filter by cluster keys
ecscope deps <PROFILE> -k prod

# filter by cluster keys
ecscope deps <PROFILE> -k '(qa|prod)'

# filter by service names
ecscope deps <PROFILE> -s '.*-service'

# only show deployments that are finished
ecscope deps <PROFILE> --state finished

# only show deployments that are pending
ecscope deps <PROFILE> --state pending

# only show deployments that are failing
ecscope deps <PROFILE> --state failing
By default, the deps command outputs results in the JSON format.
Sample output
ecscope deps <PROFILE> -s auth[
{
"service_name": "authentication-service",
"keys": "qa",
"cluster_arn": "arn:aws:ecs:eu-central-1:<REDACTED>:cluster/authentication-service-infrastructure-qa",
"deployment_id": "ecs-svc/<REDACTED>",
"status": "PRIMARY",
"running_count": 3,
"desired_count": 3,
"pending_count": 0,
"failed_count": 0
},
{
"service_name": "authentication-service",
"keys": "staging",
"cluster_arn": "arn:aws:ecs:eu-central-1:<REDACTED>:cluster/authentication-service-infrastructure-staging",
"deployment_id": "ecs-svc/<REDACTED>",
"status": "PRIMARY",
"running_count": 1,
"desired_count": 1,
"pending_count": 0,
"failed_count": 0
},
{
"service_name": "authentication-service",
"keys": "prod",
"cluster_arn": "arn:aws:ecs:eu-central-1:<REDACTED>:cluster/authentication-service-infrastructure-prod",
"deployment_id": "ecs-svc/<REDACTED>",
"status": "PRIMARY",
"running_count": 3,
"desired_count": 3,
"pending_count": 0,
"failed_count": 0
}
]You can view the output of deps command as a table as follows (uses
tbll):
ecscope deps <PROFILE> -s auth -f delimited |
    (read -r header && echo "$header" && sort) |
    tbll -C 2,3
┌────────────────────────┬─────────┬─────────┬───────────────┬───────────────┬───────────────┬──────────────┐
│ service_name │ keys │ status │ running_count │ desired_count │ pending_count │ failed_count │
├────────────────────────┼─────────┼─────────┼───────────────┼───────────────┼───────────────┼──────────────┤
│ authentication-service │ prod │ PRIMARY │ 3 │ 3 │ 0 │ 0 │
│ authentication-service │ qa │ PRIMARY │ 3 │ 3 │ 0 │ 0 │
│ authentication-service │ staging │ PRIMARY │ 1 │ 1 │ 0 │ 0 │
└────────────────────────┴─────────┴─────────┴───────────────┴───────────────┴───────────────┴──────────────┘
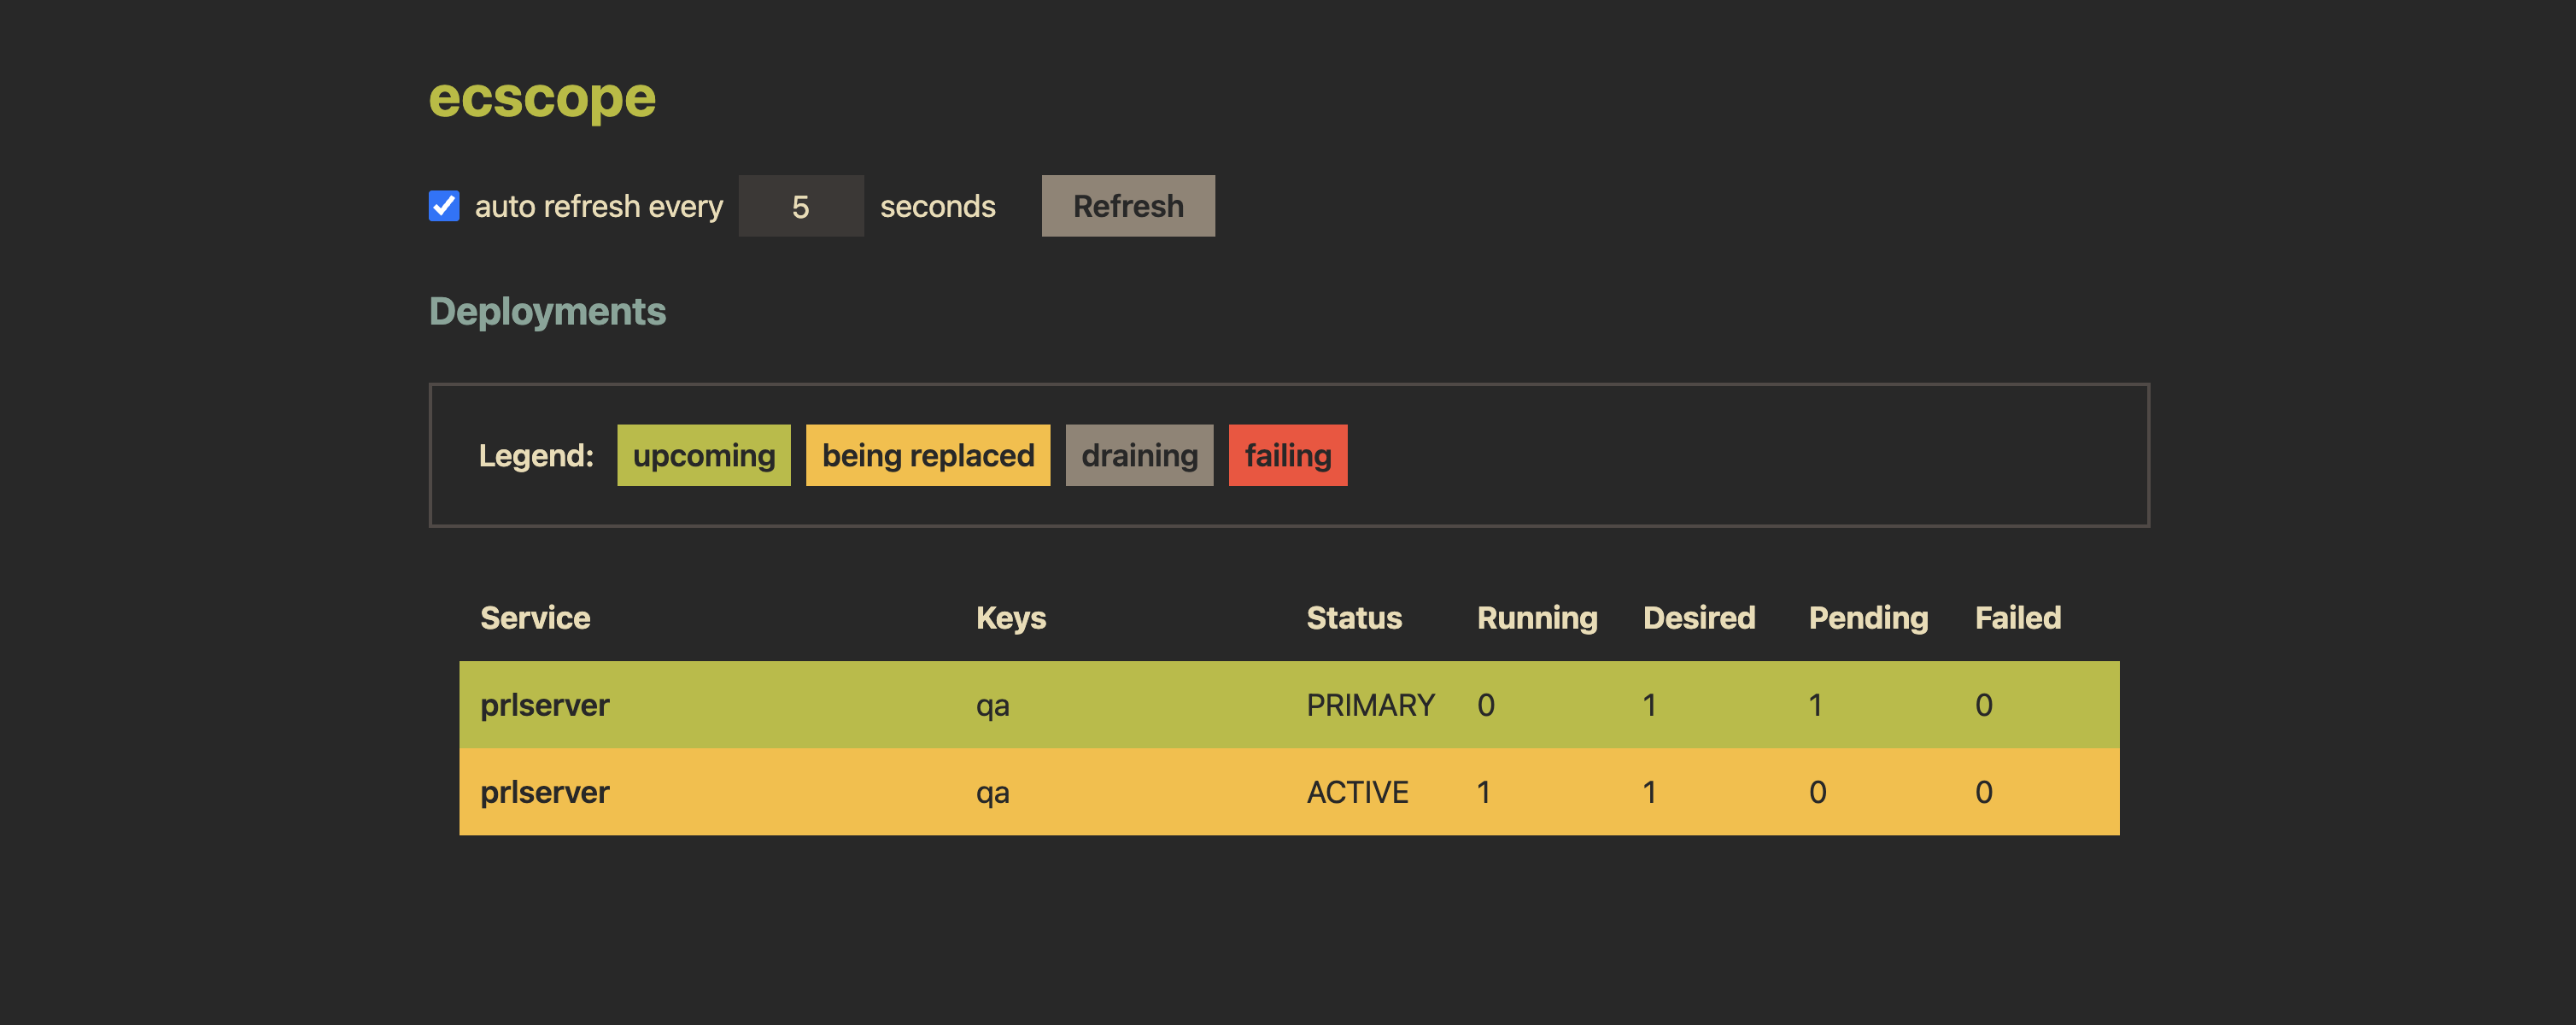
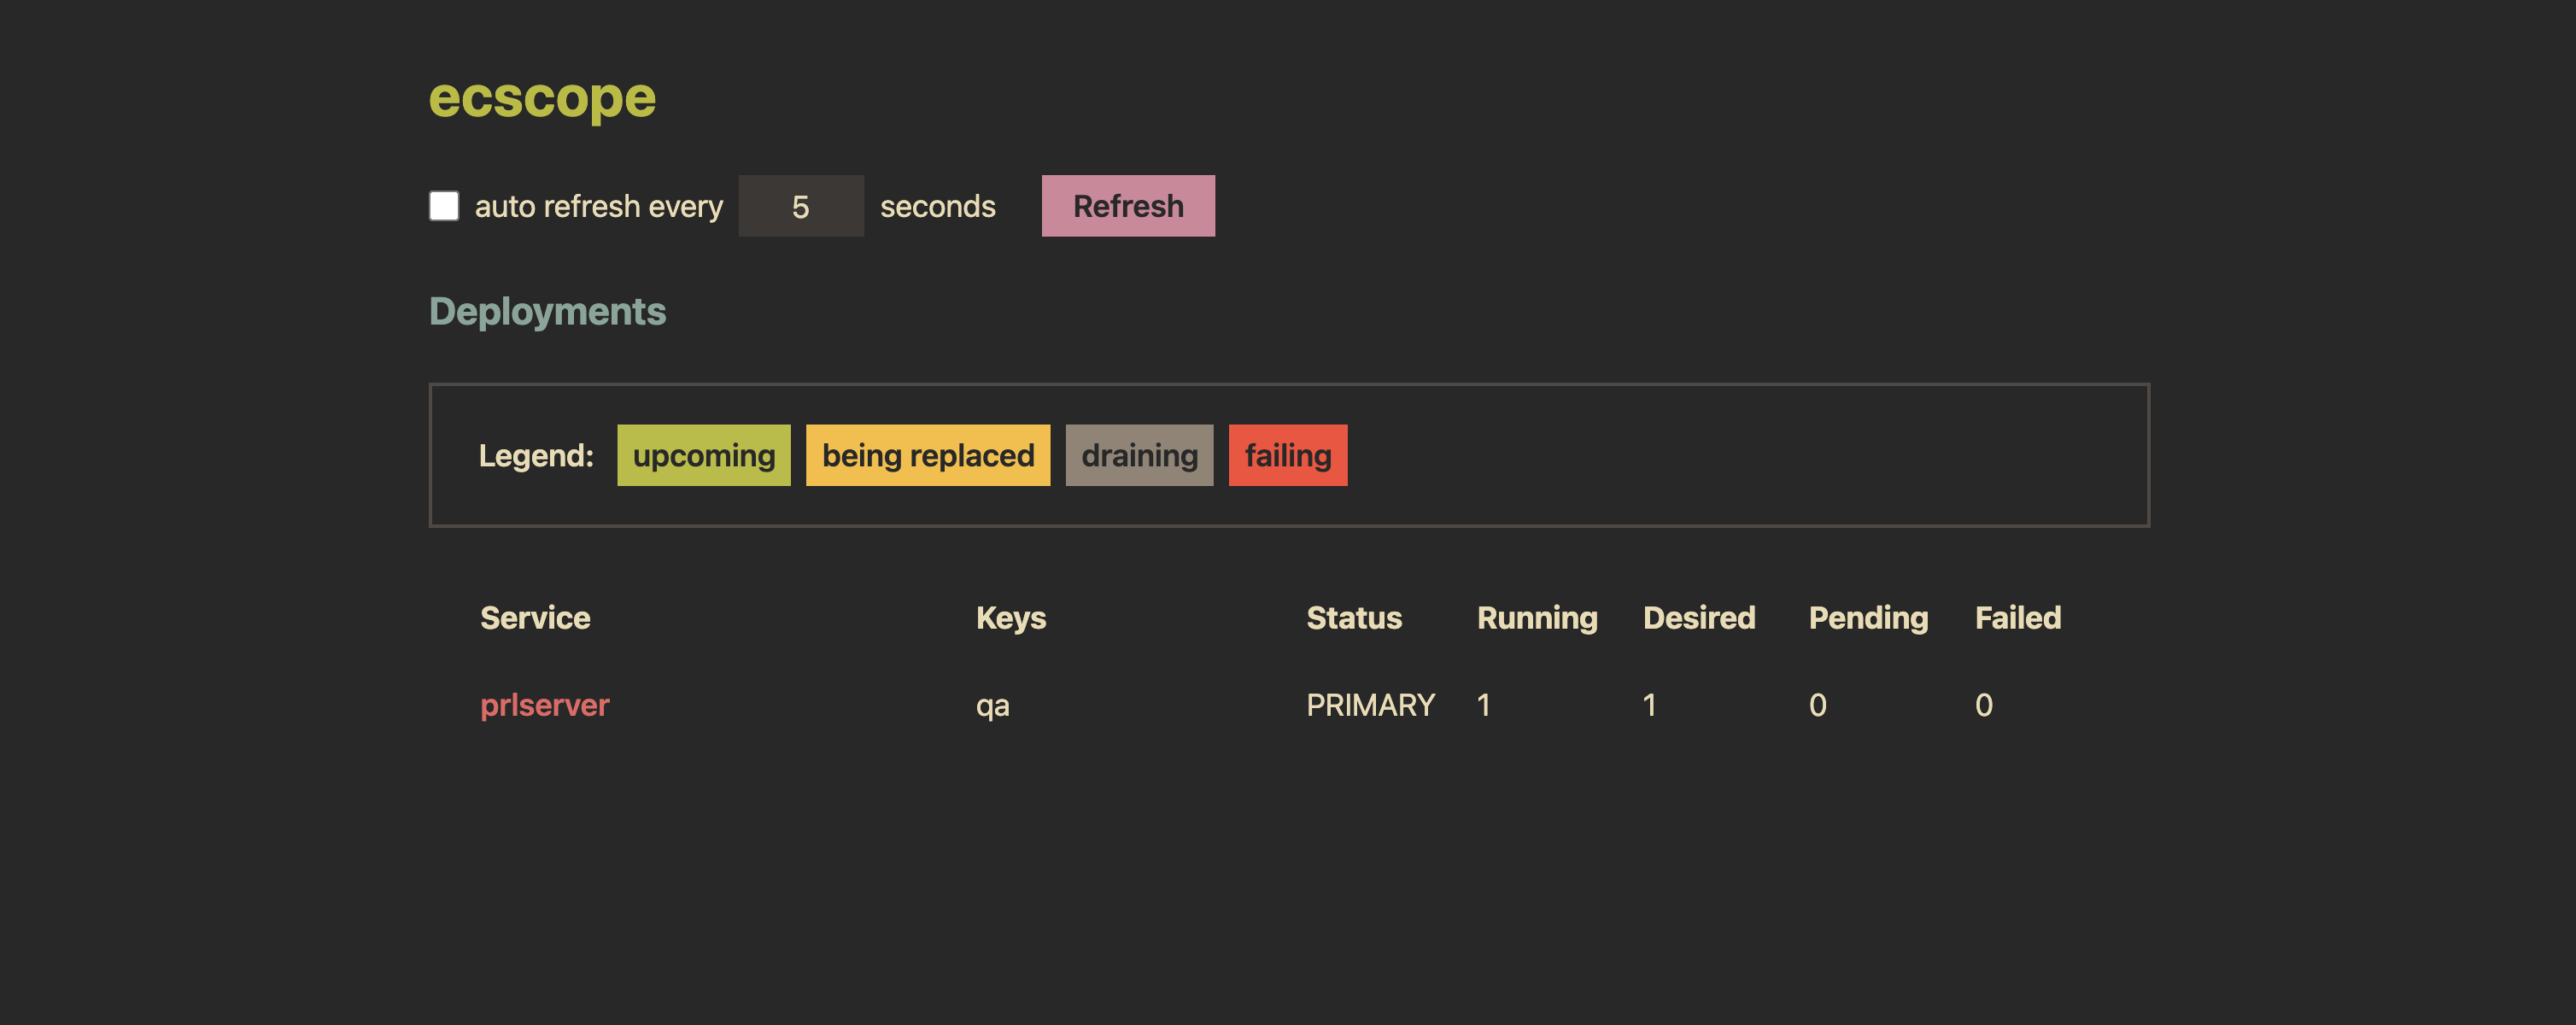
Deployments can also be viewed through a web UI (using --mode web). This
allows you to monitor deployment status in real time with a simple interface.
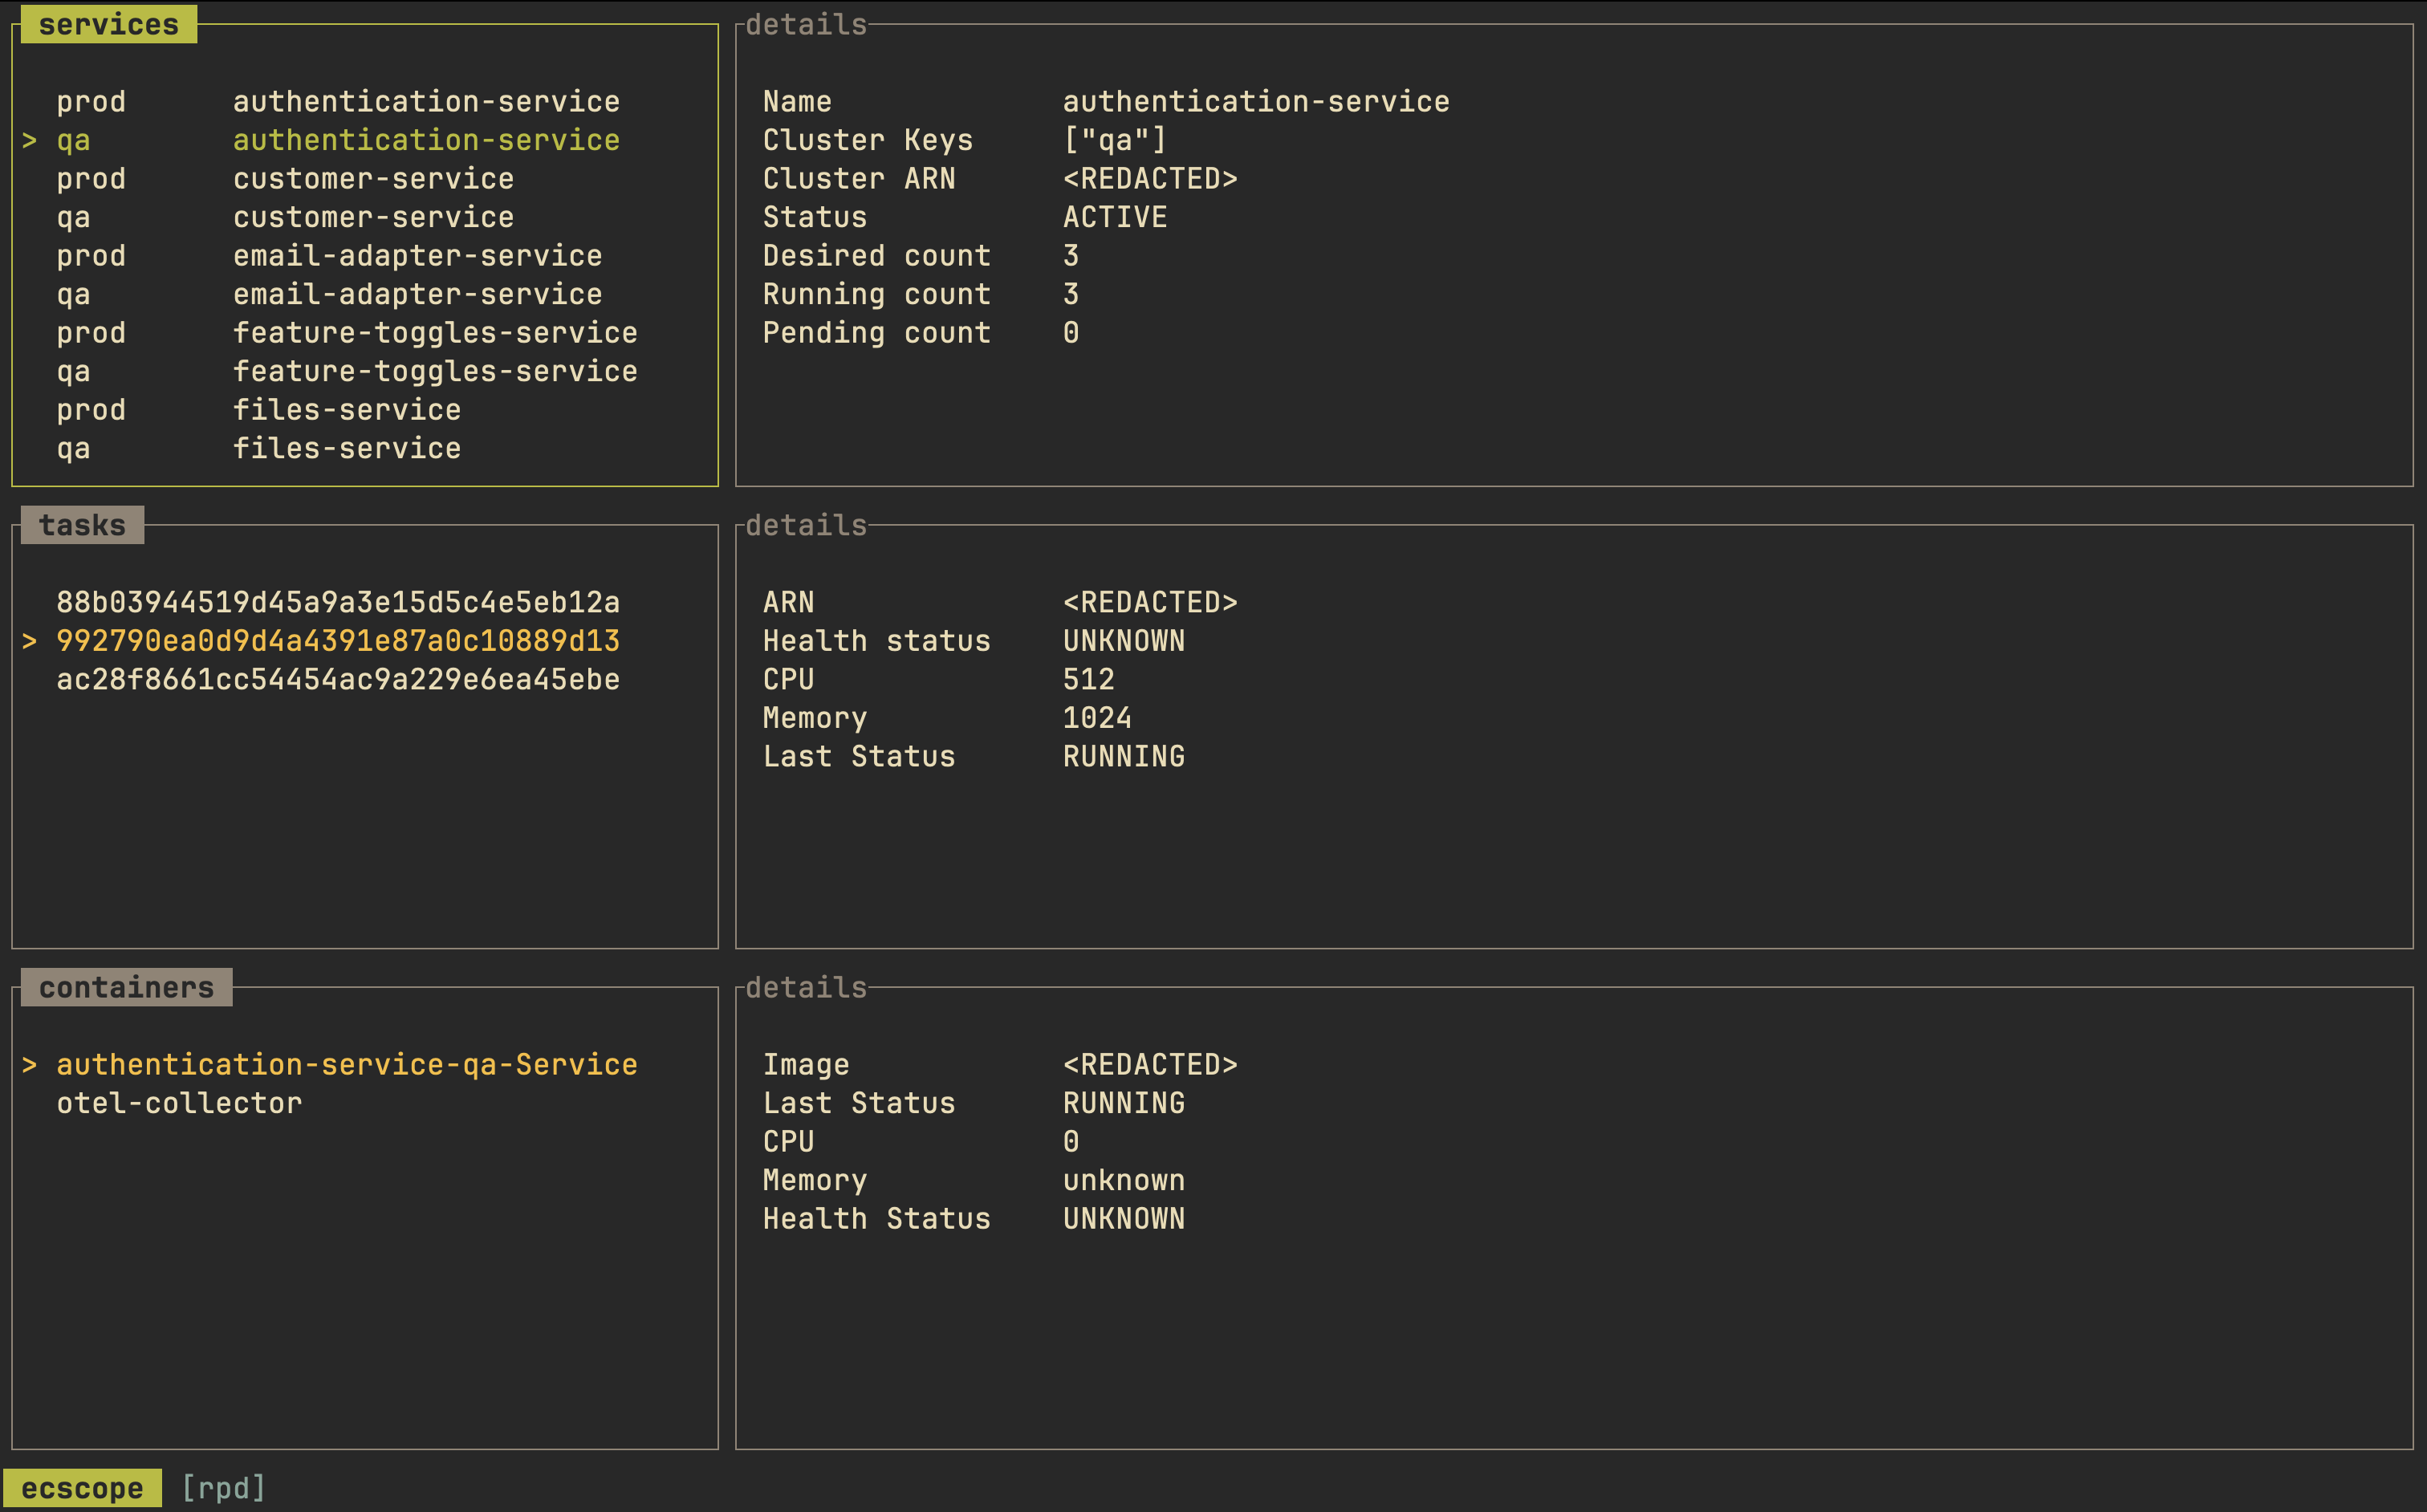
Once a profile is configured, you can begin monitoring ECS deployments via
ecscope's TUI.
$ ecscope monitor -h

Usage: ecscope monitor [OPTIONS] <PROFILE>

Arguments:
  <PROFILE>  Profile to use

Options:
  -s, --service-filter <REGEX>  Filtration query for service names
  -k, --key-filter <REGEX>      Filtration query for cluster keys
      --debug                   Output debug information without doing anything
  -h, --help                    Print help
The TUI displays running tasks for each configured service, along with their respective containers. Additionally, details for the currently selected service, task, and container are shown in dedicated panes to the right.
The TUI also supports refreshing of results — either on a schedule or manually. Additionally, you can mark specific services to be targeted for the refresh.
Keymaps
---

General
    ?                    show/hide help view
    Esc / q              go back/exit
    <ctrl+c>             exit immediately

Main View
    j / ↓                go down in a list
    k / ↑                go up in a list
    H / ←                move to the pane to the left
    J / Tab              move to the pane below
    K / <S-Tab>          move to the pane above
    L / →                move to the pane to the right
    r                    refresh details for current item
    <c-r>                refresh data (either the ones marked, or all)
    R                    toggle auto refresh (for either the ones marked, or all)

Services List
    m                    mark service for auto refresh
You can filter services using two kinds of filter queries, one for the cluster key and the other for the service name.
# will show all services that match a regex .*-service
ecscope monitor profile -s '.*-service'
# will show all services in clusters where a key matches the regex qa|staging
ecscope monitor profile -k 'qa|staging'
# combine both filters
ecscope monitor profile -s '.*-service' -k 'qa'In case you get the ecscope binary directly from a release, you may want
to verify its authenticity. Checksums are applied to all released artifacts, and
the resulting checksum file is attested using Github Attestations.
Steps to verify (replace A.B.C in the commands below with the version you
want):
-
Download the sha256 checksum file for your platform from the release:
curl -sSLO https://github.com/dhth/ecscope/releases/download/vA.B.C/ecscope-x86_64-unknown-linux-gnu.tar.xz.sha256
-
Verify the integrity of the checksum file using gh.
gh attestation verify ecscope-x86_64-unknown-linux-gnu.tar.xz.sha256 --repo dhth/ecscope
-
Download the compressed archive you want, and validate its checksum:
curl -sSLO https://github.com/dhth/ecscope/releases/download/vA.B.C/ecscope-x86_64-unknown-linux-gnu.tar.xz
sha256sum --ignore-missing -c ecscope-x86_64-unknown-linux-gnu.tar.xz.sha256
-
If checksum validation goes through, uncompress the archive:
tar -xzf ecscope-x86_64-unknown-linux-gnu.tar.xz
cd ecscope-x86_64-unknown-linux-gnu
./ecscope
# profit!
- ecsv lets you quickly check the versions of your systems running in ECS tasks across various environments