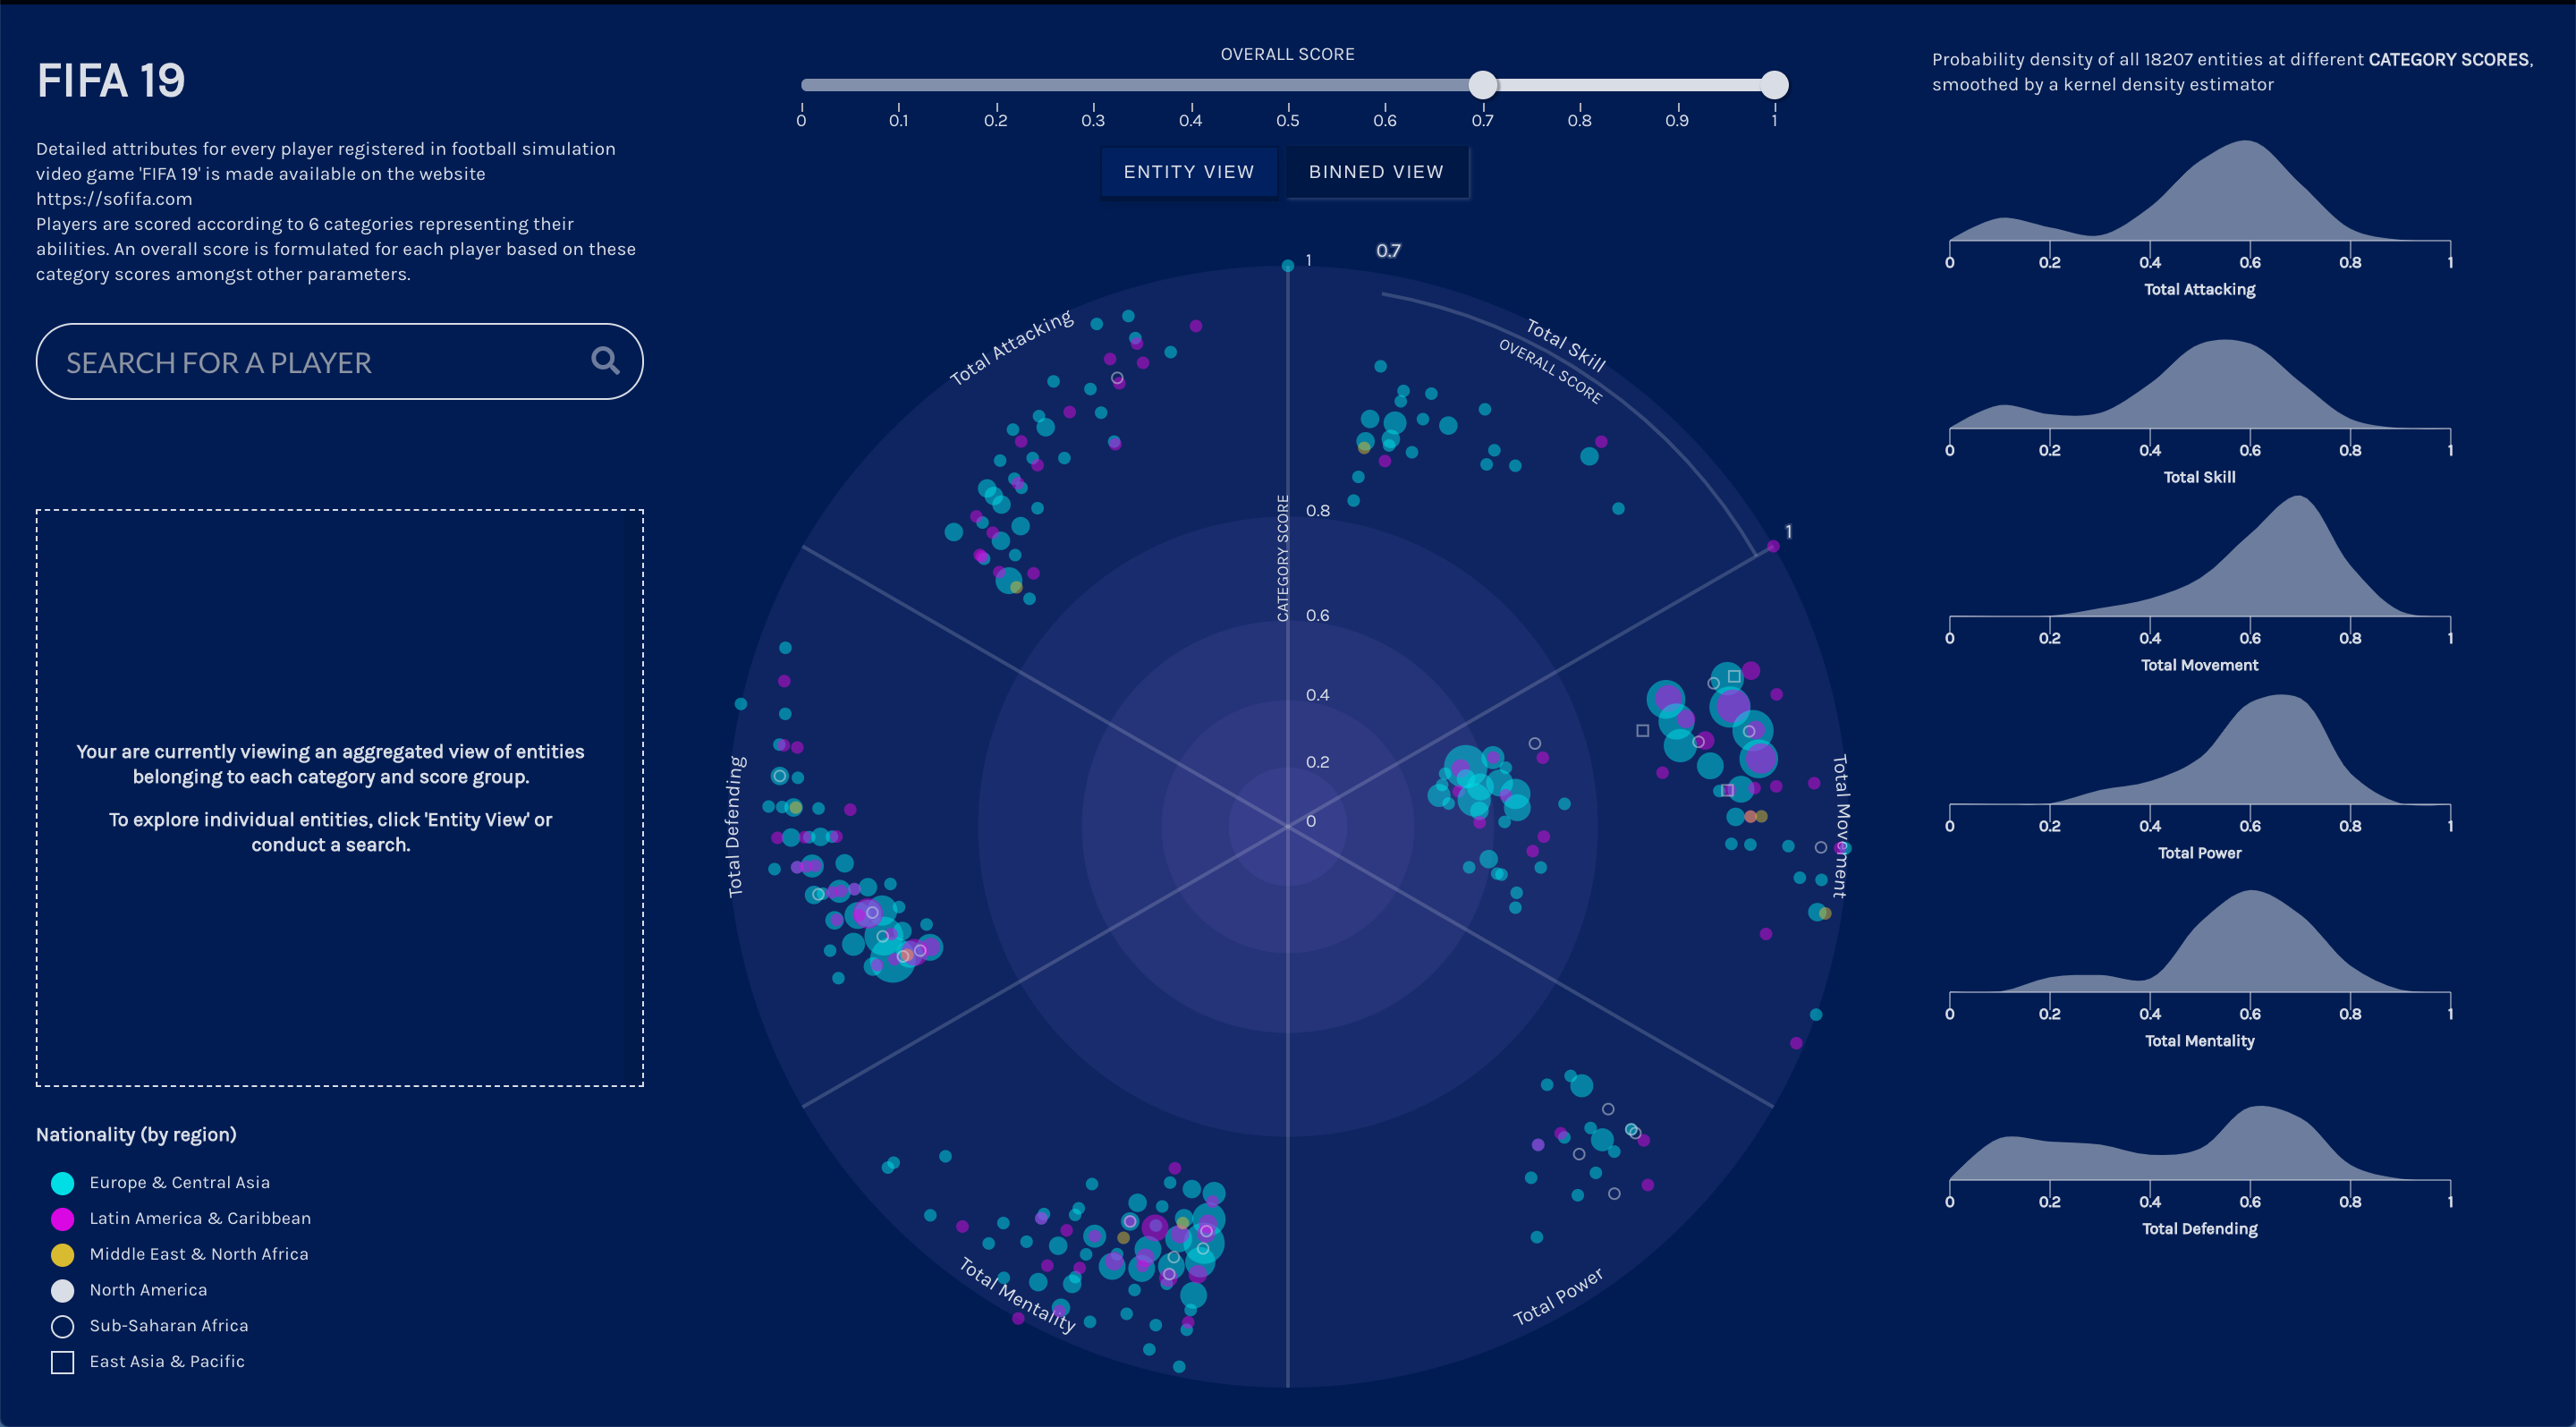
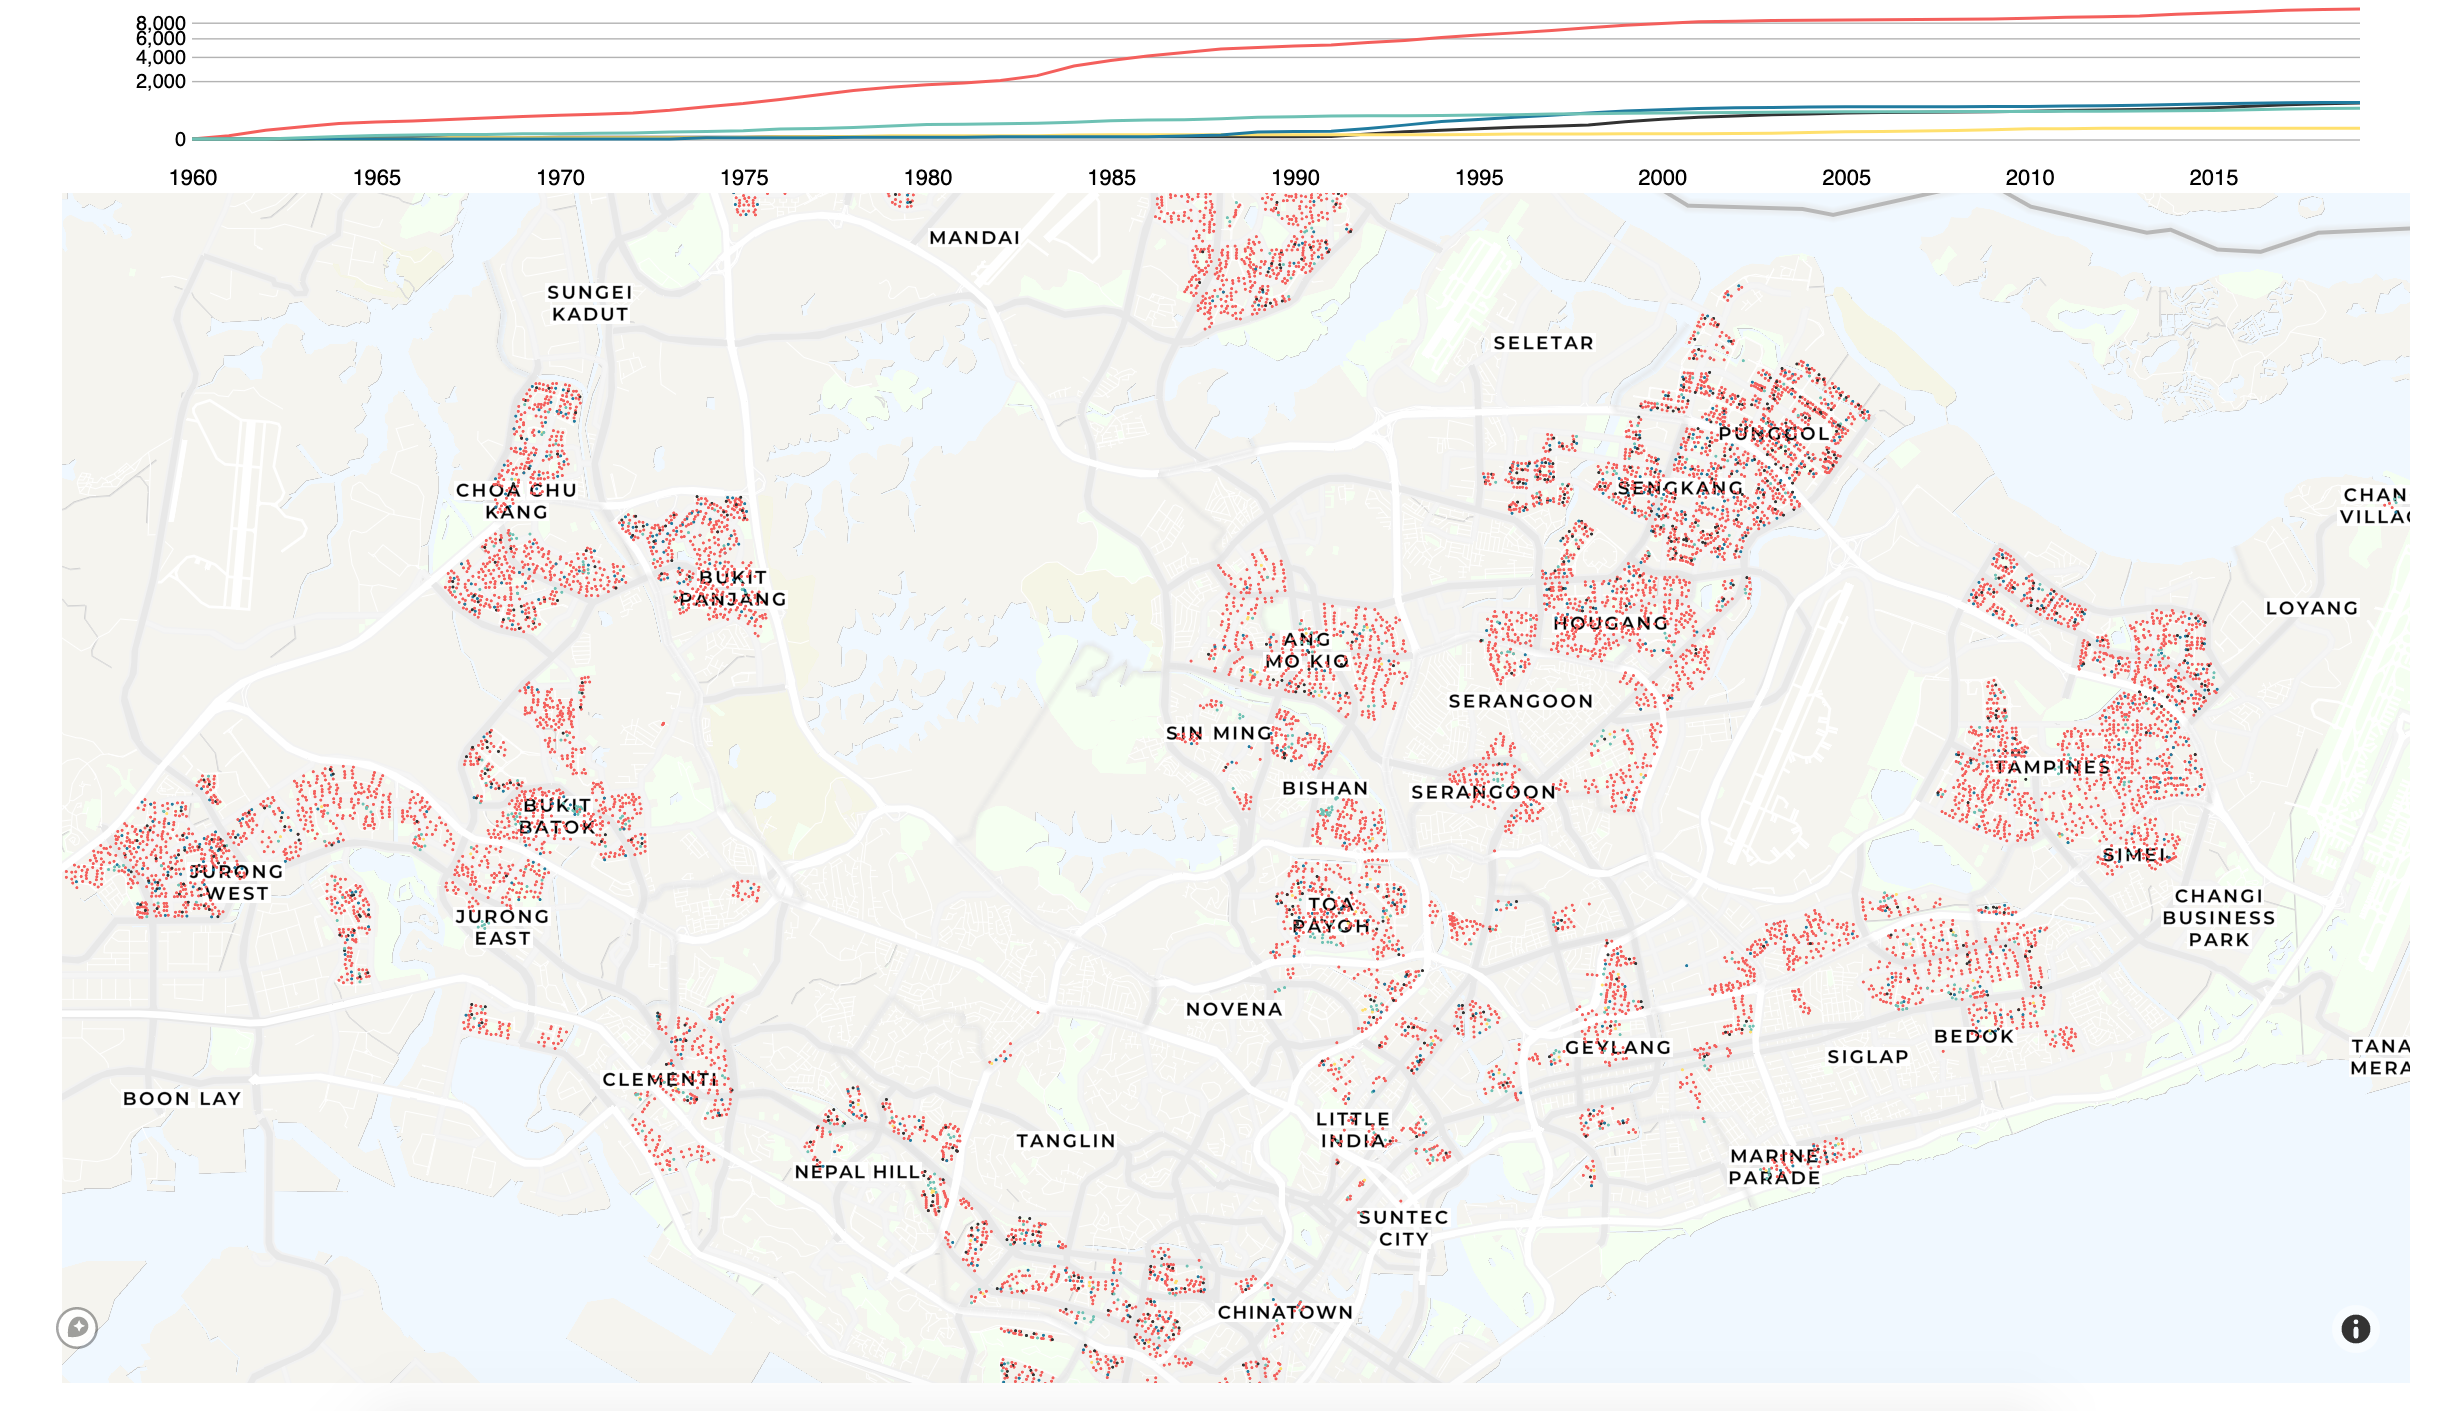
I am a Web Developer with expertise building data-rich web applications, creative visual interfaces and interactive business intelligence dashboards. My specialisation is in relationship mapping through network/graph visualization with D3.js, PIXI.js and Neo4j.
Know-how:
- Designing and creating data viz, from simple chart types to custom high-density visuals, with Javascript/Python in either object oriented or functional paradigm
- Creating React/Next.js or Svelte-based web applications from the ground up
- Creating reusable and responsive UI layouts and components with CSS/Tailwind CSS/Chakra UI from existing Figma designs
- Designing and creating network/graph visualizations with D3.js, PIXI.js
- Neo4j set-up, graph modelling, data import, cypher querying
- Handling complex data structures and creating data processing pipelines
- Creating backend-for-frontend APIs with Node.js, Express or Flask
- Postgresql database (Supabase) set-up, schema creation and querying
- App deployment to platforms such as Vercel, Netlify, AWS.
- App testing with Jest
Recent interest:
- Generative AI: Knowledge graph construction from unstructured and structured documents with LangChain, LLM, OpenAI, Neo4j
- Generative AI: Neo4j graph-based Retrieval-Augmented Generation (RAG) system, experimenting with various RAG techniques
- Prompt engineering
Please reach out to me on Contra or Upwork if you are interested to hire me or work together on a project!


