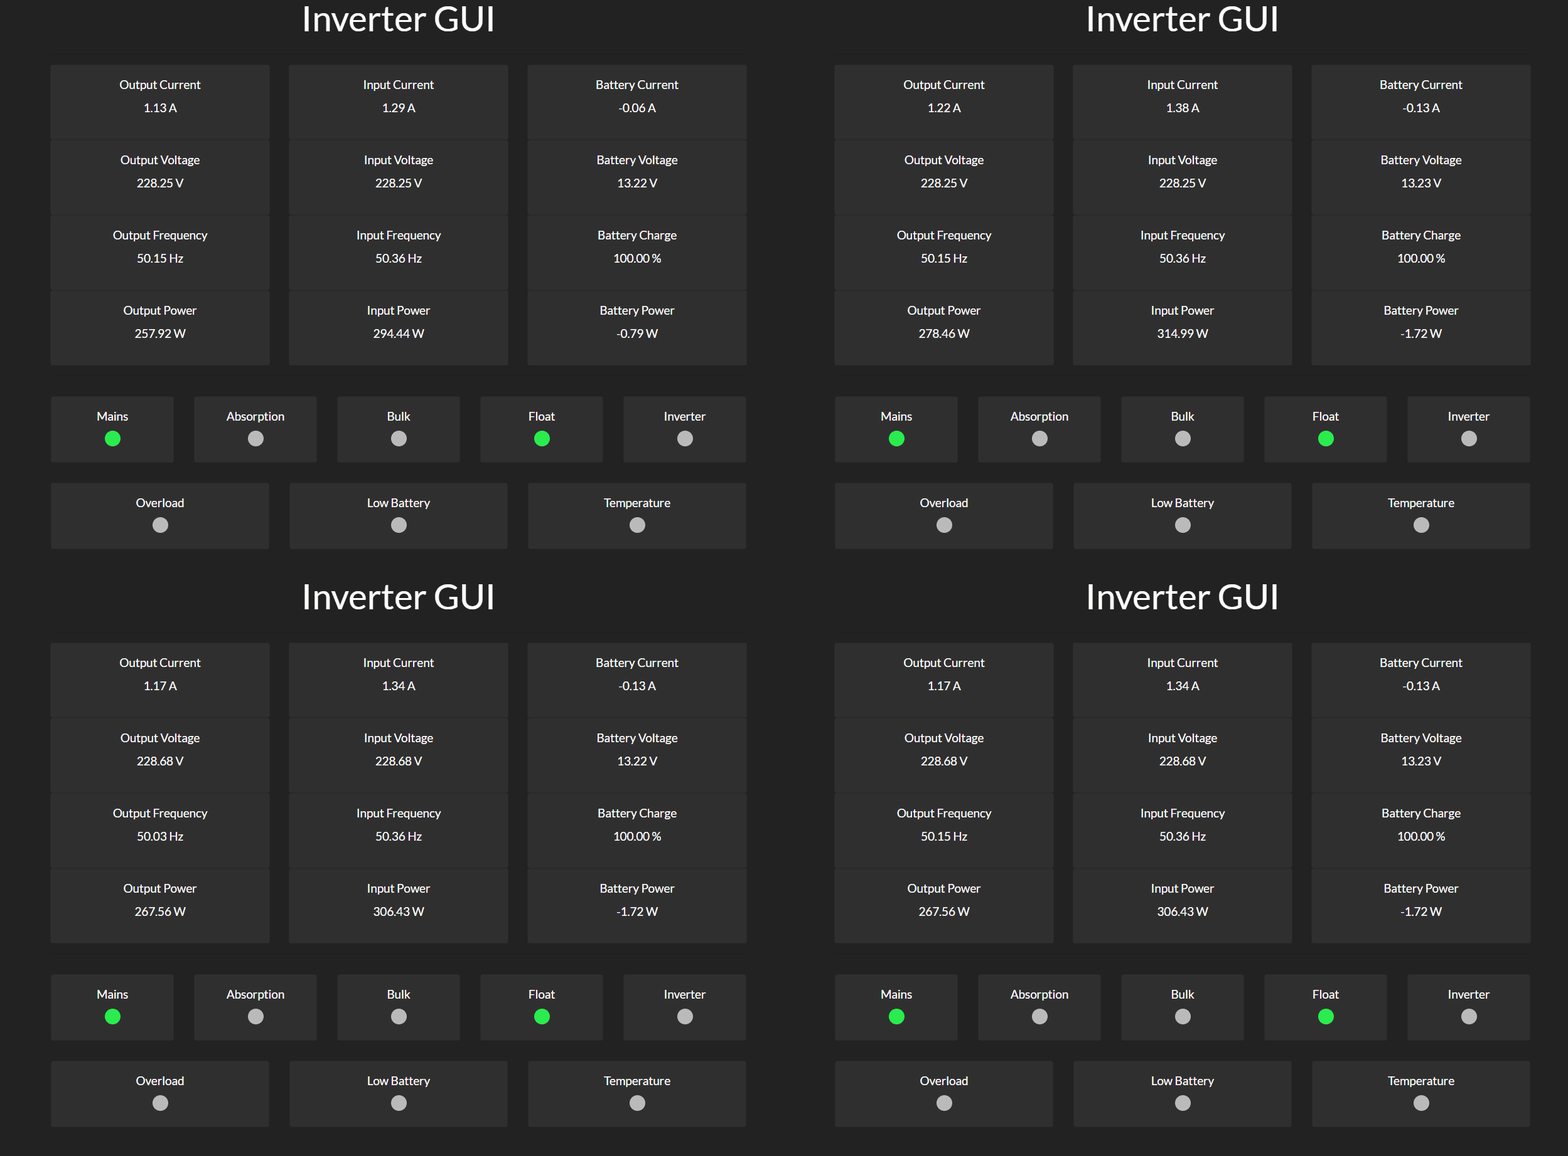
The invertergui allows the monitoring of a Victron Multiplus via the MK3/MK2 USB or the MK2 RS232.
The ghcr.io/diebietse/invertergui docker image is a build of this repository.
docker run --name invertergui --device /dev/ttyUSB0:/dev/ttyUSB0 -p 8080:8080 ghcr.io/diebietse/inverterguiThis project makes use of Go Modules. The minimum version for Go is 1.16
Usage:
  invertergui [OPTIONS]

Application Options:
      --address=        The IP/DNS and port of the machine that the application is running on. (default: :8080) [$ADDRESS]
      --data.source=    Set the source of data for the inverter gui. "serial", "tcp" or "mock" (default: serial) [$DATA_SOURCE]
      --data.host=      Host to connect when source is set to tcp. (default: localhost:8139) [$DATA_HOST]
      --data.device=    TTY device to use when source is set to serial. (default: /dev/ttyUSB0) [$DATA_DEVICE]
      --cli.enabled     Enable CLI output. [$CLI_ENABLED]
      --mqtt.enabled    Enable MQTT publishing. [$MQTT_ENABLED]
      --mqtt.broker=    Set the host port and scheme of the MQTT broker. (default: tcp://localhost:1883) [$MQTT_BROKER]
      --mqtt.client_id= Set the client ID for the MQTT connection. (default: interter-gui) [$MQTT_CLIENT_ID]
      --mqtt.topic=     Set the MQTT topic updates published to. (default: invertergui/updates) [$MQTT_TOPIC]
      --mqtt.username=  Set the MQTT username [$MQTT_USERNAME]
      --mqtt.password=  Set the MQTT password [$MQTT_PASSWORD]
      --loglevel=       The log level to generate logs at. ("panic", "fatal", "error", "warn", "info", "debug", "trace") (default: info) [$LOGLEVEL]

Help Options:
-h, --help Show this help messageThe default HTTP server port is hosted on port 8080. This exposes the HTTP server that hosts the:
- Web GUI
- Munin Plugin
- Prometheus Monitor
The GUI location is at the root (http://localhost:8080/) of the HTTP server.
Example output:
Date: Mon, 17 Dec 2018 18:14:51 +0000
LEDs:
Mains
Float
Output Current: 1.580 A
Output Voltage: 227.830 V
Output Frequency: 50.026 Hz
Output Power: 359.971 VA
Input Current: 1.750 A
Input Voltage: 227.830 V
Input Frequency: 50.103 Hz
Input Power: 398.703 VA
Input - Output Power: 38.731 VA

Battery Current: -0.050 A
Battery Voltage: 13.170 V
Battery Power: -0.659 W
Battery Charge: 100.000 %
The Munin plugin location is at /munin (http://localhost:8080/munin).
Example output:
multigraph in_batvolt
volt.value 13.154
multigraph in_batcharge
charge.value 100.000
multigraph in_batcurrent
current.value -0.092
multigraph in_batpower
power.value -1.209
multigraph in_mainscurrent
currentin.value 1.860
currentout.value 1.676
multigraph in_mainsvoltage
voltagein.value 225.786
voltageout.value 225.786
multigraph in_mainspower
powerin.value 419.945
powerout.value 378.372
multigraph in_mainsfreq
freqin.value 50.361
freqout.value 50.026
The Prometheus endpoint is at the default /metrics path (http://localhost:8080/metrics).
Sample Prometheus yaml entry:
- job_name: "victron"
  static_configs:
    - targets: ["localhost:8080"]
The metrics that are tracked:
# HELP battery_charge_percentage Remaining battery charge.
# TYPE battery_charge_percentage gauge
battery_charge_percentage 100
# HELP battery_current_a Battery current.
# TYPE battery_current_a gauge
battery_current_a -0.06
# HELP battery_power_w Battery power.
# TYPE battery_power_w gauge
battery_power_w -0.7896
# HELP battery_voltage_v Voltage of the battery.
# TYPE battery_voltage_v gauge
battery_voltage_v 13.16
# HELP go_gc_duration_seconds A summary of the GC invocation durations.
# TYPE go_gc_duration_seconds summary
go_gc_duration_seconds{quantile="0"} 5.3183e-05
go_gc_duration_seconds{quantile="0.25"} 0.000116
go_gc_duration_seconds{quantile="0.5"} 0.000156305
go_gc_duration_seconds{quantile="0.75"} 0.000313721
go_gc_duration_seconds{quantile="1"} 0.044886879
go_gc_duration_seconds_sum 0.394171418
go_gc_duration_seconds_count 58
# HELP go_goroutines Number of goroutines that currently exist.
# TYPE go_goroutines gauge
go_goroutines 8
# HELP go_info Information about the Go environment.
# TYPE go_info gauge
go_info{version="go1.11.3"} 1
# HELP go_memstats_alloc_bytes Number of bytes allocated and still in use.
# TYPE go_memstats_alloc_bytes gauge
go_memstats_alloc_bytes 3.21496e+06
# HELP go_memstats_alloc_bytes_total Total number of bytes allocated, even if freed.
# TYPE go_memstats_alloc_bytes_total counter
go_memstats_alloc_bytes_total 1.7361072e+08
# HELP go_memstats_buck_hash_sys_bytes Number of bytes used by the profiling bucket hash table.
# TYPE go_memstats_buck_hash_sys_bytes gauge
go_memstats_buck_hash_sys_bytes 1.451092e+06
# HELP go_memstats_frees_total Total number of frees.
# TYPE go_memstats_frees_total counter
go_memstats_frees_total 263807
# HELP go_memstats_gc_cpu_fraction The fraction of this program's available CPU time used by the GC since the program started.
# TYPE go_memstats_gc_cpu_fraction gauge
go_memstats_gc_cpu_fraction 0.00018297252897512647
# HELP go_memstats_gc_sys_bytes Number of bytes used for garbage collection system metadata.
# TYPE go_memstats_gc_sys_bytes gauge
go_memstats_gc_sys_bytes 2.37568e+06
# HELP go_memstats_heap_alloc_bytes Number of heap bytes allocated and still in use.
# TYPE go_memstats_heap_alloc_bytes gauge
go_memstats_heap_alloc_bytes 3.21496e+06
# HELP go_memstats_heap_idle_bytes Number of heap bytes waiting to be used.
# TYPE go_memstats_heap_idle_bytes gauge
go_memstats_heap_idle_bytes 6.2537728e+07
# HELP go_memstats_heap_inuse_bytes Number of heap bytes that are in use.
# TYPE go_memstats_heap_inuse_bytes gauge
go_memstats_heap_inuse_bytes 3.981312e+06
# HELP go_memstats_heap_objects Number of allocated objects.
# TYPE go_memstats_heap_objects gauge
go_memstats_heap_objects 5588
# HELP go_memstats_heap_released_bytes Number of heap bytes released to OS.
# TYPE go_memstats_heap_released_bytes gauge
go_memstats_heap_released_bytes 0
# HELP go_memstats_heap_sys_bytes Number of heap bytes obtained from system.
# TYPE go_memstats_heap_sys_bytes gauge
go_memstats_heap_sys_bytes 6.651904e+07
# HELP go_memstats_last_gc_time_seconds Number of seconds since 1970 of last garbage collection.
# TYPE go_memstats_last_gc_time_seconds gauge
go_memstats_last_gc_time_seconds 1.5450709952576678e+09
# HELP go_memstats_lookups_total Total number of pointer lookups.
# TYPE go_memstats_lookups_total counter
go_memstats_lookups_total 0
# HELP go_memstats_mallocs_total Total number of mallocs.
# TYPE go_memstats_mallocs_total counter
go_memstats_mallocs_total 269395
# HELP go_memstats_mcache_inuse_bytes Number of bytes in use by mcache structures.
# TYPE go_memstats_mcache_inuse_bytes gauge
go_memstats_mcache_inuse_bytes 3456
# HELP go_memstats_mcache_sys_bytes Number of bytes used for mcache structures obtained from system.
# TYPE go_memstats_mcache_sys_bytes gauge
go_memstats_mcache_sys_bytes 16384
# HELP go_memstats_mspan_inuse_bytes Number of bytes in use by mspan structures.
# TYPE go_memstats_mspan_inuse_bytes gauge
go_memstats_mspan_inuse_bytes 27208
# HELP go_memstats_mspan_sys_bytes Number of bytes used for mspan structures obtained from system.
# TYPE go_memstats_mspan_sys_bytes gauge
go_memstats_mspan_sys_bytes 32768
# HELP go_memstats_next_gc_bytes Number of heap bytes when next garbage collection will take place.
# TYPE go_memstats_next_gc_bytes gauge
go_memstats_next_gc_bytes 4.194304e+06
# HELP go_memstats_other_sys_bytes Number of bytes used for other system allocations.
# TYPE go_memstats_other_sys_bytes gauge
go_memstats_other_sys_bytes 775332
# HELP go_memstats_stack_inuse_bytes Number of bytes in use by the stack allocator.
# TYPE go_memstats_stack_inuse_bytes gauge
go_memstats_stack_inuse_bytes 589824
# HELP go_memstats_stack_sys_bytes Number of bytes obtained from system for stack allocator.
# TYPE go_memstats_stack_sys_bytes gauge
go_memstats_stack_sys_bytes 589824
# HELP go_memstats_sys_bytes Number of bytes obtained from system.
# TYPE go_memstats_sys_bytes gauge
go_memstats_sys_bytes 7.176012e+07
# HELP go_threads Number of OS threads created.
# TYPE go_threads gauge
go_threads 10
# HELP mains_current_in_a Mains current flowing into inverter
# TYPE mains_current_in_a gauge
mains_current_in_a 2.17
# HELP mains_current_out_a Mains current flowing out of inverter
# TYPE mains_current_out_a gauge
mains_current_out_a 2
# HELP mains_freq_in_hz Mains frequency at inverter input
# TYPE mains_freq_in_hz gauge
mains_freq_in_hz 50.36082474226804
# HELP mains_freq_out_hz Mains frequency at inverter output
# TYPE mains_freq_out_hz gauge
mains_freq_out_hz 50.153452685421996
# HELP mains_power_in_va Mains power in
# TYPE mains_power_in_va gauge
mains_power_in_va 491.6352
# HELP mains_power_out_va Mains power out
# TYPE mains_power_out_va gauge
mains_power_out_va 453.12
# HELP mains_voltage_in_v Mains voltage at input of inverter
# TYPE mains_voltage_in_v gauge
mains_voltage_in_v 226.56
# HELP mains_voltage_out_v Mains voltage at output of inverter
# TYPE mains_voltage_out_v gauge
mains_voltage_out_v 226.56
# HELP process_cpu_seconds_total Total user and system CPU time spent in seconds.
# TYPE process_cpu_seconds_total counter
process_cpu_seconds_total 39.73
# HELP process_max_fds Maximum number of open file descriptors.
# TYPE process_max_fds gauge
process_max_fds 1.048576e+06
# HELP process_open_fds Number of open file descriptors.
# TYPE process_open_fds gauge
process_open_fds 8
# HELP process_resident_memory_bytes Resident memory size in bytes.
# TYPE process_resident_memory_bytes gauge
process_resident_memory_bytes 1.2742656e+07
# HELP process_start_time_seconds Start time of the process since unix epoch in seconds.
# TYPE process_start_time_seconds gauge
process_start_time_seconds 1.54506833485e+09
# HELP process_virtual_memory_bytes Virtual memory size in bytes.
# TYPE process_virtual_memory_bytes gauge
process_virtual_memory_bytes 1.15101696e+08
The MQTT client will publish updates to the given broker at the set topic.
--mqtt.enabled    Enable MQTT publishing. [$MQTT_ENABLED]
--mqtt.broker=    Set the host port and scheme of the MQTT broker. (default: tcp://localhost:1883) [$MQTT_BROKER]
--mqtt.client_id= Set the client ID for the MQTT connection. (default: interter-gui) [$MQTT_CLIENT_ID]
--mqtt.topic=     Set the MQTT topic updates published to. (default: invertergui/updates) [$MQTT_TOPIC]
--mqtt.username=  Set the MQTT username [$MQTT_USERNAME]
--mqtt.password=  Set the MQTT password [$MQTT_PASSWORD]
The MQTT client can be enabled by setting the environment variable MQTT_ENABLED=true or flag --mqtt.enabled.
All MQTT configuration can be done via flags or as environment variables.
The URI for the broker can be configured format should be scheme://host:port, where "scheme" is one of "tcp", "ssl", or "ws".
The intertergui application makes use of a serial tty device to monitor the Multiplus.
Example
-dev=/dev/ttyUSB0
The following configuration works for Nginx to allow the invertergui to be proxied.
When using a stand HTTP or HTTPS port to expose the gui:
	location /invertergui {
		return 302 /invertergui/;
	}

	location /invertergui/ {
		proxy_pass http://localhost:8080/;
		proxy_set_header Host $host;
	}

	location /invertergui/ws {
		proxy_pass http://localhost:8080/ws;
		proxy_http_version 1.1;
		proxy_set_header Upgrade $http_upgrade;

		proxy_set_header Connection "upgrade";
		proxy_read_timeout 86400;
		proxy_set_header Host $host;

		proxy_set_header Referer $http_referer;
		proxy_set_header X-Forwarded-For $remote_addr;
		proxy_set_header X-Forwarded-Proto $scheme;
		proxy_set_header X-Forwarded-Port $server_port;
	}
When using a non-stand HTTP or HTTPS port to expose the gui change the HTTP Host description:
proxy_set_header Host $host:$server_port;The last four lines are optional, but is useful when debugging and logging connections:
		proxy_set_header Referer $http_referer;
		proxy_set_header X-Forwarded-For $remote_addr;
		proxy_set_header X-Forwarded-Proto $scheme;
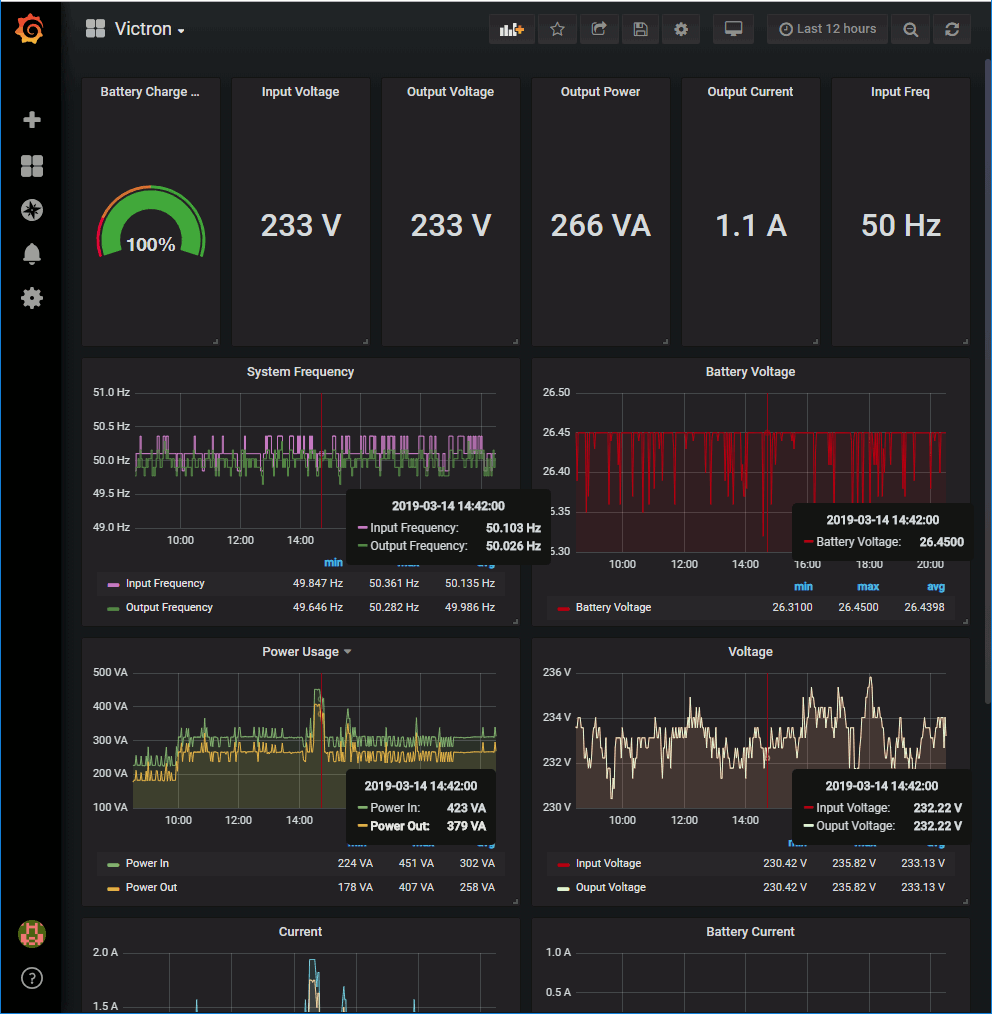
proxy_set_header X-Forwarded-Port $server_port;This repos includes a Grafana dashboard in the grafana folder that you can import. This is useful if you are using prometheus to log your data and want to display it in a nice way.


