This native Godot extension embeds GNUPlot command line into the game engine by exploiting GNUPlot's flexibility for declaring custom graphical output terminals. You can create static or dynamic plots for games or GUI applications and it does not require GNUPlot executable. Plots can be embedded into 3D world by using sub viewports. It can plot custom dataframes defined in scripts. Also, you can provide a PackedFloat64Array as dataframe which is a more performant method. Please, see examples in demo folder.
I created a custom graphical terminal named by gdmp.trm which redirects GNUPlot's drawing calls to Godot's CanvasItem drawing methods. gdmp.trm is based on SVG terminal implemented in gnuplot/term/svg.trm. The common method to embed GNUPlot into an application is running it as a separate process and communicating through an Inter Process Communication (IPC) method. However, I came up with a hack to embed it into the plugin itself as a separate shared library after some tedious work. GDMP terminal and mentioned hack can be found in gdmatplot-gnuplot.patch.
The main issue that can not be solved programmatically is handling the global program state used by GNUPlot while drawing multiple plots concurrently. The common method to load a shared library on Linux is reading it by dlopen. If you load the same dynamic library with dlopen several times all symbols will be allocated at the same memory address (similar to global variables in the same namespace) in the application. Changing a global symbol in a plot will effect the others and cause race conditions in a threaded application. GNU linker on Linux provides a function called dlmopen which overcomes this problem up to a point by separating subsequent library loads into separate memory regions. However, it supports a maximum of 16 different namespaces and it is not a multiplatform solution. After some research and trial-error, found that fooling the dynamic library loader by changing dynamic library file name each time before loading makes the loader create separate GNUPlot instances. This method seems like working for both Linux and Windows.
Build steps of GNUPlot is declared in SConscript. It first compiles GNUPlot source as a shared library, then dumps it into a C array to be packed in GDMatPlot extension. The C array written to a '.so' or '.dll' file to be read by dynamic library loader and deleted afterwards.
As explained above, this software is based on a hack that drags it into a indefinitely long beta stage despite it is based on GNUPlot's 6.0.0 release. In the tests provided in demo projects, I didn't experience illegal memory access or memory leak. However, it is not easy to cover all code paths. Users of this library should notice the comments below.
- Dashed plot types is not working
- Unicode text is not working
- Can not change font family by using GNUPlot font commands
- Arrow plots are not working
- Spider plots are not working
- Command line breaks by using backslash character is not working
- Clean termination after error is not working
- Z-ordering of line segments in 3D plots is not working
- Can not load dataframes from files, GNUPlot's I/O functionality is disabled
You should first test your sequence of GNUPlot commands on an original build with version number '6.0.0' by selecting svg terminal as the graphical output option and make sure it does not emit warning or error messages. Providing erroneous commands to GDMatPlot may cause SEGFAULT or memory leaks.
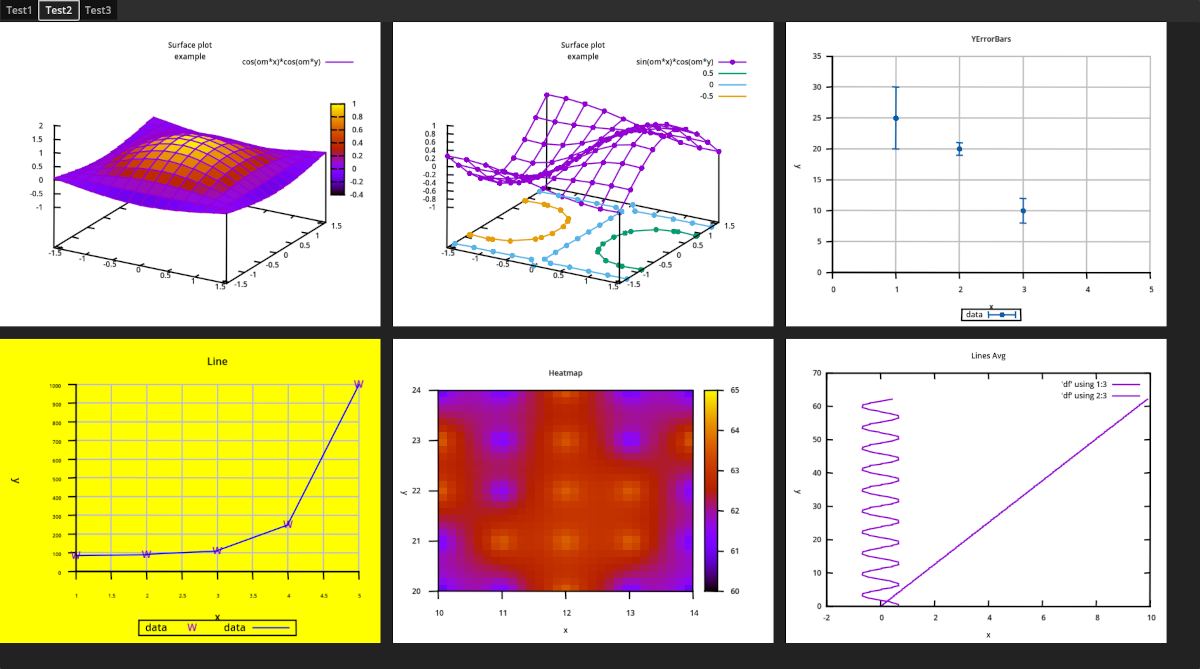
It includes several test plots which utilizes a large aspect of GNUPlot of functionality. A test view is shown below.
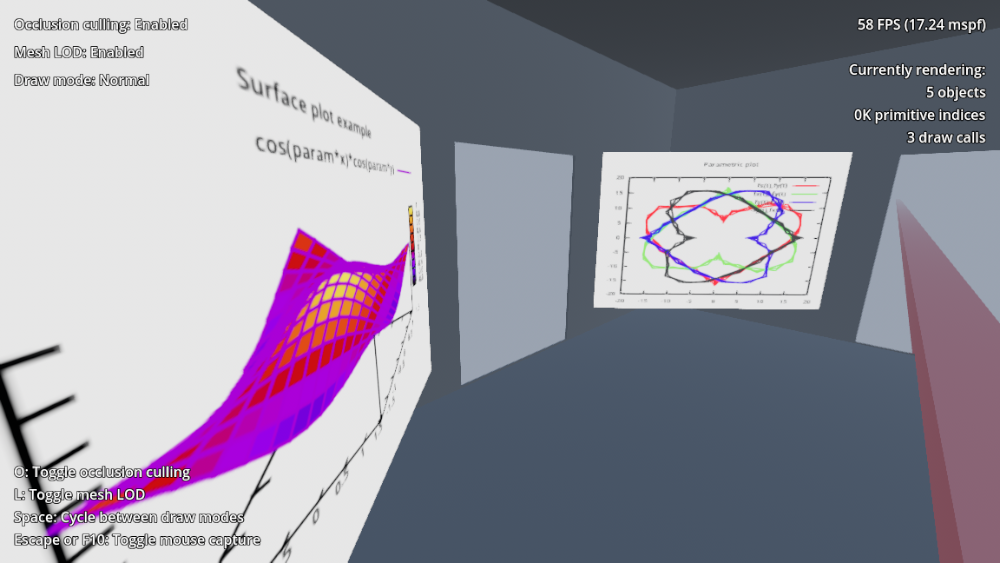
In this demo, similar test plots are embedded into 3D game world by using subviewports.
demo3d_screencast.mp4
Base class of GDMatPlot derived from Node2D.
draw_plot(): OverridesNode2D_drawmethod. See the example below for its usage.load_gnuplot(p_path: String = "user://libgnuplot.so"): Loads GNUPlot shared library by usingp_pathas a temporary loading location. This function must be called initially, preferably in_ready()method. It returns0on success, a negative value on error. Note that, if there is already a file atp_path, it will be overwritten.
| This function creates 2MB sized temporary file when called. It is better not to call it frequently. |
|---|
run_command(p_cmd: String): Redirectsp_cmdto GNUPlot's command line parser.set_dataframe(p_data: PackedFloat64Array, p_column_count: int): Set dataframe to be parsed and plotted.p_datais assumed to be in row major format and its size must be divisible byp_column_count. Imitates GNUPlot's numeric dataframe loading from a text file.
var df: PackedFloat64Array = PackedFloat64Array([ 1, 2, 3, 4, 5, 6, 7... ])
set_dataframe(df, 3)
# This will be interpreted by GNUPlot as
# Column index: 1   2   3
# -------------------------
#               1   2   3
#               4   5   6
#               7   .   .
# Check gnuplot documentation and examples how to plot dataframe columnsload_dataframe(): Reset dataframe parser's internal state. It should be called at the beginning of each draw call.start_renderer(p_loop_func: Callable): GNUplot command parser and renderer should be run in a separate thread beacuse it introduces an easily recognizable performance decrease. You should callrun_commandin the renderer loop functionp_loop_func.stop_renderer(): Stops renderer thread.set_rendering_period(p_loop_period: int): Set the time rate of callingp_loop_funcdefined bystart_renderer. The unit ofp_loop_periodis milliseconds.
transparency: float: Sets plot's background transparency.antialiasing: bool: Enable/disable antialiased line drawing.
Since version 0.2.0 GDMatPlot imposes a specific programming pattern because GNUPlot's command parsing and rendering add an overhead which does not fit the performace requirements of a game engine. Instead of directly drawing the results of run_command in _draw function, run_command it is called in a renderer loop which is called in a separate thread. In the renderer thread GNUPlot processes commands and generates draw line, polygon, point etc. calls which are encoded in an efficient data structure. Then, a new draw call is queued by calling queue_redraw as shown in the example below. When new drawing triggered, encoded draw calls are decoded and converted to CanvasItems draw_polyline, draw_polygon, etc. calls. This method cancels the negative effect of GNUPlot's command parsing on the frame rate (FPS).
extends GDMatPlotNative

var dataframe: PackedFloat64Array
var lib_loaded: bool = false
var figure_size: Vector2i = Vector2i(640, 480)
var renderer_period: int = 100
var update_df_period: float = 0.1
var col_count: int = 4
var sample_count: int = 100
# Protect access to dataframe from GNUPlot renderer thread
var df_lock: Mutex = Mutex.new()
func _ready():
	transparency = 0.75 # Set plot's transparency
	antialiasing = true # Enable antialized lines
	dataframe.resize(sample_count)
	for i in range(0, sample_count, col_count):
		var x: float = i - sample_count / 2.0
		dataframe[i+0] = x # 1st column of dataframe
		dataframe[i+1] = x / pow(sample_count / 2.0, 1) # 2nd column
		dataframe[i+2] = x * x / pow(sample_count / 2.0, 2) # 3rd column
		dataframe[i+3] = x * x * x / pow(sample_count / 2.0, 3) # 4th column

	var error: int = load_gnuplot()
	if error == 0:
		lib_loaded = true
		set_dataframe(dataframe, col_count) # 4 columns 100/4 = 25 rows
		start_renderer(_draw_commands)
		set_rendering_period(renderer_period)

func _draw_commands():
	if lib_loaded:
		df_lock.lock()
		load_dataframe()
		df_lock.unlock()
		"""GNUPlot commands"""
		run_command("set terminal gdmp size %d,%d" % [figure_size.x, figure_size.y])
		run_command("set grid on")
		# 'df' is a placeholder, it can be any alphanumeric string.
		run_command("plot 'df' using 1:2 with lines, 'dfasd' using 1:3 with lines, 'df' using 1:4 with lines")

func update_dataframe():
	# ... process dataframe ...#
	for i in range(sample_count):
		dataframe[i] *= 0.99
	if lib_loaded:
		df_lock.lock()
		set_dataframe(dataframe, col_count)
		df_lock.unlock()

"""
You don't need to define _draw function. GDMatPlotNative overrides it
and draw_plot will be autmatically called. You should define _draw here
if you want to draw some other stuff (e.g. an image) before and after draw_plot.
"""
func _draw():
	# draw some stuff behind the plot
	draw_circle(Vector2(), 250, Color.AQUA)
	if lib_loaded:
		draw_plot()
	# draw other stuff over the plot
	draw_circle(figure_size, 250, Color(0.0, 0.2, 0.0, 0.5))

var some_condition: bool = false
var total_time: float = 0.0
"""
You should call `queue_redraw` manually after an event or at a desired period.
Otherwise, plot will not be redrawn.
"""
func _process(delta):
	if total_time > update_df_period:
		update_dataframe()
		queue_redraw()
		total_time = 0
	total_time += delta
	if lib_loaded and some_condition:
		# Pause renderer when ever you want by setting a very large period.
		set_rendering_period(1000000000)
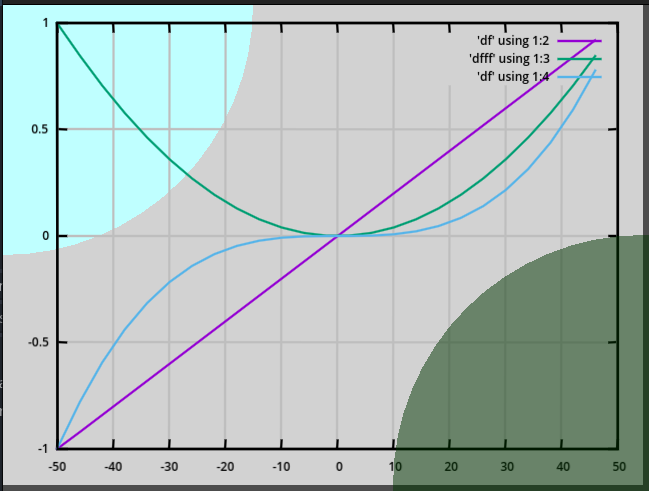
Output of the script:
Currently, it can be built on a Linux host. Building the Windows release requires MinGW 12.2.0 or newer.
git clone https://github.com/dmrokan/gdmatplot.git
cd gdmatplot
git submodule update --init --recursive
scons -f SConscript platform='<linux|windows>'
cd godot_cpp
scons target='<template_debug|template_release>' platform='<linux|windows>' arch='x86_64'
cd ..
scons target='<template_debug|template_release>' platform='<linux|windows>' arch='x86_64'
You can visit Godot's build system documentation for more information.


