- GoingViral will deliver beautiful graphic visualizations of Coronaivrus data from the CDC concerning each state within the U.S. It is imporantant that this data be easily available and engaging. I hope to compare other pandemics to COVID-19.
The first version will simply implement certain graphs/charts with interesting graphical flow and interchanges between data sets.
- MVP1: create a splash page with a clickable picture of COVID-19 virus which brings you to the next page with the graphs.
- MVP2: implement a carousel sidebar with a list of all U.S. states to click on.
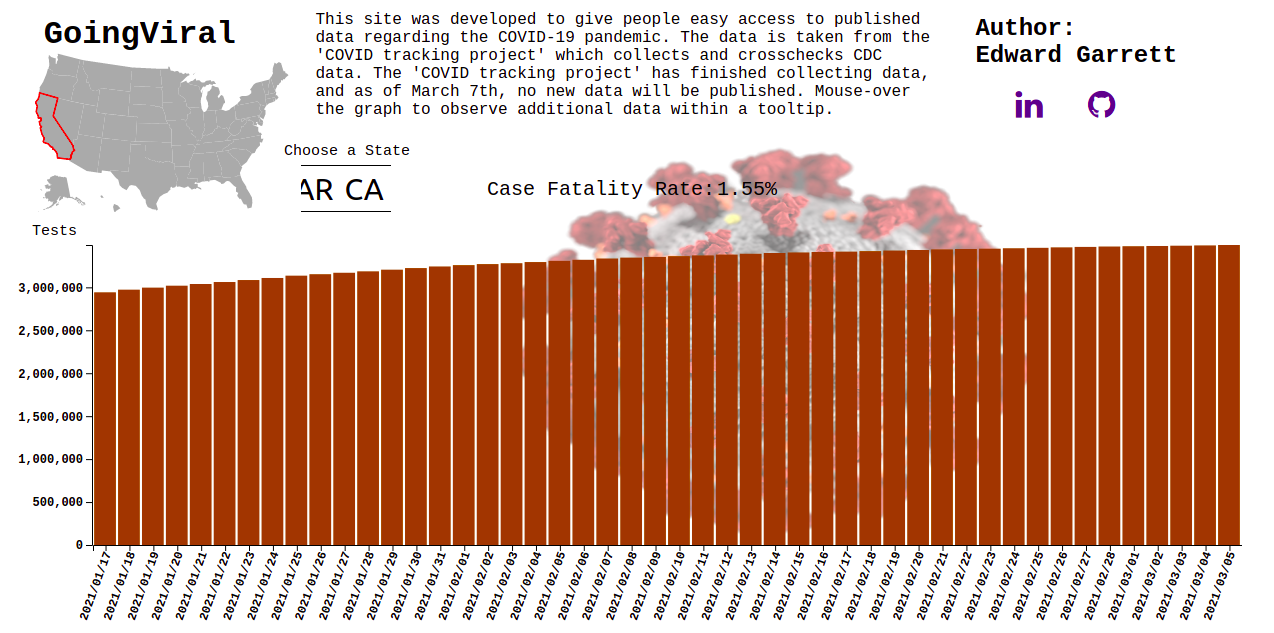
- MVP3: see a graph showing population, time, number tested, number positive, and number deceased.
- MVP4: Make the bars pop up/appear in a flowing manner and flow gracefully into other data sets.
- BONUS: integrate other viruses which will require different API
- I will using JS and D3 to create the graphical transitions, and html and scss to style and structure the DOM. Webpack will be used as the bundler and babel as the transpiler.
- Day 1: Monday Aug 17 Have something showing up on the screen such as the COVID-19 picture.
- Day 2: Tuesday Aug 18 Create the graphs with the data from the CDC
- Day 3: Wednesday Aug 19 Add transitional graphics between and during interaction with data sets.
- Day 4: Thursday Aug 20 Create the carousel component to scroll through list of states
- Day 5: Friday Aug 21 Tie up loose ends with styling and functionality or begin on bonus MVP.