Off-the-shelf method for determining the optimal singular value truncation (hard threshold) for matrix denoising.
The method gives the optimal location both in the case of the known or unknown noise level.

Create some data:
import numpy as np
import scipy as sci
import matplotlib.pyplot as plt
from optht import optht

t = np.arange(-2,2, 0.01)

Utrue = np.array(( [np.cos(17*t) * np.exp(-t**2) , np.sin(11*t)] )).T
Strue = np.array(( [2, 0], [0, .5] ))
Vtrue = np.array(( [np.sin(5*t) * np.exp(-t**2) , np.cos(13*t)] )).T

# construct image
X = Utrue.dot(Strue).dot(Vtrue.T)

# define the noise level and add
sigma = 0.5
X_noisy = X + sigma * np.random.standard_normal(X.shape)
Compute the singular value decomposition (SVD):
U, s, Vh = np.linalg.svd(X_noisy, full_matrices=False)Determine optimal hard threshold and reconstruct image
k = optht(X_noisy, sv=s, sigma=None)
X_denoised = (U[:, range(k)] * s[range(k)]).dot(Vh[range(k),:])
Plot the results:
plt.subplot(131)
plt.imshow(X, cmap='gray', interpolation='bicubic')
plt.title('Original image')
plt.axis('off')

plt.subplot(132)
plt.imshow(X_noisy, cmap='gray', interpolation='bicubic')
plt.title('Noisy image, sigma=%s' % sigma)
plt.axis('off')

plt.subplot(133)
plt.imshow(X_denoised, cmap='gray', interpolation='bicubic')
rmseSVD = np.sqrt(np.sum( ( X - X_denoised )**2 ) / np.sum(X**2))
plt.title('Denoised image,  nrmse=%s ' % np.round(rmseSVD, 2))
plt.axis('off')
plt.show()
Plot the singular value spectrum:
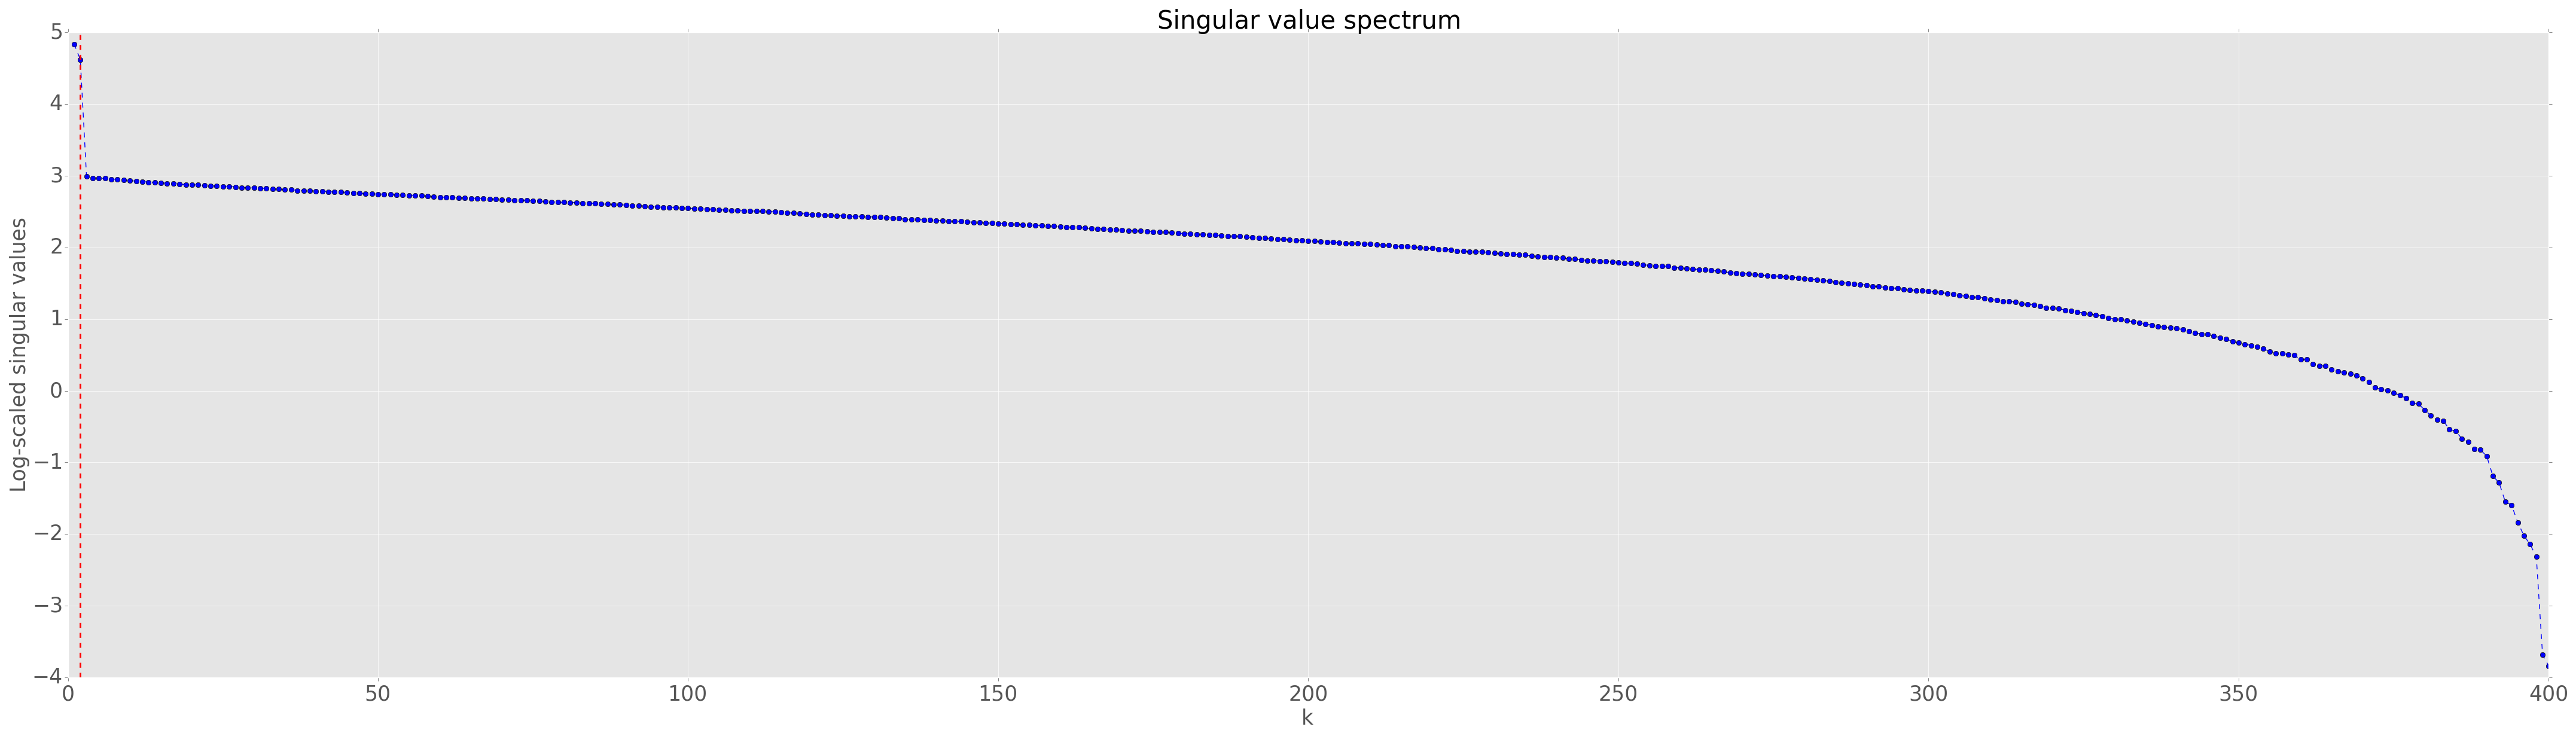
plt.plot( (np.arange(1,s.shape[0]+1)), np.log(s), c='b', marker='o', linestyle='--')
plt.xlabel('k', fontsize=25)
plt.ylabel('Log-scaled singular values')
plt.tick_params(axis='x')
plt.tick_params(axis='y')
plt.title('Singular value spectrum')
plt.axvline(k, c='r', linewidth=2, linestyle='--')
plt.show()- Thanks to Steven Dahdah for refactoring the code into a Python package.
- Thanks to Bill Tubbs for style edits and a few typo corrections.
- Thanks to @nish-ant for adding fixes to make the code Python 3 compatible.
- Code is adapted from Matan Gavish and David L. Donoho, see [1]. Corresponding MATLAB code can be found here
[1] Gavish, Matan, and David L. Donoho. "The optimal hard threshold for singular values is 4/sqrt(3)" IEEE Transactions on Information Theory 60.8 (2014): 5040-5053. http://arxiv.org/abs/1305.5870