Skip to content
View frankraDIUM's full-sized avatar
💭
To be or not to be?
💭
To be or not to be?

Block or report frankraDIUM

Block user

Prevent this user from interacting with your repositories and sending you notifications. Learn more about blocking users.

You must be logged in to block users.

Maximum 250 characters. Please don't include any personal information such as legal names or email addresses. Markdown supported. This note will be visible to only you.
Report abuse

Contact GitHub support about this user’s behavior. Learn more about reporting abuse.

Report abuse
frankraDIUM/README.md

🌍 Hi there, I'm Frank 👋

Data | Geospatial Data | Machine Learning | Software Development | Cloud (AWS.GCP)

About Me

At the intersection of data analysis, spatial analysis, data science, spatial data science, machine learning, and software development, transforming complex data into meaningful insights and applications.


Projects

SEE HERE 👉 View


Technical Toolkit

Geospatial & Data Analysis

ArcGIS Pro QGIS PostgreSQL ENVI Leaflet eCognition Google Earth

Programming & Development

Python SQL JavaScript TypeScript HTML5 CSS3 C Flask Android

Data Science & Visualization

Pandas R Power BI Jupyter SPSS

Tools & Platforms

AWS Git VS Code Google Colab Google Cloud

“Turning raw data into meaningful insights and maps that matter.”
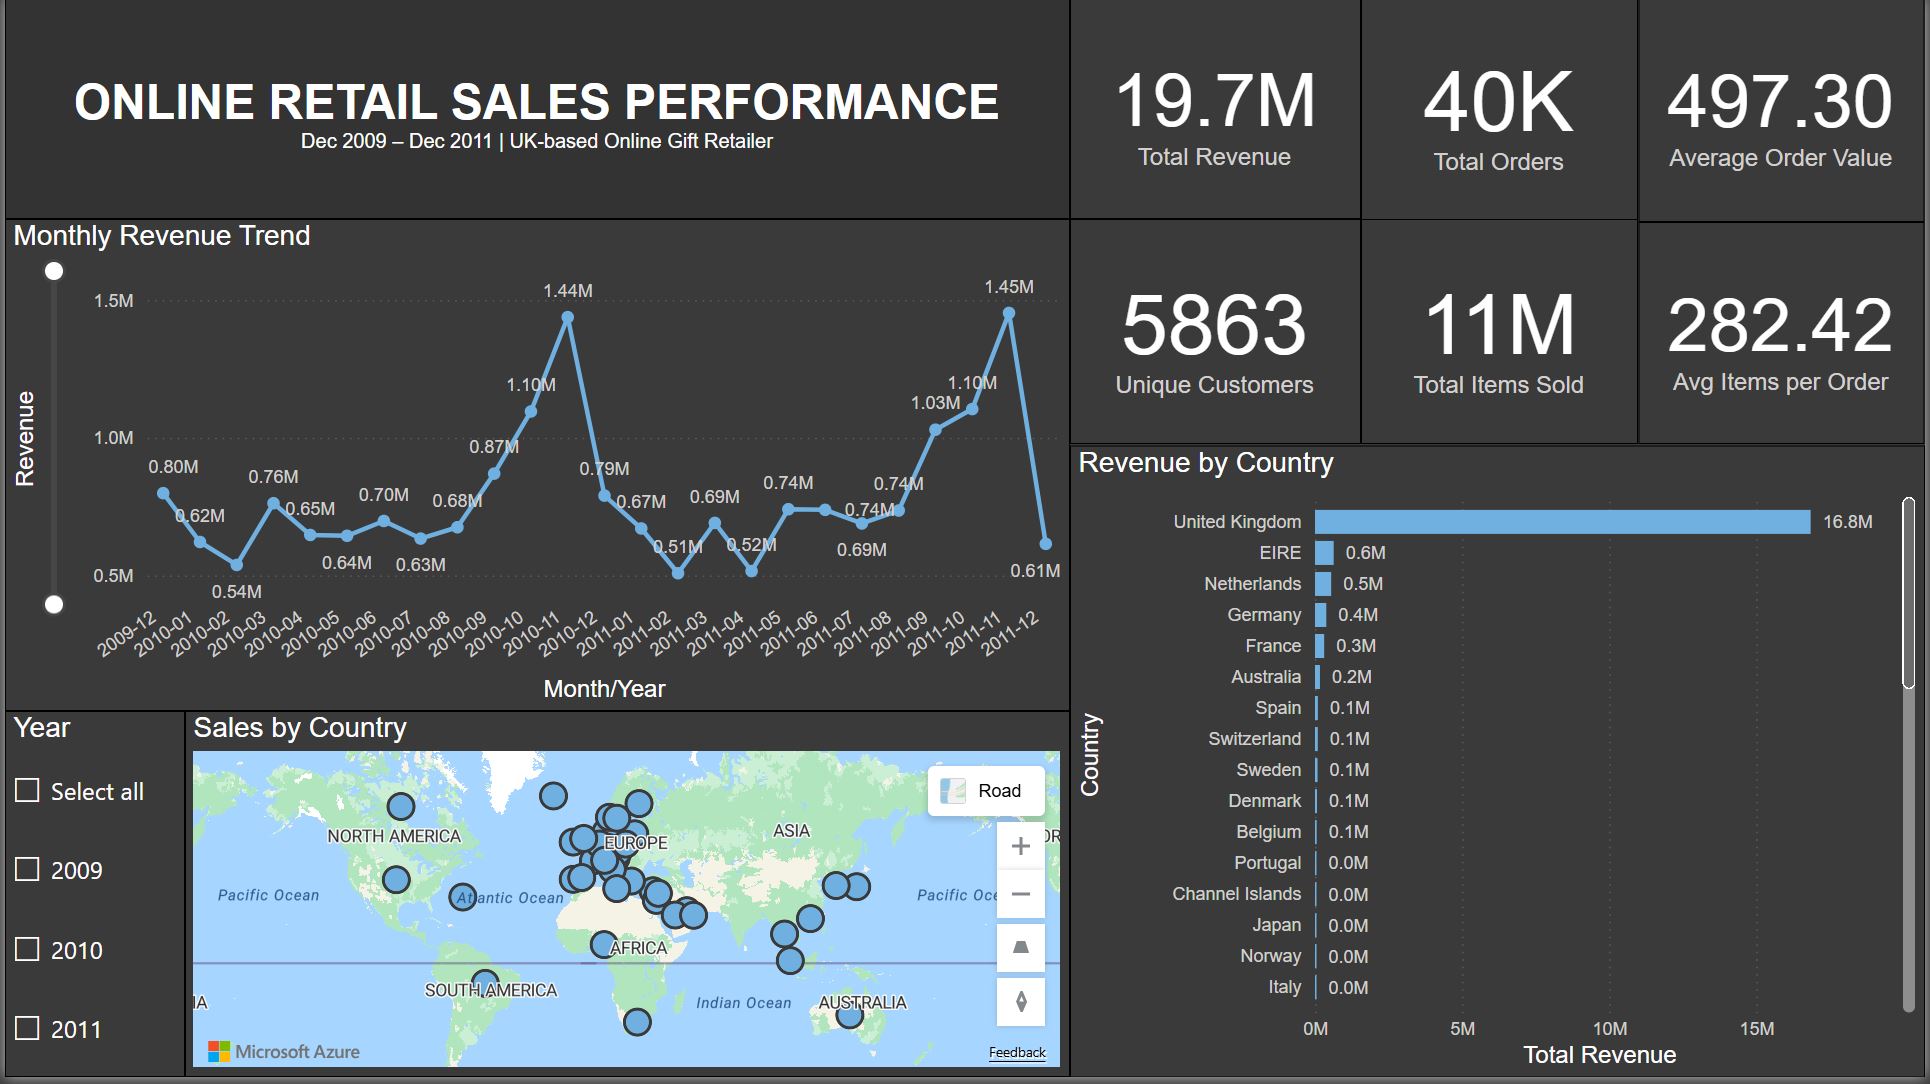
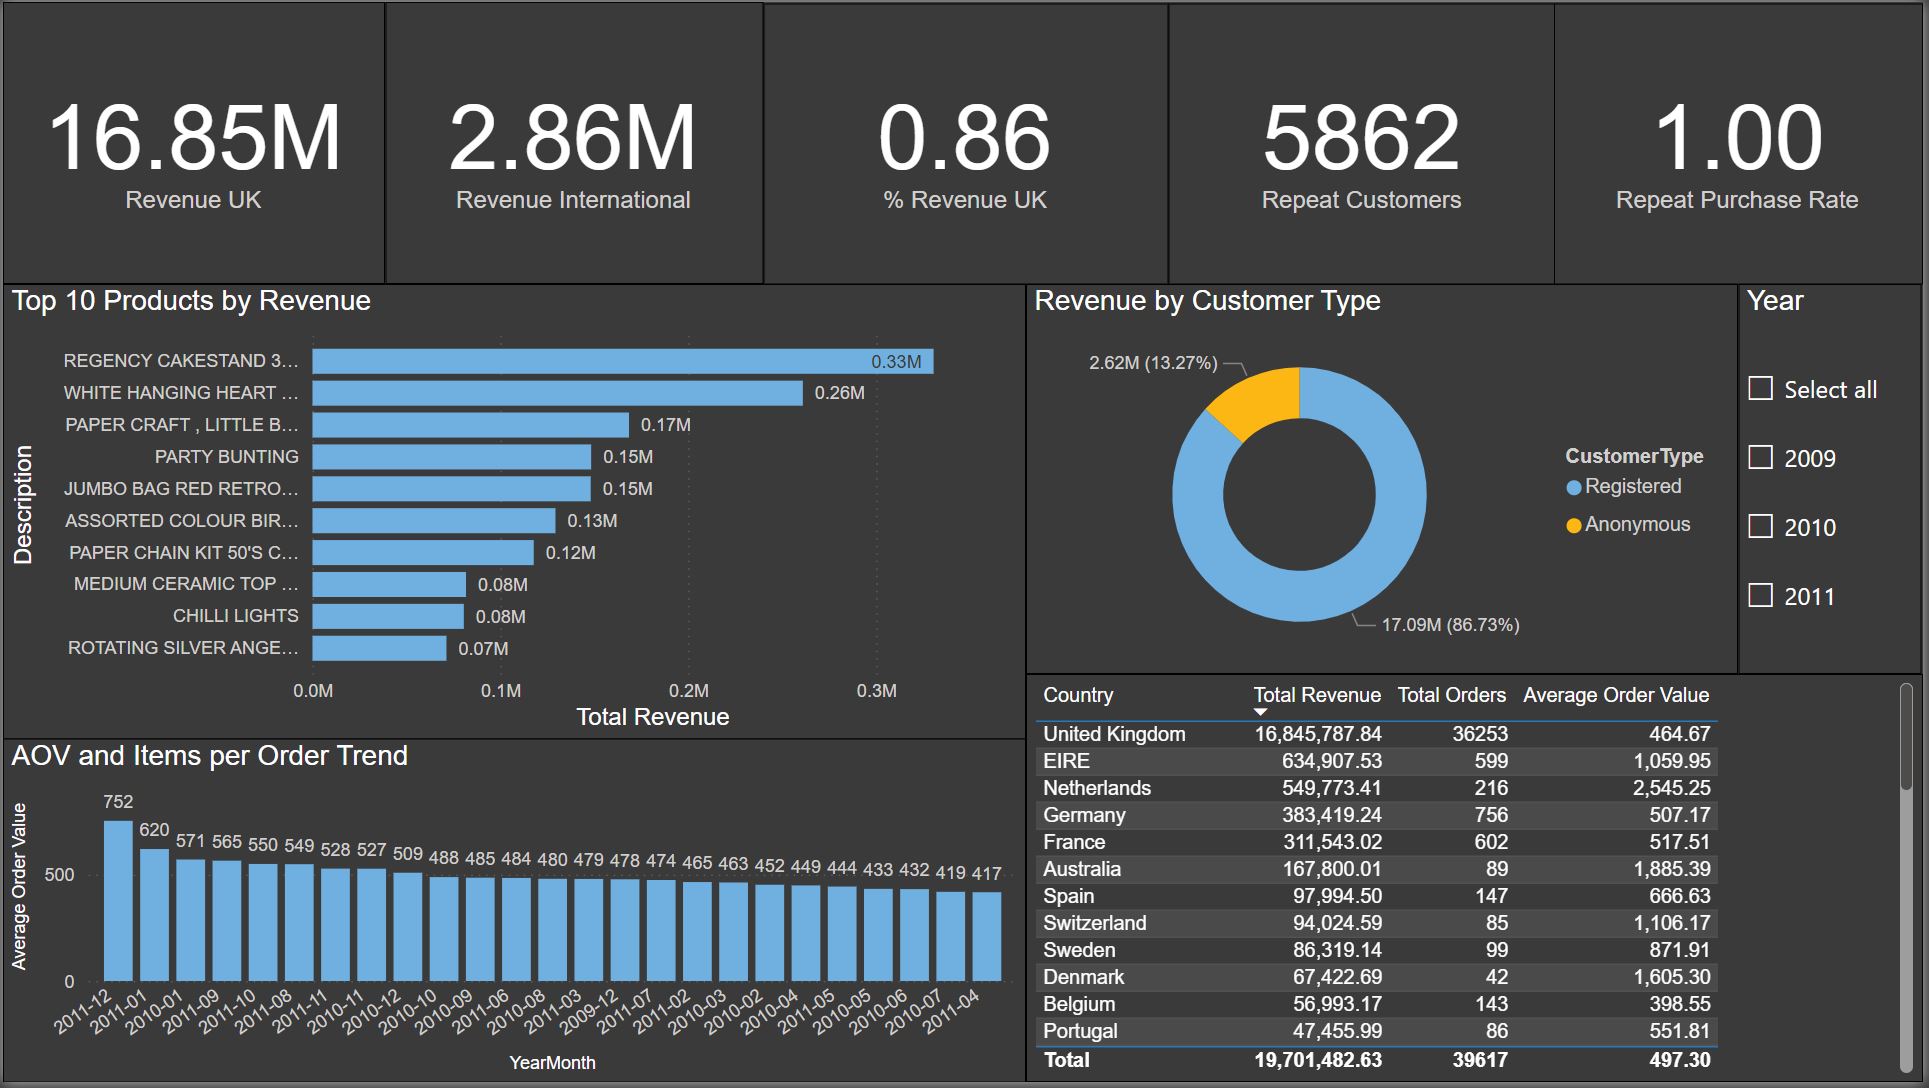
Data


ML


Spatial Data


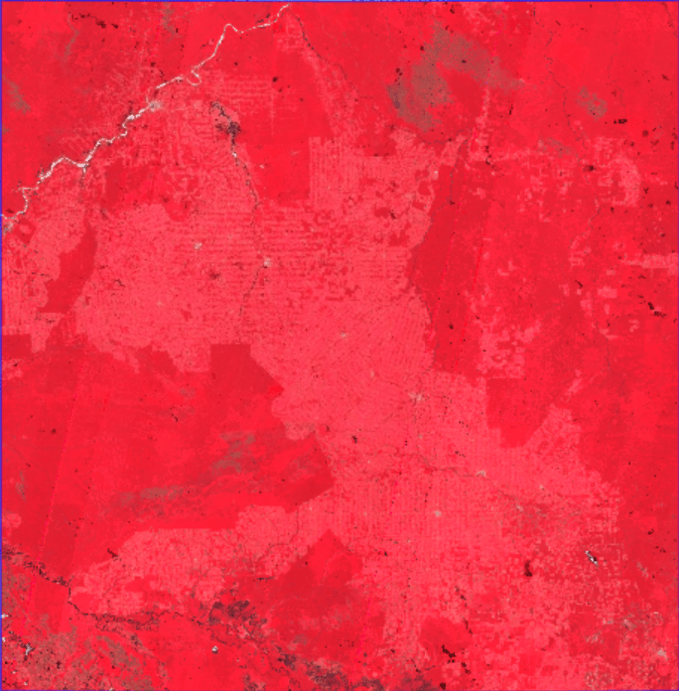
Animated Change (Deforestation Hotspots)

Pinned Loading

  1. Stock-Market-Clustering-ML Stock-Market-Clustering-ML Public

    Analyzing the movement patterns of 60 major companies from 2010–2015 to identify hidden industry relationships using machine learning.

    Jupyter Notebook

  2. Automated-GIS-ML-System-for-Water-Infrastructure-Risk-in-Kenya Automated-GIS-ML-System-for-Water-Infrastructure-Risk-in-Kenya Public

    This project builds an automated, end-to-end GIS and machine learning pipeline to analyze water point infrastructure risk across Kenya, with a focused application in Nairobi County.

    Jupyter Notebook

  3. Transit-Accessibility-Analysis-in-New-York-City Transit-Accessibility-Analysis-in-New-York-City Public

    This project analyzes walking-based access to subway entrances, generates 10- and 15-minute walking isochrones, and identifies transit deserts,census tracts where subway access exceeds a realistic …

    Python

  4. Amazon-Deforestation-Monitoring-Sub-Region-Analysis-Rondonia-Hotspot- Amazon-Deforestation-Monitoring-Sub-Region-Analysis-Rondonia-Hotspot- Public

    Monitor vegetation change and detect potential deforestation using Sentinel-2 imagery and NDVI difference over a ~300,000 km² sub-region in the Brazilian Amazon (southern Rondônia / northern Mato G…

    JavaScript

  5. Urban-Heat-Inequality-in-Los-Angeles-with-GEE-and-PostGIS Urban-Heat-Inequality-in-Los-Angeles-with-GEE-and-PostGIS Public

    This project investigates urban heat inequality in Los Angeles County using geospatial data and PostGIS/SQL.

    JavaScript

  6. Online-Retail-Sales-Performance-Dashboard Online-Retail-Sales-Performance-Dashboard Public

    A comprehensive Power BI dashboard built from the UCI Online Retail II dataset, providing executive overview, operational analysis, and strategic customer insights.