-
Notifications
You must be signed in to change notification settings - Fork 1
Data Types
The following section will describe each data type that Germinate can handle in more detail. We will describe both the web interface that is used to display this data as well as what the export formats for each of the types are.
The core data of Germinate evolves around accessions and their passport data. Passport data can be described as the sum of all meta-data that relates to the accession.

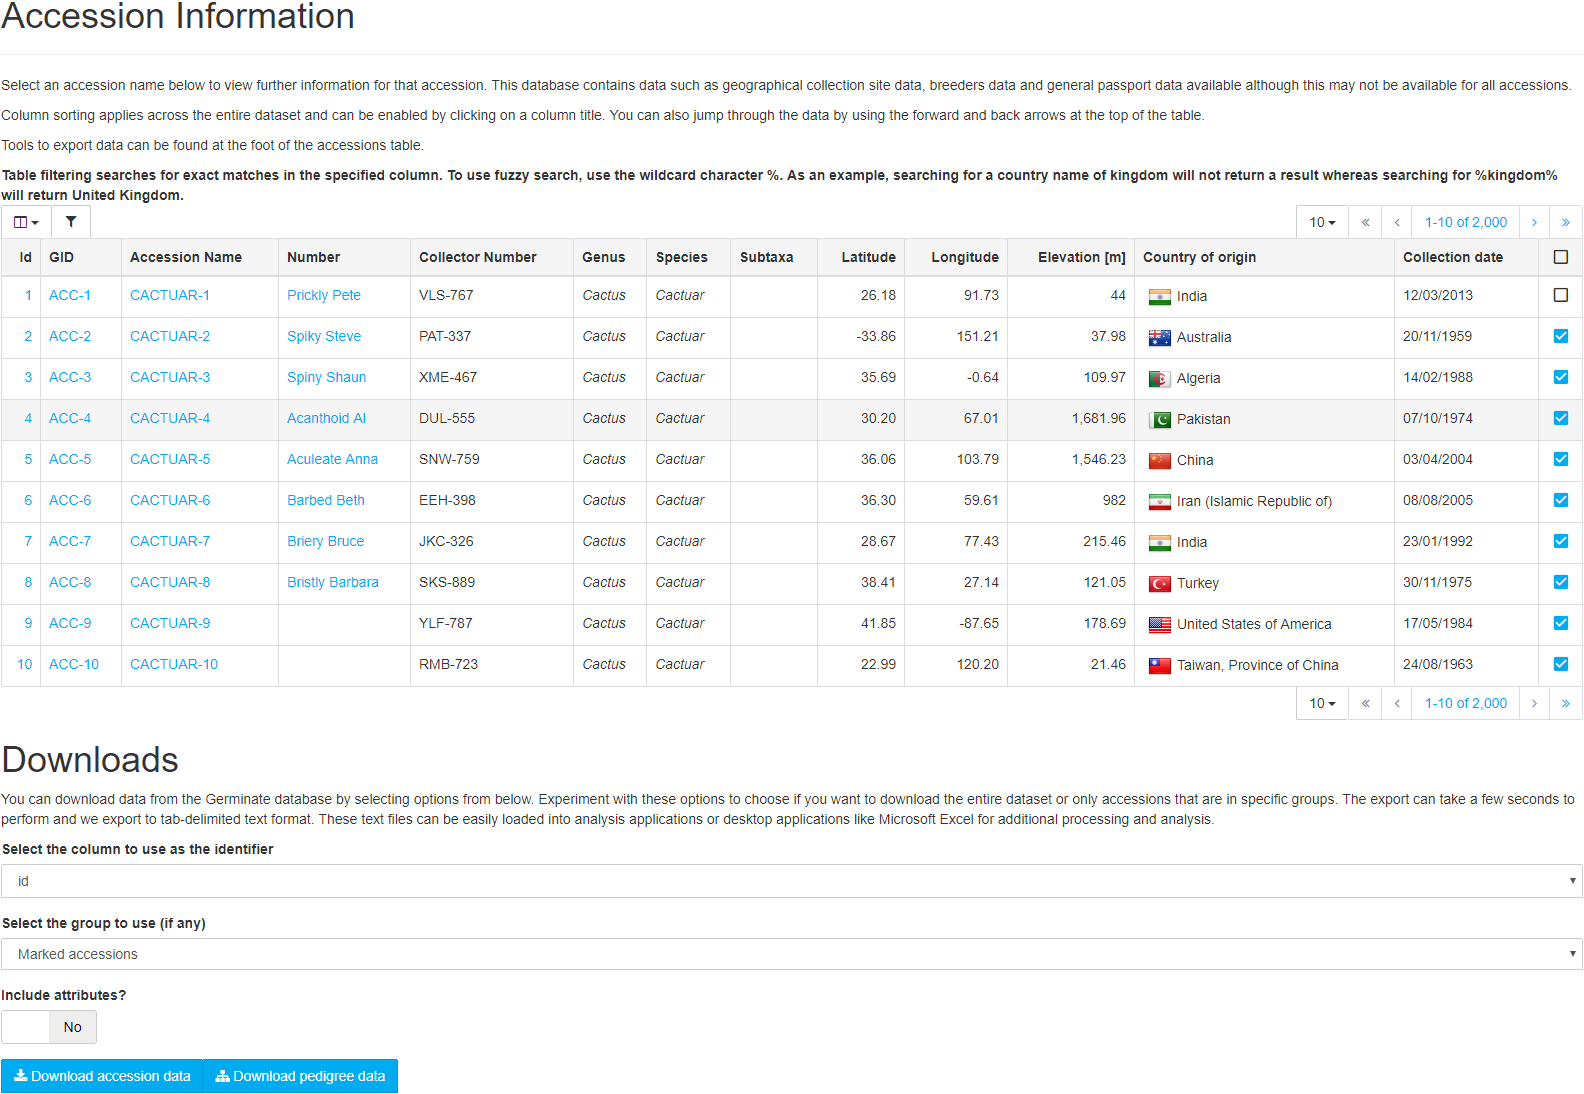
The figure above shows the accession overview page of Germinate. The main feature is the table that shows all accessions held in this instance of Germinate in a central location. The table supports column sorting and filtering as well as adding accessions of interest to the marked items list. The table itself shows the most valuable information about each of the accessions, which is a subset of the Multi-Crop Passport Descriptors (MCPD).
The MCPD is a widely used international standard to facilitate germplasm passport information exchange defined by the FAO. Germinate is fully MCPD V.2.1 compatible. The MCPD standard is used by many genebanks and genetic resources tools and utilities.
The download section located below the table can be used to download the whole set of passport data including accession attributes for either the whole dataset, a group or a custom marked item list of accessions. Additionally, the pedigree information for the same constellation of accessions can be downloaded.
Selecting an accession in the table redirects you to the passport data page. This page shows all the information related to a single accession. This includes the MCPD information, holding institute, synonyms, pedigree data, collecting site location, images, groups, datasets, additional attributes and finally there is a section where users can add annotations to this accession (if this feature is enabled available).

When we talk about genotypic data in the context of Germinate, we are referring to Single Nucleotide Polymorphic (SNP) or Simple sequence repeat (SSR) data. The data export process is shown in the figure above. After selecting the dataset you want to export, you can decide which accessions and markers should be included in the output. Data can be exported against different maps, e.g. physical vs. genetic marker positions.

The data is exported into a tab-delimited text format as well as Flapjack format. The figure above shows an example of data exported from Germinate visualized in Flapjack.
Phenotypic data is a big part of Germinate. We put a lot of effort into developing meaningful visualizations as well as functionality and interoperability with our other software tools.
After selecting a dataset (or multiple datasets), you will have the choice between different visualizations and the data download. The first tab shows an overview over the data within the selected datasets, whereas the second tab lets you plot two phenotypes against each other in a scatter plot. This is particularly useful to see if there is any correlation between them. Hovering over data points shows the values per dimension as well as the accession that is responsible for this data point. Clicking on this data point will take you to the passport page for this accession. You can draw a shape around data points of interest by clicking and dragging the mouse across the chart. This will highlight the data points within the shape. You can then either right-click or use the icon in the top right of the chart to add/remove these items to/from the marked item list.
Whether you are interested in geographic locations at which accessions have been collected or where trials have been conducted, location data is one of the central data types in Germinate and we put a lot of thought into how we display this information and how we can make it available.
| Point | Polygon |
|---|---|
 |
 |
Location information can be used to filter down accessions by country, region, site name, latitude, longitude or even elevation. The geographic search page allows you to search for accessions or locations based on a point of interest query (figure above) or a custom polygon search (figure above). The results are shown below the map grouped into accessions and locations.
| Clustered | Heatmapped |
|---|---|
 |
 |
| Treemapped | |
 |
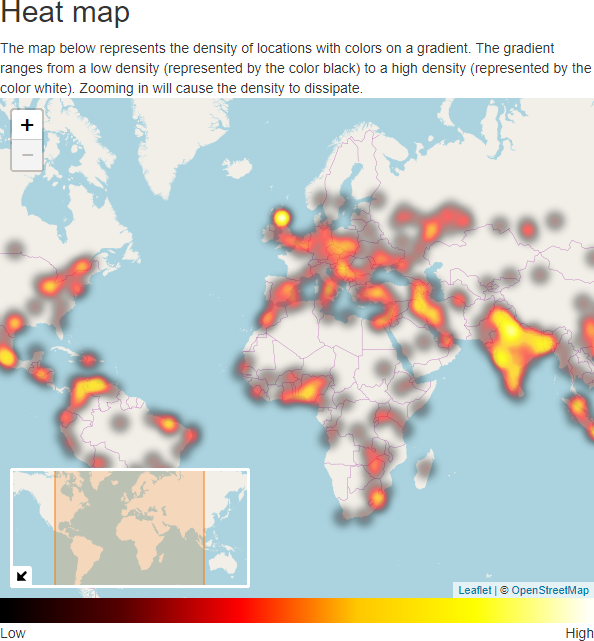
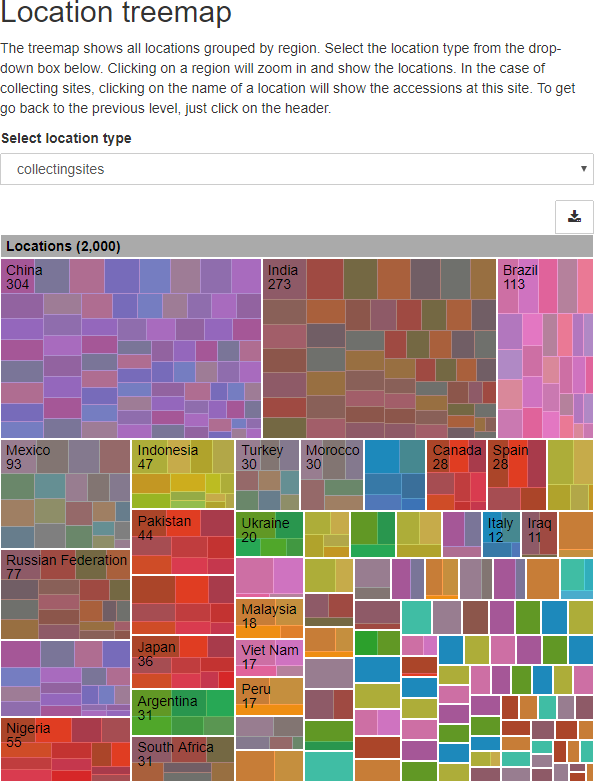
The locations page displays the location data in different ways. The locations are clustered in first figure above, visualized utilizing a heat map in the second figure above and structured in a treemap in the third figure above. All of these visualizations are interactive, so feel free to zoom in and out and select items.