This repository generates synthetic social network data and applies graph theory to analyze user interactions and tweet-hashtag relationships. It includes synthetic tables for tweets, users, and interactions; a directed graph of user interactions that highlights key metrics such as total nodes, edges, in/out-degrees, and betweenness centrality; and an undirected bipartite graph linking tweets with hashtags to identify the most active tweets and popular hashtags. Underlying mathematical concepts from graph theory support the analyses.
Content
- Synthetic Data
- Context 1: Analysis of User Interactions in a Graph
- Context 2: Analysis of Bipartite Graph: Tweets and Hashtags
- Mathematical Foundation
The script generates and exports three synthetic tables that simulate data from a social network. Below is a description of each created table and its structure.
This table contains information about the tweets published by users. Each tweet has a unique identifier, information about the creator, the content category, associated hashtags, and the publication date.
| Field | Description |
|---|---|
| tweet_id | Unique identifier of the tweet (starts at 1000 and increments sequentially). |
| creator | User who created the tweet, randomly selected from the list of users. |
| category | Category of the tweet (e.g., Politics, Economy, Sports, Culture, Technology, Health, World). |
| hashtags | String of associated hashtags, separated by commas. Can contain 0, 1, or 2 random hashtags. |
| tweet_date | Date and time of tweet publication in YYYY-MM-DD HH:MM:SS format (last 60 days). |
This table simulates the information of registered users on the social network, with details about their profile and activity.
| Field | Description |
|---|---|
| user_id | Unique identifier of the user (e.g., User_1, User_2, ...). |
| username | Username, same as the user_id. |
| account_creation_date | Account creation date, randomly generated in the last 5 years. |
| age | Age of the user, a random number between 18 and 60. |
| country | Country of origin of the user (e.g., USA, Spain, Mexico, Argentina, Colombia, Chile, Peru). |
| bio | Brief biography of the user, randomly selected from a list of descriptions. |
| followers_count | Number of followers of the user, randomly generated between 50 and 10,000. |
This table stores the interactions that users perform on tweets, such as comments, likes, reposts, or mentions. Each interaction includes references to both the tweet and the users involved.
| Field | Description |
|---|---|
| interaction_id | Unique identifier of the interaction (starts at 2000 and increments sequentially). |
| tweet_id | Identifier of the tweet related to the interaction. |
| user_from | User who performs the interaction. |
| user_to | User who receives the interaction. Can be empty, depending on the type of interaction. |
| interaction_type | Type of interaction, which can be comment, like, repost, or mention. |
| interaction_date | Date and time the interaction was performed, in YYYY-MM-DD HH:MM:SS format (last 30 days). |
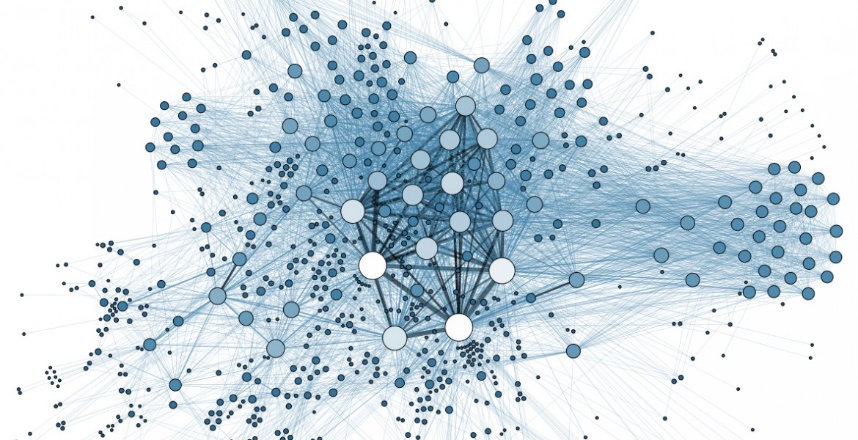
In this scenario, a directed graph is created to represent the interactions between users of a social network. Each node in the graph corresponds to a user, while the edges indicate interactions between them, such as comments, likes, reposts, and mentions. The goal is to analyze the network structure, obtain important metrics, and visualize the distribution and direction of interactions.
Graph Type:
- Directed Graph (DiGraph).
Processed Data:
- Nodes: Users with attributes (username, creation date, age, country, bio, followers).
- Edges: Interactions (comments, likes, reposts, mentions) between users.
Key Results:
| Metric | Description |
|---|---|
| Total users (nodes) | Total number of users in the network. |
| Total interactions (edges) | Total number of connections between users. |
| Top 3 In-degree | Users who receive the most interactions. |
| Top 3 Out-degree | Users who initiate the most interactions. |
| Top 3 Betweenness Centrality | Users who act as critical bridges in the network. |
Adjacency Matrix: Generated to numerically visualize the connectivity between users.
Graph Visualization:

A bipartite graph is created that connects tweets with the hashtags they use. Each node represents a tweet or a hashtag, and an edge indicates that a tweet uses a hashtag. This allows identifying which tweets use the most hashtags and which hashtags are the most popular.
Graph Type:
- Undirected Graph (Graph) with a bipartite structure.
Processed Data:
- Nodes:
- Tweets (type "tweet", positioned in one set).
- Hashtags (type "hashtag", positioned in the other set).
- Edges:
- Connection between a tweet and the hashtags it uses, with the relation "uses".
Key Results:
| Metric | Description |
|---|---|
| Top 3 Tweets by number of hashtags used | Tweets with the highest number of connections to hashtags. |
| Top 3 Hashtags by popularity | Most used hashtags (highest number of tweets using them). |
Bipartite Graph Visualization:

Graphs are a central structure in discrete mathematics and computer science used to model relationships between pairs of objects. A graph
- Vertices (V): A set of nodes or points.
- Edges (E): A set of connections (pairs of vertices) that represent relationships.
-
Undirected Graphs:
- The edges do not have a direction.
- An edge between
$u$ and$v$ is represented as${u, v}$ .
-
Directed Graphs (Digraphs):
- Each edge has a direction.
- An edge from
$u$ to$v$ is represented as$(u, v)$ . - Useful in modeling asymmetrical relationships (e.g., follower relationships in social networks).
-
Weighted Graphs:
- Edges carry a numerical weight.
- Weights can represent distance, cost, or capacity.
-
Bipartite Graphs:
- The vertex set is divided into two disjoint sets
$U$ and$W$ such that every edge connects a vertex in$U$ to one in$W$ . - Commonly used in modeling relationships between two different types of entities (e.g., tweets and hashtags).
- The vertex set is divided into two disjoint sets
-
Adjacency Matrix:
- A square matrix
$A$ where$a_{ij}$ represents the presence (and sometimes the weight) of an edge between vertices$i$ and$j$ . - Provides a straightforward way to check for edge existence, especially in dense graphs.
- A square matrix
-
Adjacency List:
- Each vertex maintains a list of adjacent vertices.
- More memory-efficient for sparse graphs and provides faster iteration over neighbors.
-
Degree:
- Undirected Graphs: The degree of a vertex is the number of edges incident to it.
- Directed Graphs:
- In-degree: Number of incoming edges.
- Out-degree: Number of outgoing edges.
-
Path and Connectivity:
- A path is a sequence of vertices where each adjacent pair is connected by an edge.
- Connectivity assesses whether there is a path between any two vertices in the graph.
- Connected Graph: There is a path between every pair of vertices (for undirected graphs).
-
Cycles:
- A cycle is a path that starts and ends at the same vertex with no other repetitions.
- Acyclic Graph: A graph with no cycles, important in scenarios like dependency resolution.
-
Centrality Measures:
- Degree Centrality: Based on the number of direct connections a vertex has.
- Betweenness Centrality: Measures the frequency at which a vertex appears on the shortest paths between other vertices.
- Closeness Centrality: Based on the average length of the shortest paths from a vertex to all others.
- Eigenvector Centrality: Considers the influence of a vertex based on the centrality of its neighbors.
-
Graph Traversal Algorithms:
- Breadth-First Search (BFS): Explores vertices in layers, useful for finding the shortest path in unweighted graphs.
- Depth-First Search (DFS): Explores as far as possible along each branch before backtracking, useful for cycle detection and path finding.
-
Social Network Analysis:
- Modeling and analyzing relationships and interactions among individuals.
- Identifying influencers using centrality metrics.
-
Computer Networks:
- Routing algorithms that optimize the flow of data across networks.
-
Biology:
- Analyzing biological networks such as neural networks and protein-protein interaction networks.
-
Recommendation Systems:
- Using bipartite graphs to model relationships between users and products (or tweets and hashtags) to provide personalized recommendations.
-
Optimization Problems:
- Problems like the traveling salesman or network flow, where graphs model the underlying structure of the problem.