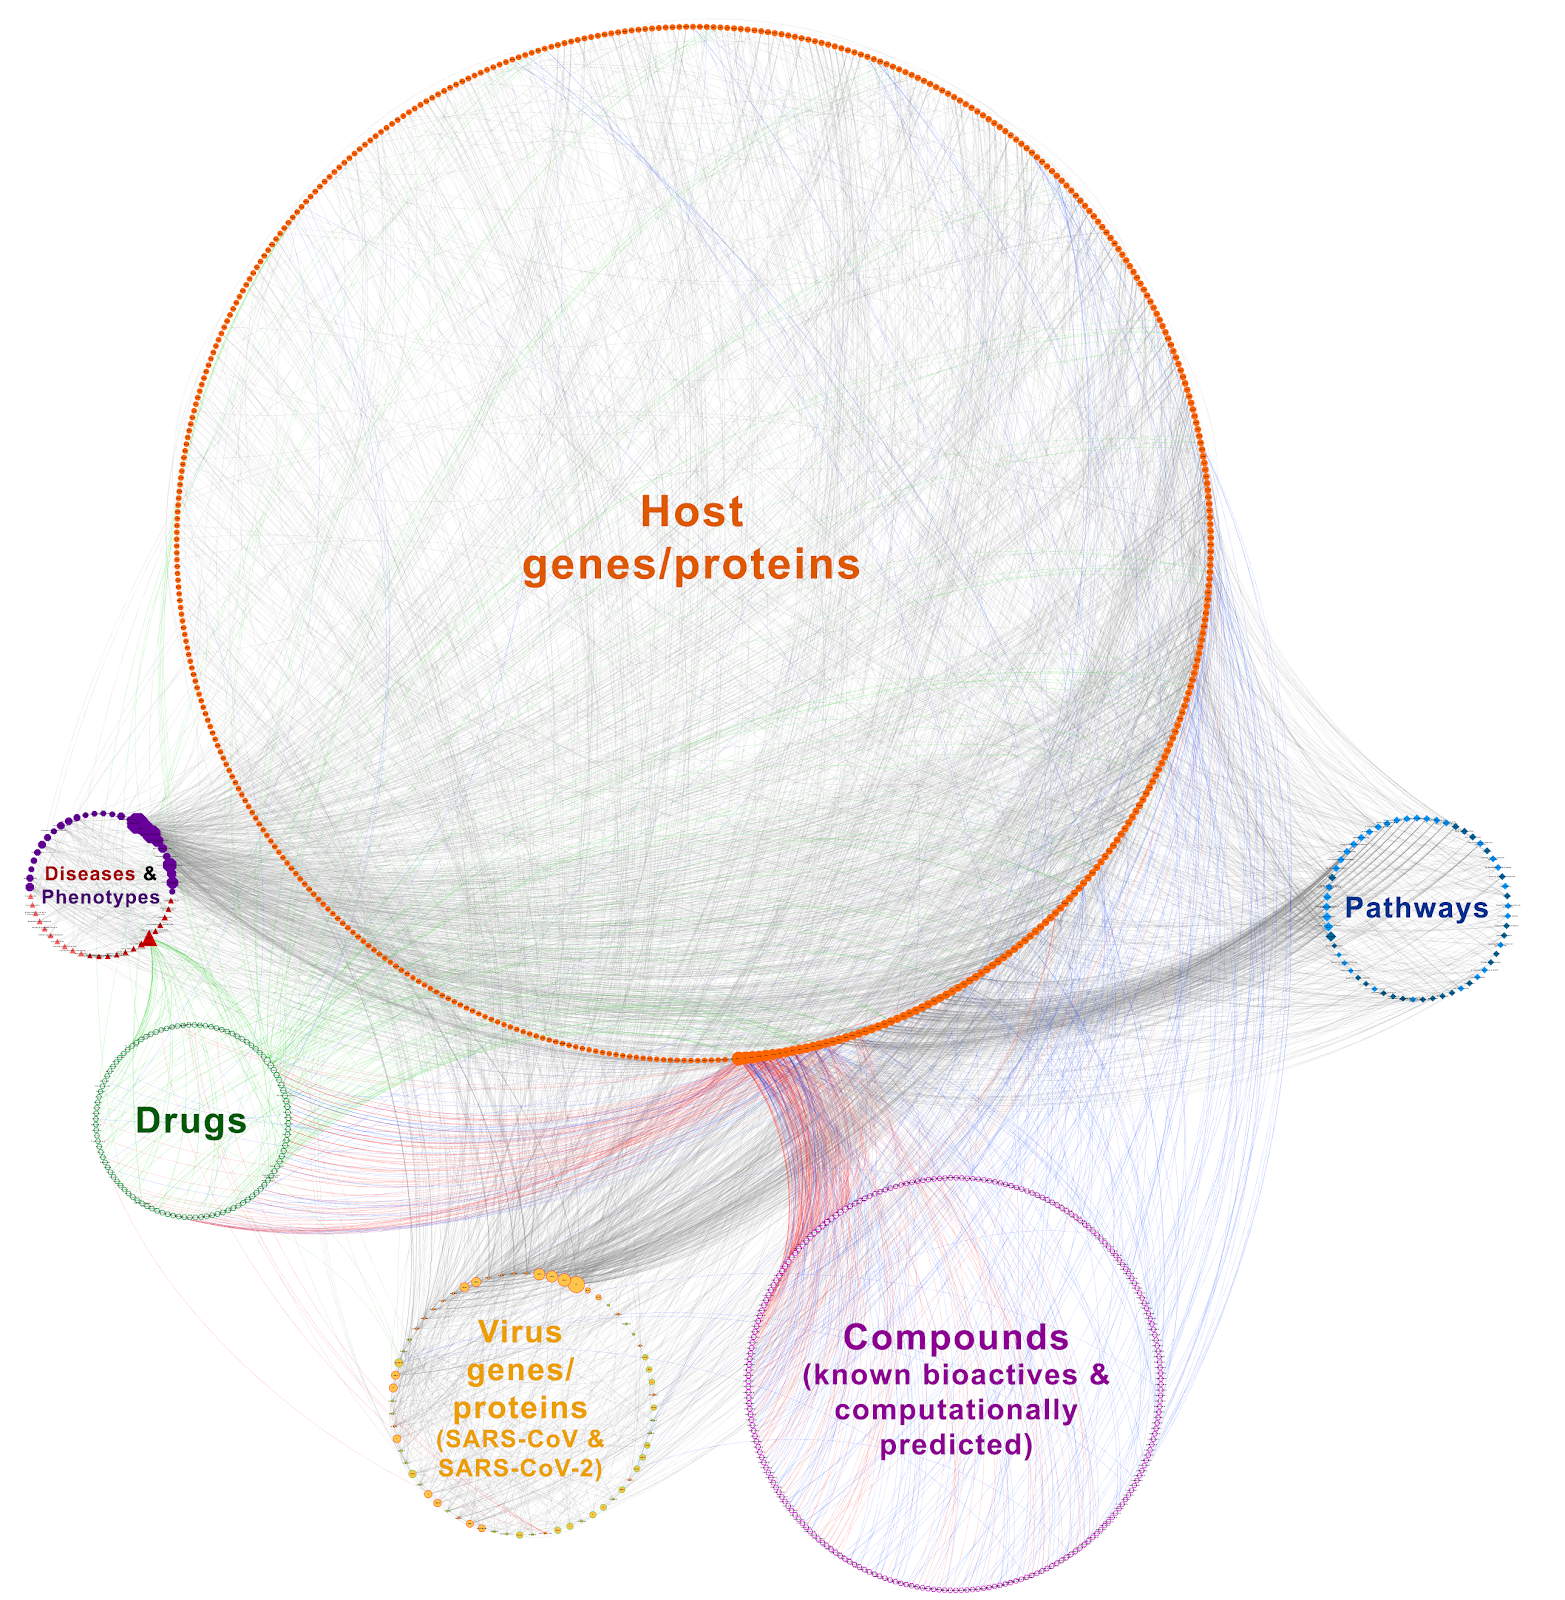
We constructed two versions of COVID-19 knowledge graph.
- First, the large-scale version that includes nearly the whole of the COVID-19 related information recently accumulated in the scientific literature, organized and presented in an interpretable way.
- Second, the simplified version that is suitable for quick exploration. The aim behind constructing the simplified version was that the large-scale KG is not easily explorable visually due to the huge size of the graph. Below, we describe the methodology followed for the generation of CROssBAR COVID-19 KGs.
Generation of the large-scale COVID-19 graph started with acquiring the related EFO disease term named: "COVID-19" (id: MONDO:0100096). We also incorporated the disease term for "Severe acute respiratory syndrome" (id: EFO:0000694) (the previous SARS) into the graph since SARS is better annotated compared to COVID-19. The full-scale COVID-19 KG construction is accomplished as described below:
1. COVID-19 related genes/proteins and PPIs:
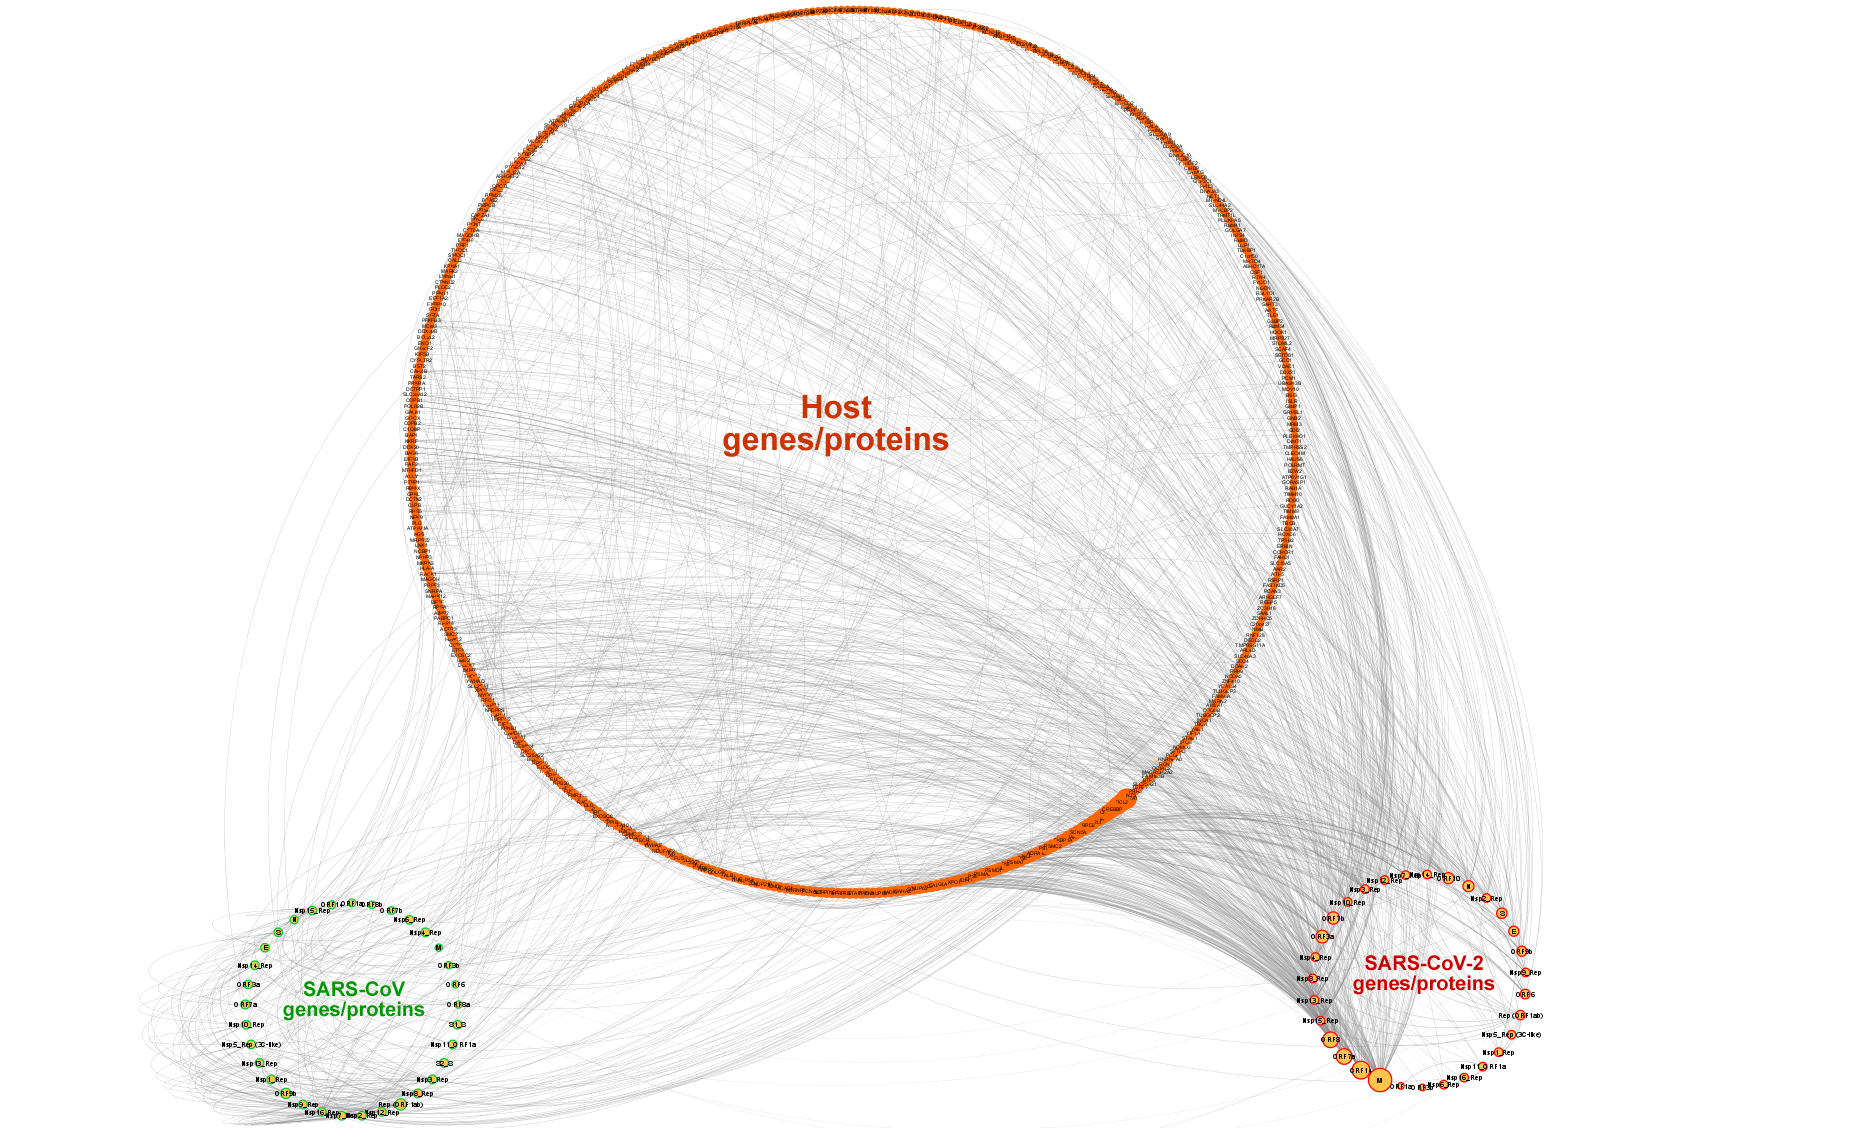
- COVID-19 related genes/proteins and their interactions were retrieved from the IntAct database’s COVID-19 dataset, which contain 1,172 gene/protein and metabolite nodes from various organisms and 2,214 edges.
- Nodes were filtered so that only reviewed protein nodes from human, SARS-CoV, and SARS-CoV-2 (exceptional unreviewed protein entry, ORF10 (accession: A0A663DJA2)) organisms were included.
- Edges were filtered based on ppi confidence score so that;
- edges between host proteins and SARS-CoV and/or SARS-CoV-2 proteins with confidence score less than 0.35, and
- edges between host proteins in the KG (i.e., neighboring proteins) with confidence score less than 0.6 were discarded.
- Disconnected components made up of host proteins formed due to the interaction-based edge filtering were removed.
- Orthology relations between SARS-CoV and SARS-CoV-2 genes/proteins were annotated with "is ortholog of" edge type.
- The subunits of large protein complexes such as the NSPs of replicase polyprotein 1ab of SARS-CoV/SARS-CoV-2 were mapped to their corresponding protein complex nodes with "is subunit of" edge label.
- The finalized number of genes/proteins is 539 (475 host genes/proteins, and 33 SARS-CoV and 31 SARS-CoV-2 genes/proteins) and the number of edges (i.e., PPIs) is 1284.
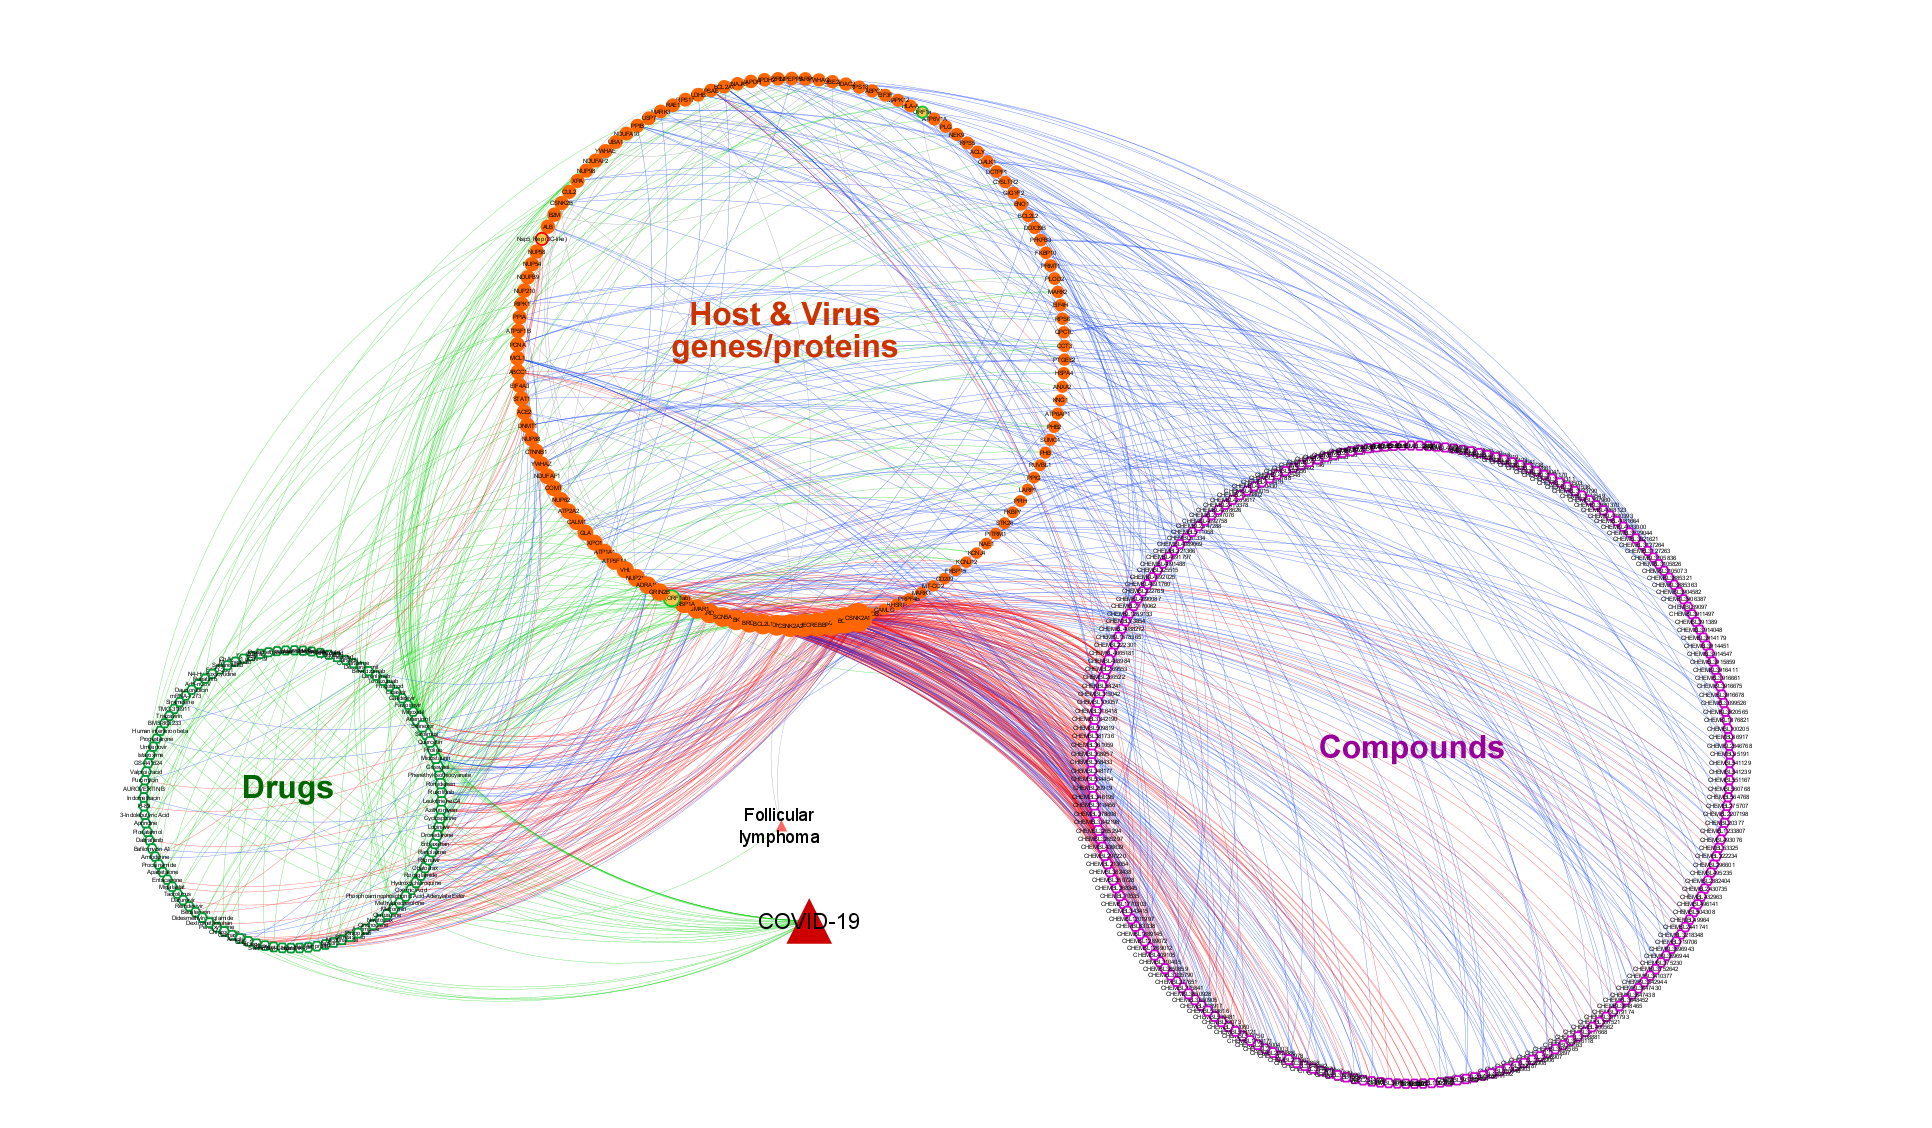
2. COVID-19 related drugs and compounds:
2a. The approved/investigational drug interactions
- They were retrieved from DrugBank database, v5.1.6 release.
- To incorporate only the most relevant drug-target interactions, a drug overrepresentation analysis was applied in terms of the target genes/proteins in the KG using hypergeometric distribution, as described at the end.
- Drugs in the curated COVID-19 specific drug list of DrugBank were connected to the COVID-19 disease node and related target proteins in the KG -if present-.
- Drugs from curated results in new and critical SARS-CoV-2 related publications such as Gordon et al. [Gordon-2020] were also incorporated by mapping to corresponding target proteins.
- Edge color: green
2b. Compound-target interactions from experimentally measured bioactivities
- They were retrieved from ChEMBL database (v27) by involving only bioactivity data points in binding assays, where the targets are human or SARS proteins, and the pChEMBL value is greater than or equal to 5.
- Overrepresentation analysis was applied to select the most relevant ones.
- Only compounds with enrichment scores greater than 1 and p-value less than 0.05 were considered.
- They were clustered based on Tanimoto coefficient based molecular similarities with a threshold of 0.5.
- Top 3 overrepresented compound nodes, that are in different clusters, were selected for each target protein and incorporated to the KG.
- Selected compound - host target protein interactions from the curated ChEMBL SARS-CoV-2 dataset and experimental results in the study of Gordon et al. [Gordon-2020] were also incorporated.
- Edge color: blue
2c. Computationally predicted drug/compound-target interactions
- They were obtained from our in-house deep learning based tools DEEPScreen [Rifaioglu-2020-I] and MDeePred [Rifaioglu-2020-II].
- Overepresentation analysis was applied as same in part 2b for DeepScreen compound-target interaction predictions and 5 compounds in different clusters were selected for each protein.
- MDeePred predictions were generated from the prediction models of ACE2 receptor protein and SARS-CoV-2 3C-like proteinase. 5 predicted drugs for ACE2 receptor and 3C-like proteinase were selected.
- Edge color: red
- Drug and compound nodes were merged with respect to drug-compound entry correspondences in DrugBank and ChEMBL databases. This way, some of the drug nodes also contain experimental bioassay based relations (i.e., blue colored edges) and computationally predicted relations (i.e., red colored edges).
- Drug-disease relationships based on reported drug indications obtained from the KEGG resource were also incorporated into the KG.
- The total number of drugs (nodes) is 108 and the total number of drug interactions (edges) is 279.
- The total number of small-molecule compounds is 233 and the total number of compound interactions (edges) is 517.
- Out of all drug/compound-target interaction edges, 135 correspond to drug development procedures, 335 to experimental bioassays and 326 to deep learning based predictions.
- Drug node shape: white hexagon with green border
- Compound node shape: white hexagon with fuchsia border
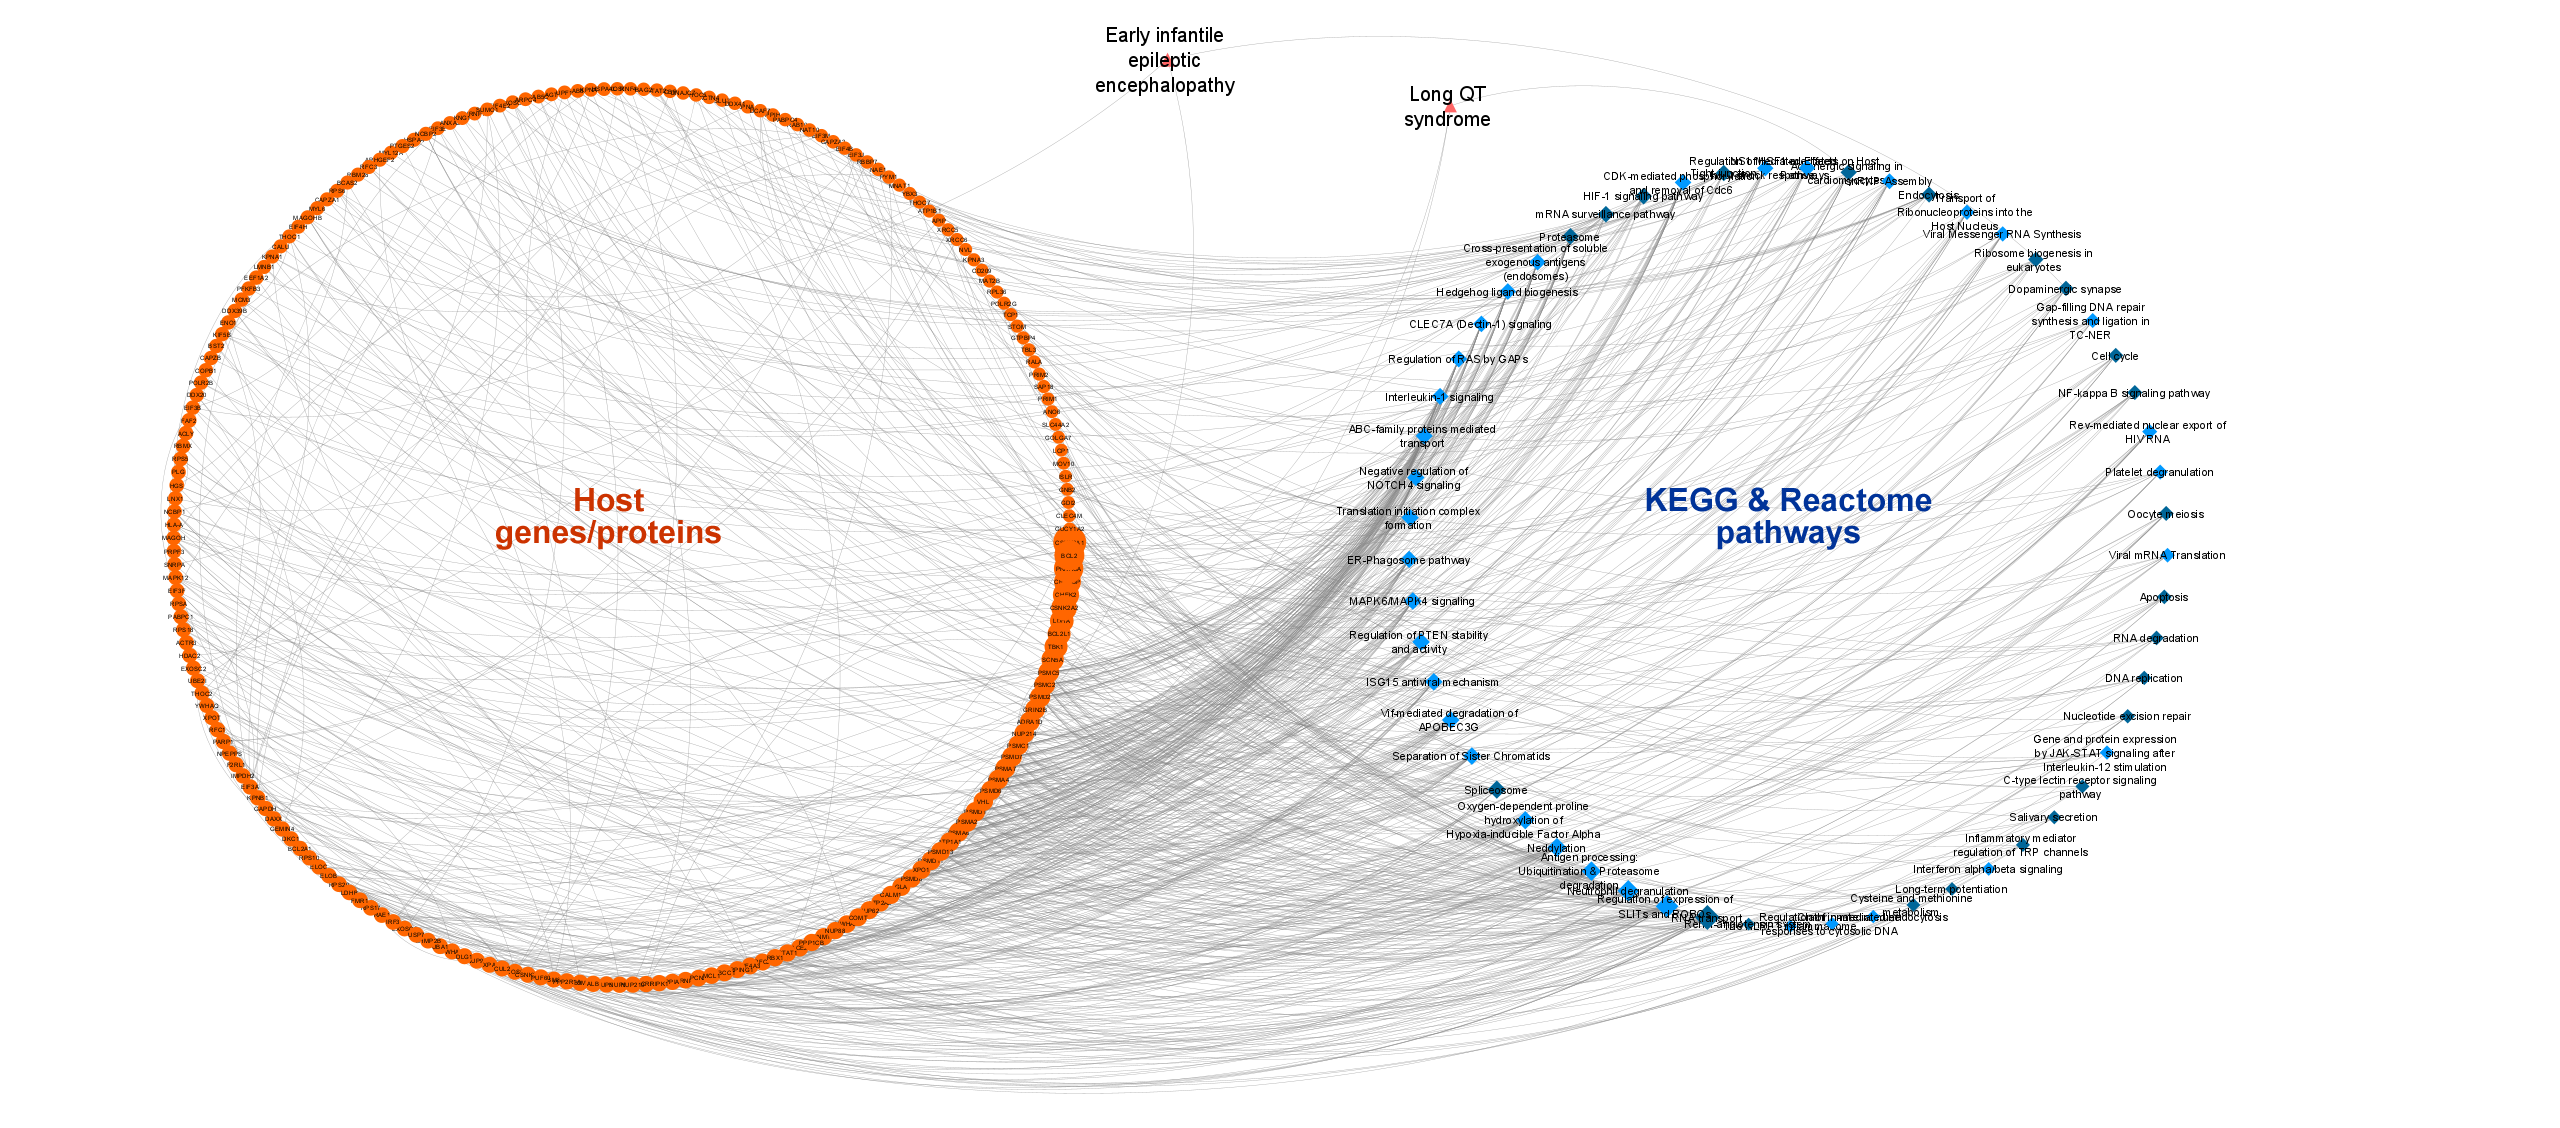
3. Pathways of COVID-19 related host genes/proteins:
- Signaling and metabolic pathway information was taken from Reactome (via CROssBAR database) and KEGG pathways data sources.
- The most relevant pathways were determined by the overrepresentation analysis and mapped to the related genes/proteins in the KG.
- Pathway-disease relations were also obtained from the KEGG database and incorporated into the KG.
- The finalized number of pathways in the KG is 57 (23 for KEGG and 34 for Reactome, among which there are corresponding terms) and the total number of gene/protein-pathway associations (edges) is 718 (244 for KEGG and 474 for Reactome).
4. COVID-19 related phenotypic implications:
- Phenotype terms were retrieved from the Human Phenotype Ontology (HPO) database.
- Overrepresentation analysis was applied for the selection of the most relevant HPO terms.
- From the score-ranked HPO term list, the terms that are not in a close parent-child relationship were selected and mapped to corresponding genes/proteins in the KG.
- HPO also has a curated list of SARS related phenotype terms. These terms were also added into the network and mapped to "COVID-19" and "Severe acute respiratory syndrome" disease nodes.
- Disease-HPO term relations were also integrated into the KG using the disease association information provided in HPO resource.
- The finalized number of phenotype terms in the KG (nodes) is 27 and the number of HPO term - gene/protein associations (edges) is 653.
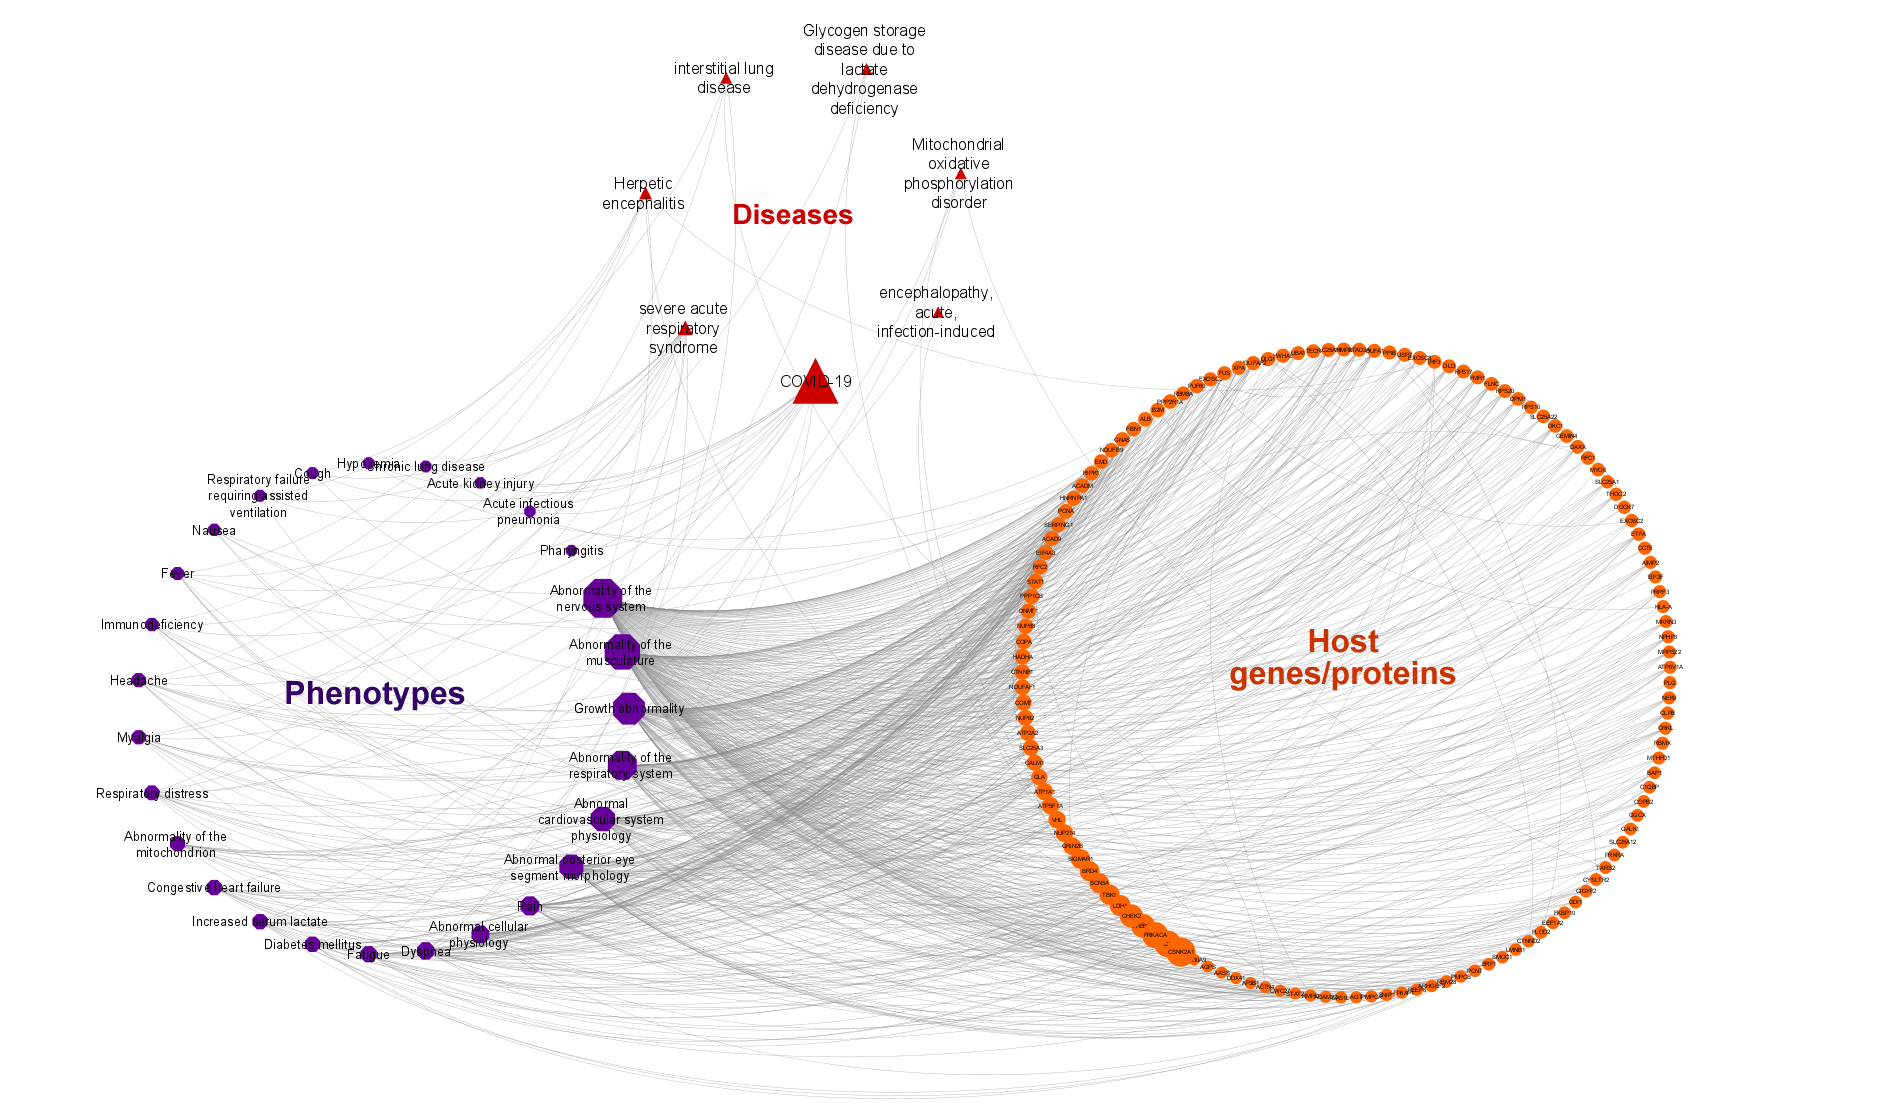
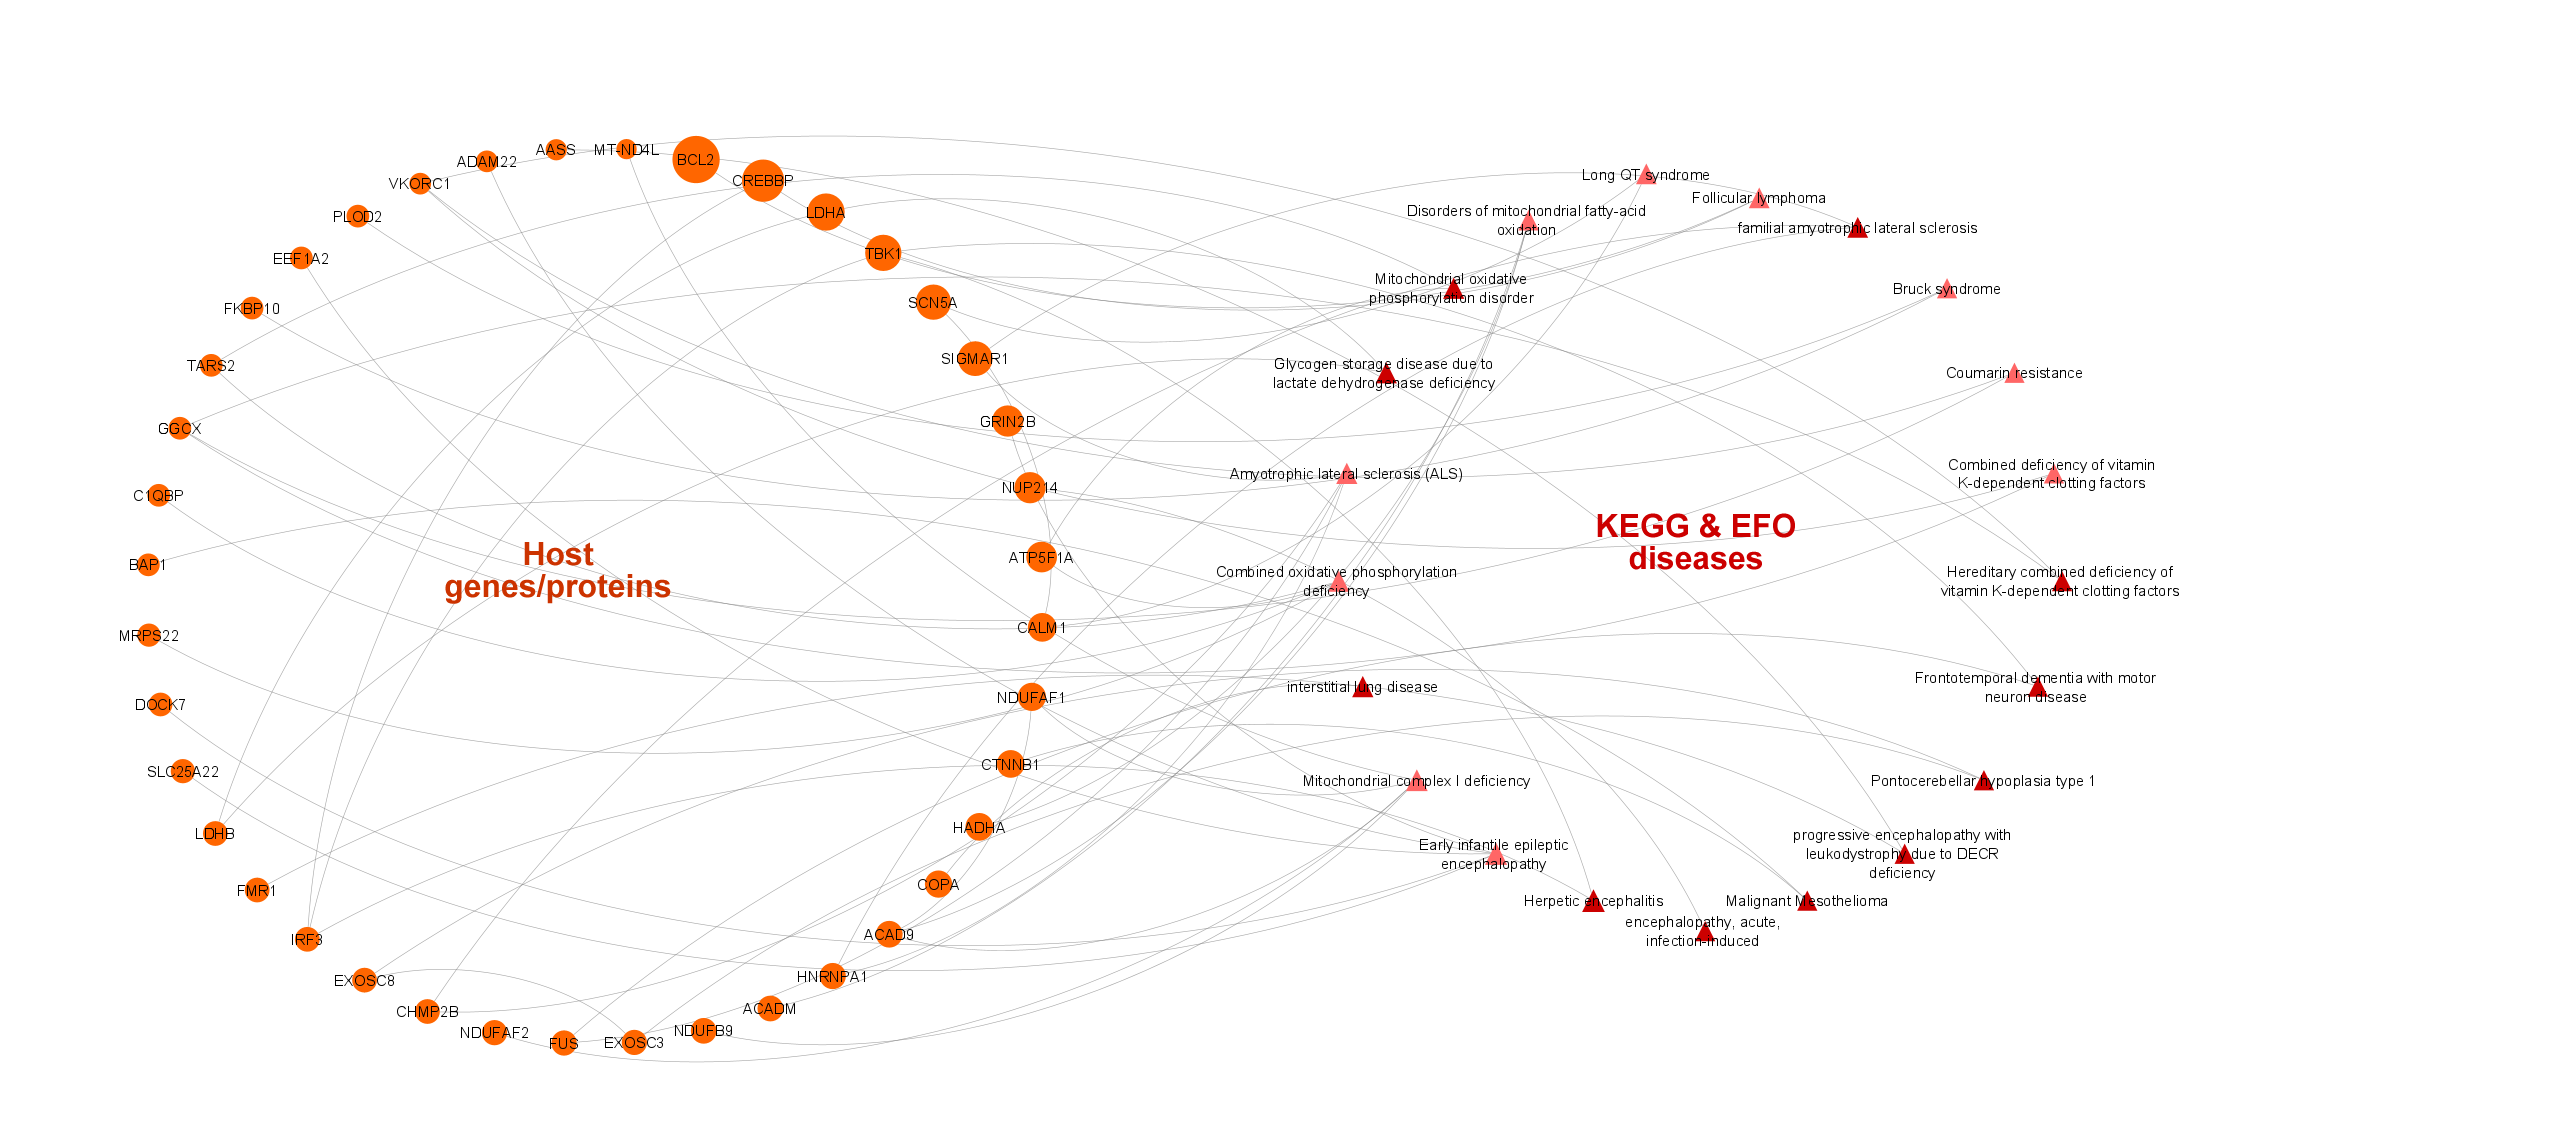
5. Other associated diseases of COVID-19 related host genes/proteins:
- Disease terms were collected from the CROssBAR database resources: EFO disease collection (mainly including OMIM and Orphanet disease entries) and KEGG diseases database.
- The linkage of proteins and EFO terms was achieved through OMIM ids.
- The most relevant disease terms were selected via the overrepresentation analysis.
- The finalized number of disease terms in the KG is 23 (10 for KEGG and 13 for EFO) and the number of disease - gene/protein associations (edges) is 52 (31 for KEGG and 21 for EFO).
The finalized large-scale COVID-19 KG includes 987 nodes (i.e., genes/proteins, drugs/ compounds, pathways, diseases/phenotypes) and 3639 edges (i.e., various types of relations).
- For the construction of the simplified COVID-19 KG, the starting point was the COVID-19 associated proteins in the UniProt COVID-19 portal (https://covid-19.uniprot.org/), instead of the IntAct SARS-CoV-2 interactions dataset, which was used as the base gene/protein set for the large-scale KG.
- The remaining steps of building the graph were mainly similar except that, additional nodes representing the organisms: human, SARS-CoV and SARS-CoV-2 were placed in the graph and connected to the corresponding proteins.
- The simplified version is not just a subset of the large-scale KG since the starting point of gene/protein collection were different in two KGs, resulting in graphs with slightly different content.
The simplified COVID-19 KG includes a total of 178 nodes and 298 edges.

- In overrepresentation analysis, we calculate an independent enrichment score for each biological entity (i.e., a disease, phenotype, drug, compound, gene/protein or pathway), to be assessed as its relevance to the graph that is being constructed.
- The calculation of enrichment score and its statistical significance is done using the hypergeometric test for over-representation [Rivals-2007], which also corresponds to a one-tailed Fisher's exact test, and it is based on the statistics of the relations/connections with genes/protein nodes.
- For example, the enrichment score (ED,W) and its significance (SD,W), in terms of p-value, for a disease term D, for graph W is calculated as follows:
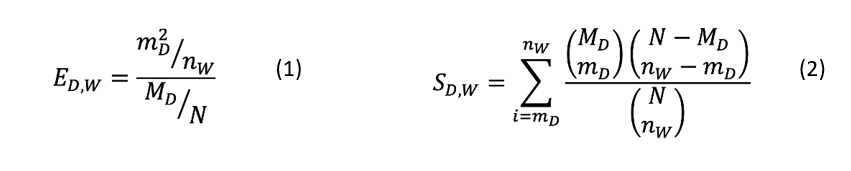
- ED,W is the enrichment score calculated for the disease term D for graph W; mD2 represent the square of the number of genes/proteins in graph W that are associated with disease D; nW represents the total number of genes/proteins having disease associations in graph W; MD is the total number of genes/proteins (not necessarily in graph W) that is associated with disease D; and N represents the total number of reviewed human gene/protein entries (i.e., UniProtKB/Swiss-Prot entries) in the data source that is annotated with any disease entry. SD,W represents the significance (p-value) for the disease term D for graph W calculated in the hypergeometric test.
- An enrichment score is calculated for each disease entry having associations with the graph gene/protein nodes and these scores are used to rank these disease entries according to their biological relevance to graph.
- In the traditional way of calculating an enrichment score, mD is without square. The reason behind taking the square of mD here is to break the tie between the scores of terms in favor of the one with a higher mD value.
- Apart from diseases, the same methodology is used to filter out the nodes of phenotypes, drugs, compounds and pathways.
To load the large-scale and simplified COVID-19 KGs on Cytoscape:
- You may directly open the session files (“CROssBAR_COVID-19_Large-Scale_KG.cys” and “CROssBAR_COVID-19_Simplified_KG.cys”) via CytoScape application or (if it does not work),
- You may open a new session on CytoScape and import the network files ("CROssBAR_COVID-19_Large-Scale_KG.xgmml" and "CROssBAR_COVID-19_Simplified_KG.xgmml") as "File -> Import -> Network from File" option.
Gordon, D. E., Jang, G. M., Bouhaddou, M., Xu, J., Obernier, K., White, K. M., ... & Tummino, T. A. (2020). A SARS-CoV-2 protein interaction map reveals targets for drug repurposing. Nature, 1-13.
Rifaioglu, A., Sinoplu, E., Atalay, V., Martin, M., Cetin-Atalay, R., & Dogan, T. (2020). DEEPScreen: High Performance Drug-Target Interaction Prediction with Convolutional Neural Networks Using 2-D Structural Compound Representations. Chemical Science, 11 (9), 2531-2557.
Rifaioglu, A., Cetin-Atalay, R., Kahraman, D.C., Dogan, T., Martin, M., Atalay, V. (2020). MDeePred: Novel Multi-Channel Protein Featurization for Deep Learning based Binding Affinity Prediction in Drug Discovery, Bioinformatics [currently under peer review].
Rivals, I., Personnaz, L., Taing, L., & Potier, M. C. (2007). Enrichment or depletion of a GO category within a class of genes: which test?. Bioinformatics, 23(4), 401-407.