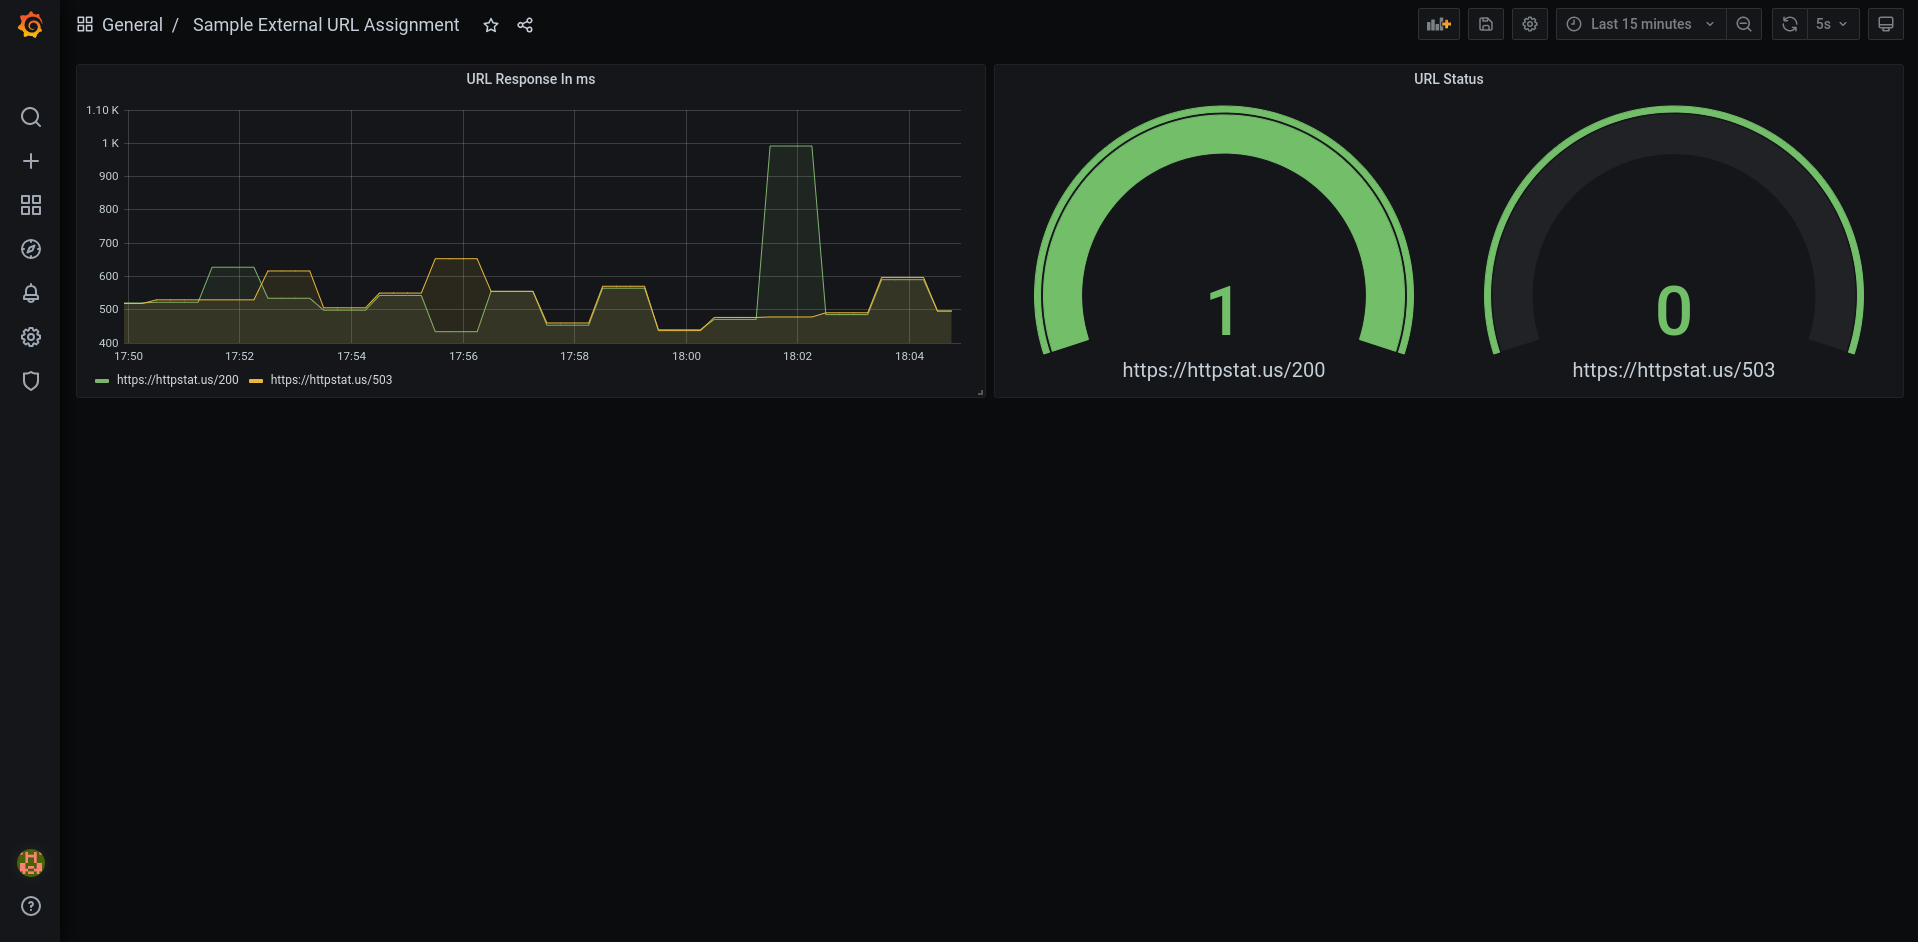
This is a sample application in Python which is collecting external URL metrics and producing Prometheus format metrics at the endpoint /metrics. Prometheus is collecting the metrics from the endpoint and a dashboard in Grafana is used to display the metrics.
The following URLS are being used as demo:-
The metrics currently being collected are:-
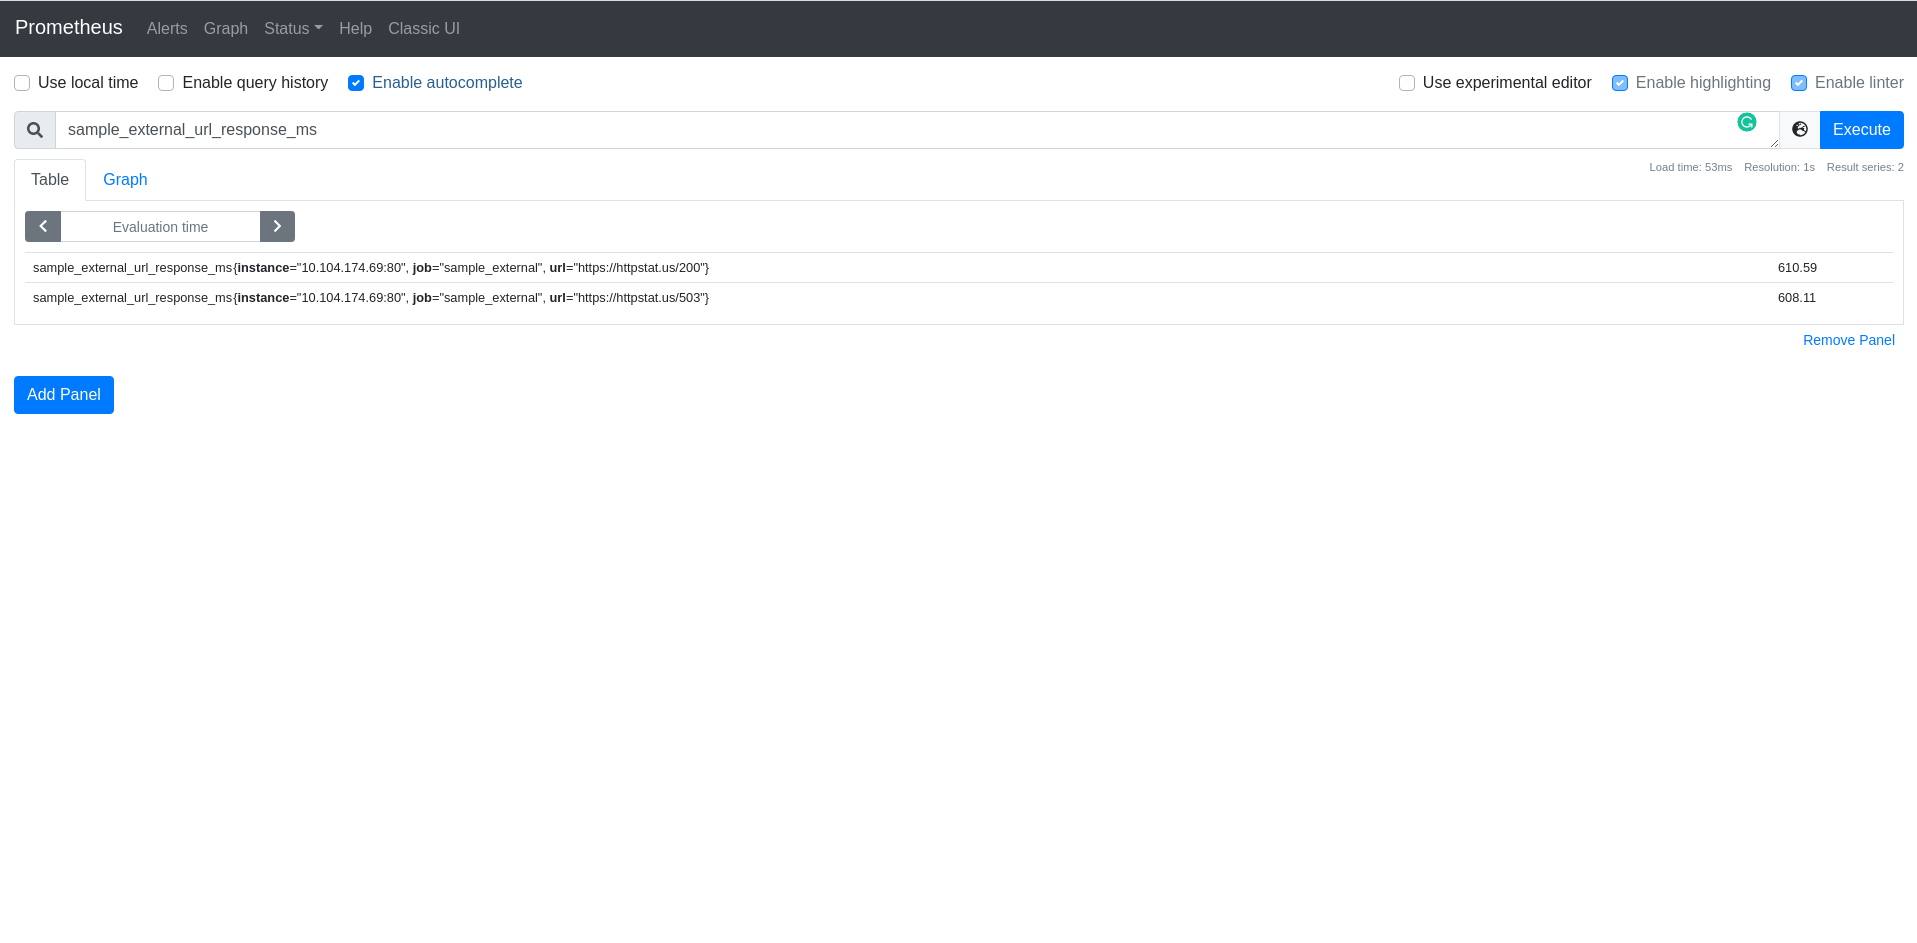
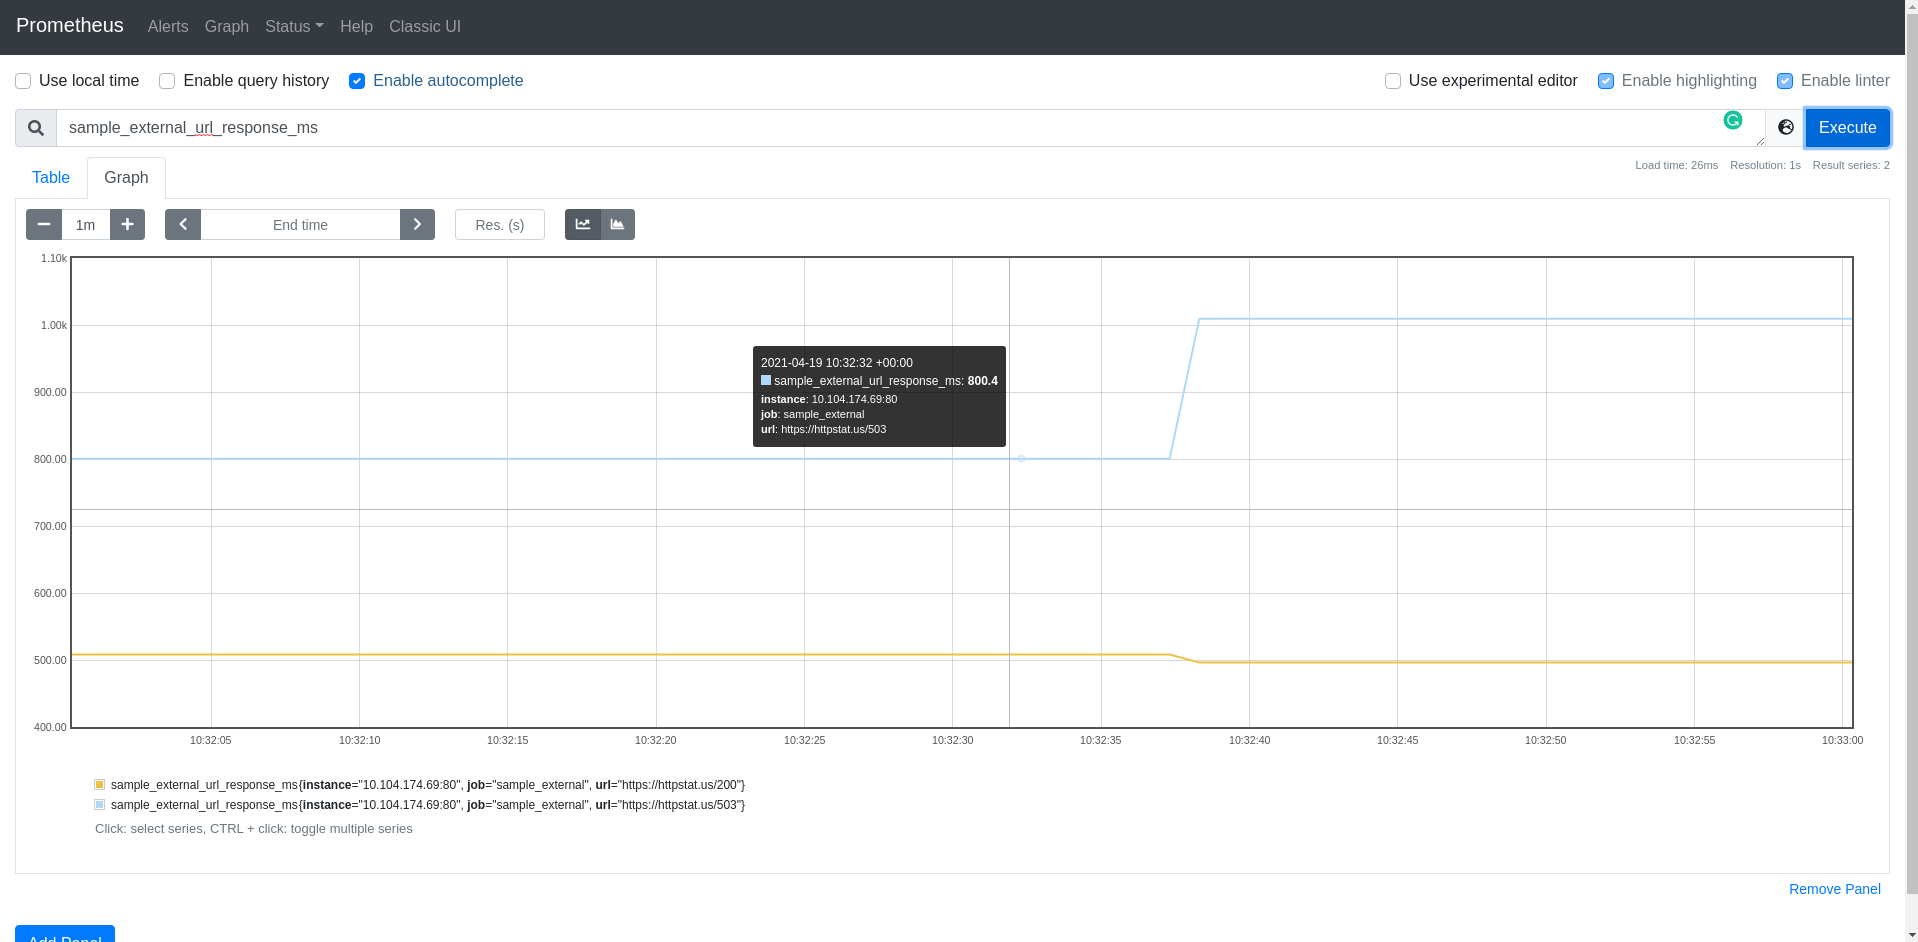
- URL response time in milliseconds
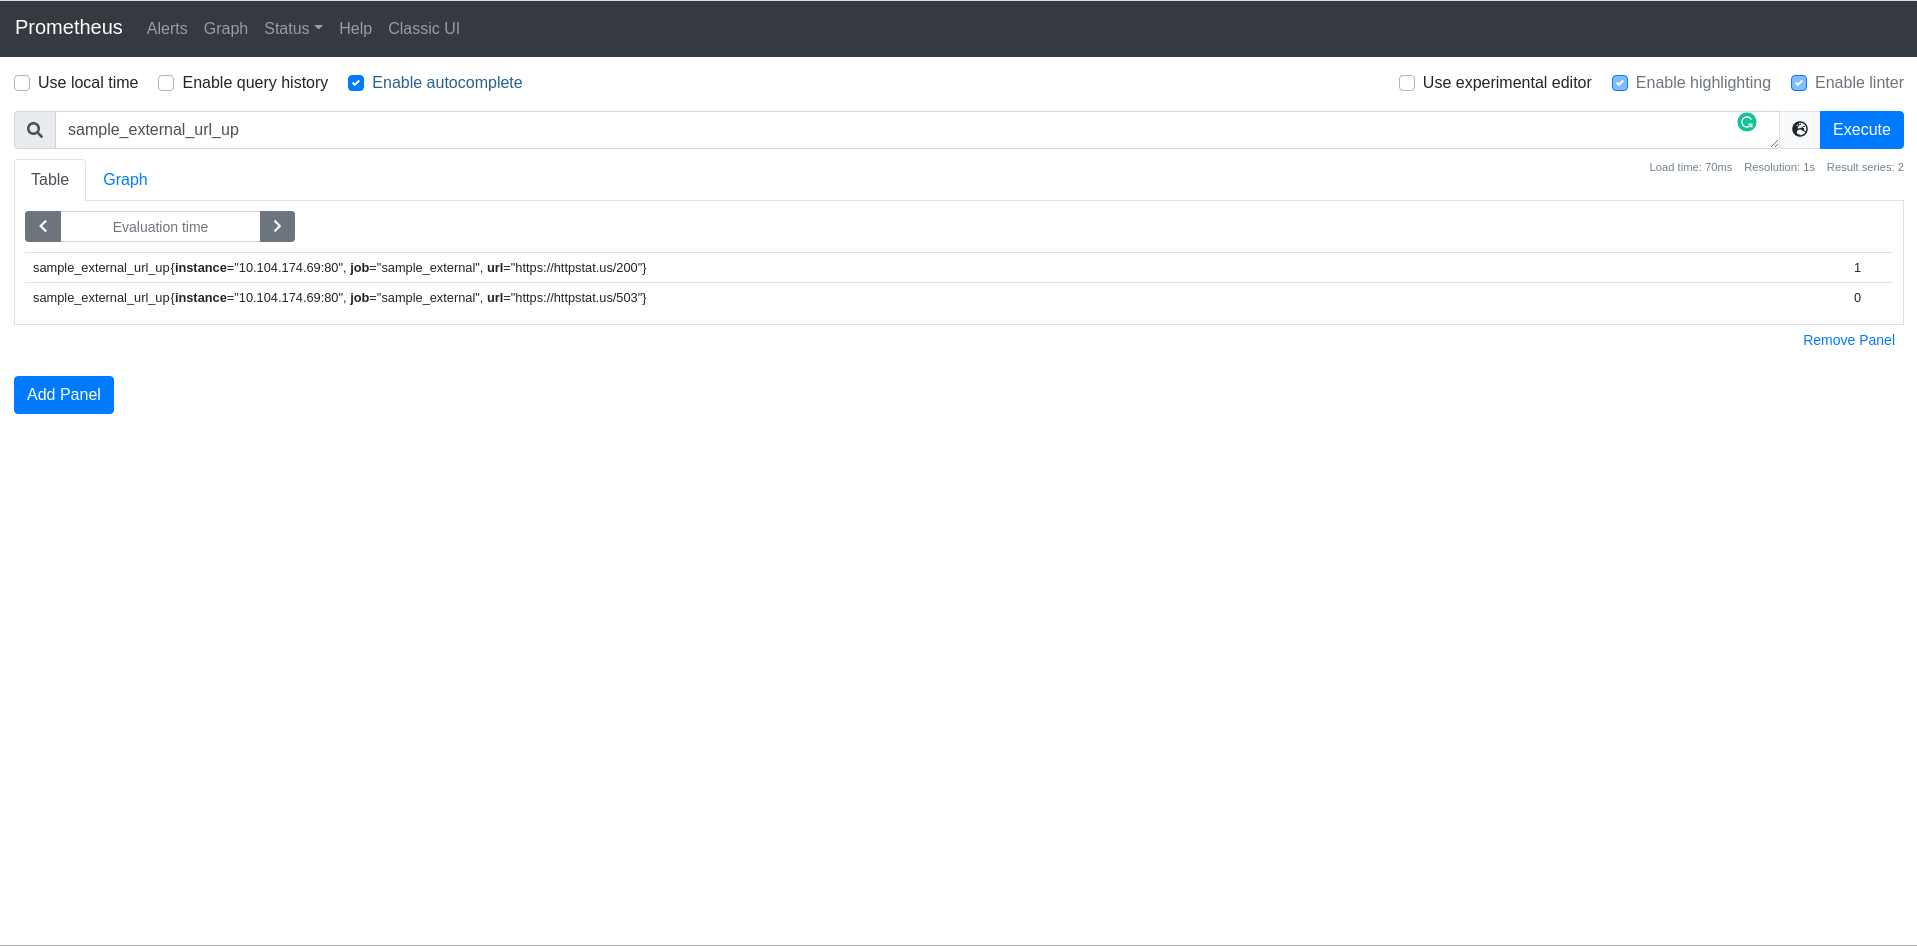
- URL status up or down using 1 or 0 respectively
There is also Dockerfile which is converting the Python application into a container based application and then the application is being deployed to K8s cluster.
Python3.9 is required
- Clone git repository and enter into the folder
git clone https://github.com/himadriganguly/sample_external_url.git
cd sample_external_url
- Create and activate a virtual environment
Linux
python -m venv venv
source venv/bin/activate
Windows
python -m venv venv
.\venv\Scripts\activate.bat
- Install the required packages inside the environment
pip install -r src/requirements-dev.txt
- Run unit-test of the application using pytest
pytest
- Export environment variables for the application
Linux
export URLS='https://httpstat.us/503','https://httpstat.us/200'
export TIMEOUT=2
export PORT=8080
Windows
https://docs.microsoft.com/en-us/windows-server/administration/windows-commands/set_1
- Run the application
python src/app.py
-
Check the application Open your browser and point to http://localhost:8080 you will see a text message. To see the metrics point your browser to http://localhost:8080/metrics
-
Exit the application
Ctrl + c
You will see a good bye message.
Docker is required
- Build the Docker image
docker build -t sample_external_url .
- Check the application if the container is working perfectly
docker run -d -p 8080:8080 --env-file ./env-file --name sample sample_external_url
Open your browser and point to http://localhost:8080 you will see a text message. To see the metrics point your browser to http://localhost:8080/metrics
-
Create new repository on DockerHub or your preferred docker registry.
-
Login to your docker registry in console
docker login
- Push the image to DockerHub or to your preferred docker registry
docker tag sample_external_url:latest [USERNAME]/sample_external_url:latest
docker push [USERNAME]/sample_external_url:latest
The folder k8s contains the sample_external_url.yaml file which contains the code for Kubernetes deployment.
The file contains following segments:-
-
CongfigMap - This contains all the configuration of the application that is the environment variables.
-
Deployment - This contains the k8s deployment of the application. The POD refers to the configmap for the configuration. Image used for the POD is image: himadriganguly/sample_external_url, change that according to your registry url.
Note:- DockerHub URL https://hub.docker.com/r/himadriganguly/sample_external_url
- Service - This will expose the application as ClusterIP on port 80 and targetPort 8080. Change the targetPort value according to the PORT value in configmap.
- Create a namespace
kubectl create ns sample-external-url
- Deploy application in the above created namespace
kubectl apply -f k8s/sample_external_url.yaml -n sample-external-url
- Display all the components deployed
kubectl get all -n sample-external-url
Note:- Write down the CLUSTER-IP we would need it later.
- Check the application
kubectl port-forward service/sample-external-url-service 8080:80 -n sample-external-url
Open your browser and point to http://localhost:8080 you will see a text message. To see the metrics point your browser to http://localhost:8080/metrics
- Get Repo Info
helm repo add prometheus-community https://prometheus-community.github.io/helm-charts
helm repo add kube-state-metrics https://kubernetes.github.io/kube-state-metrics
helm repo update
- Install Chart
helm install prometheus prometheus-community/prometheus
Note:- https://artifacthub.io/packages/helm/prometheus-community/prometheus
- Get Repo Info
helm repo add grafana https://grafana.github.io/helm-charts
helm repo update
- Install Chart
helm install grafana grafana/grafana
Note:- https://github.com/grafana/helm-charts/tree/main/charts/grafana
- Get the login username and password
kubectl get secrets grafana -o jsonpath='{.data.admin-password}' | base64 --decode | cut -d "%" -f1
kubectl get secrets grafana -o jsonpath='{.data.admin-user}' | base64 --decode | cut -d "%" -f1
- Update configmap for Prometheus
kubectl edit cm/prometheus-server
- Add the following config under scrape_configs
- job_name: 'sample_external'
      static_configs:
      - targets: ['CLUSTER-IP:80']
Note:- Replace CLUSTER-IP with the ip that we noted down earlier. In my case it will be 10.104.174.69.
- Port forward Prometheus
kubectl port-forward service/prometheus-server 9090:80
- Port forward Grafana
kubectl port-forward service/grafana 3000:80
- Open Prometheus
Open your browser and point to http://localhost:9090 you will see Prometheus UI.
- Check Prometheus config
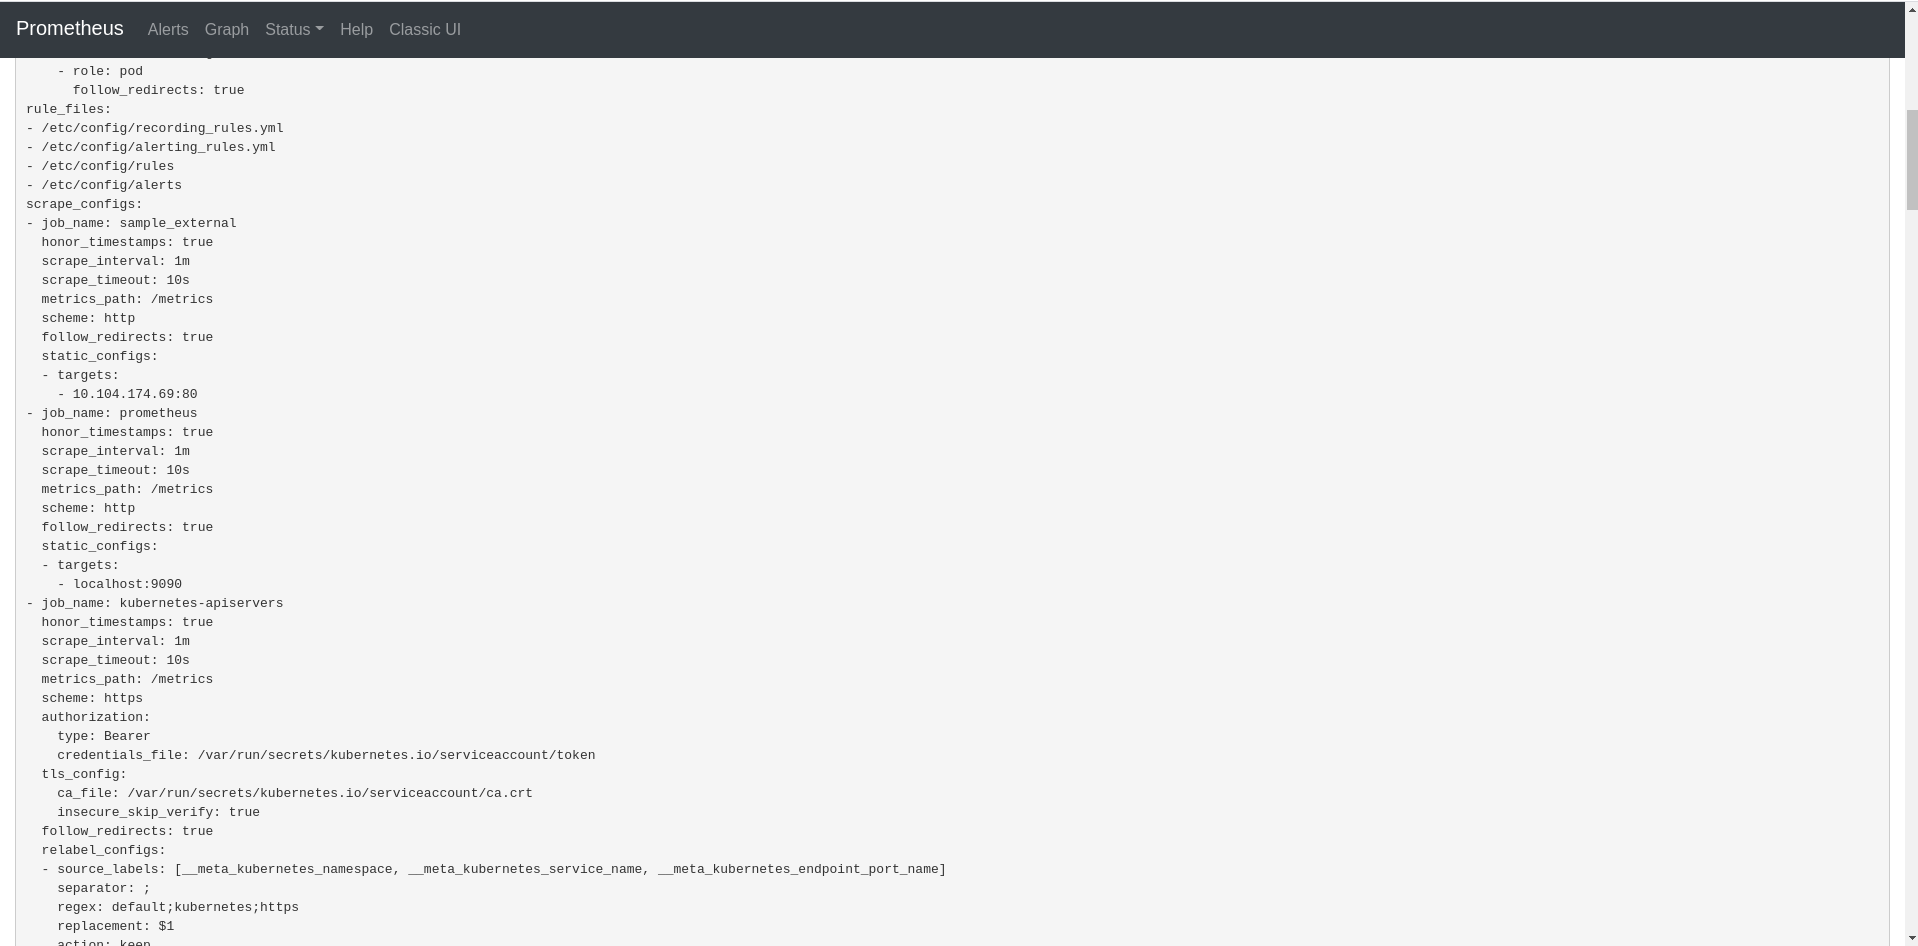
Open your browser and point to http://localhost:9090 you will see Prometheus UI. Go to Status > Configuration and you can see that your configuration has been added under scrape_configs:.
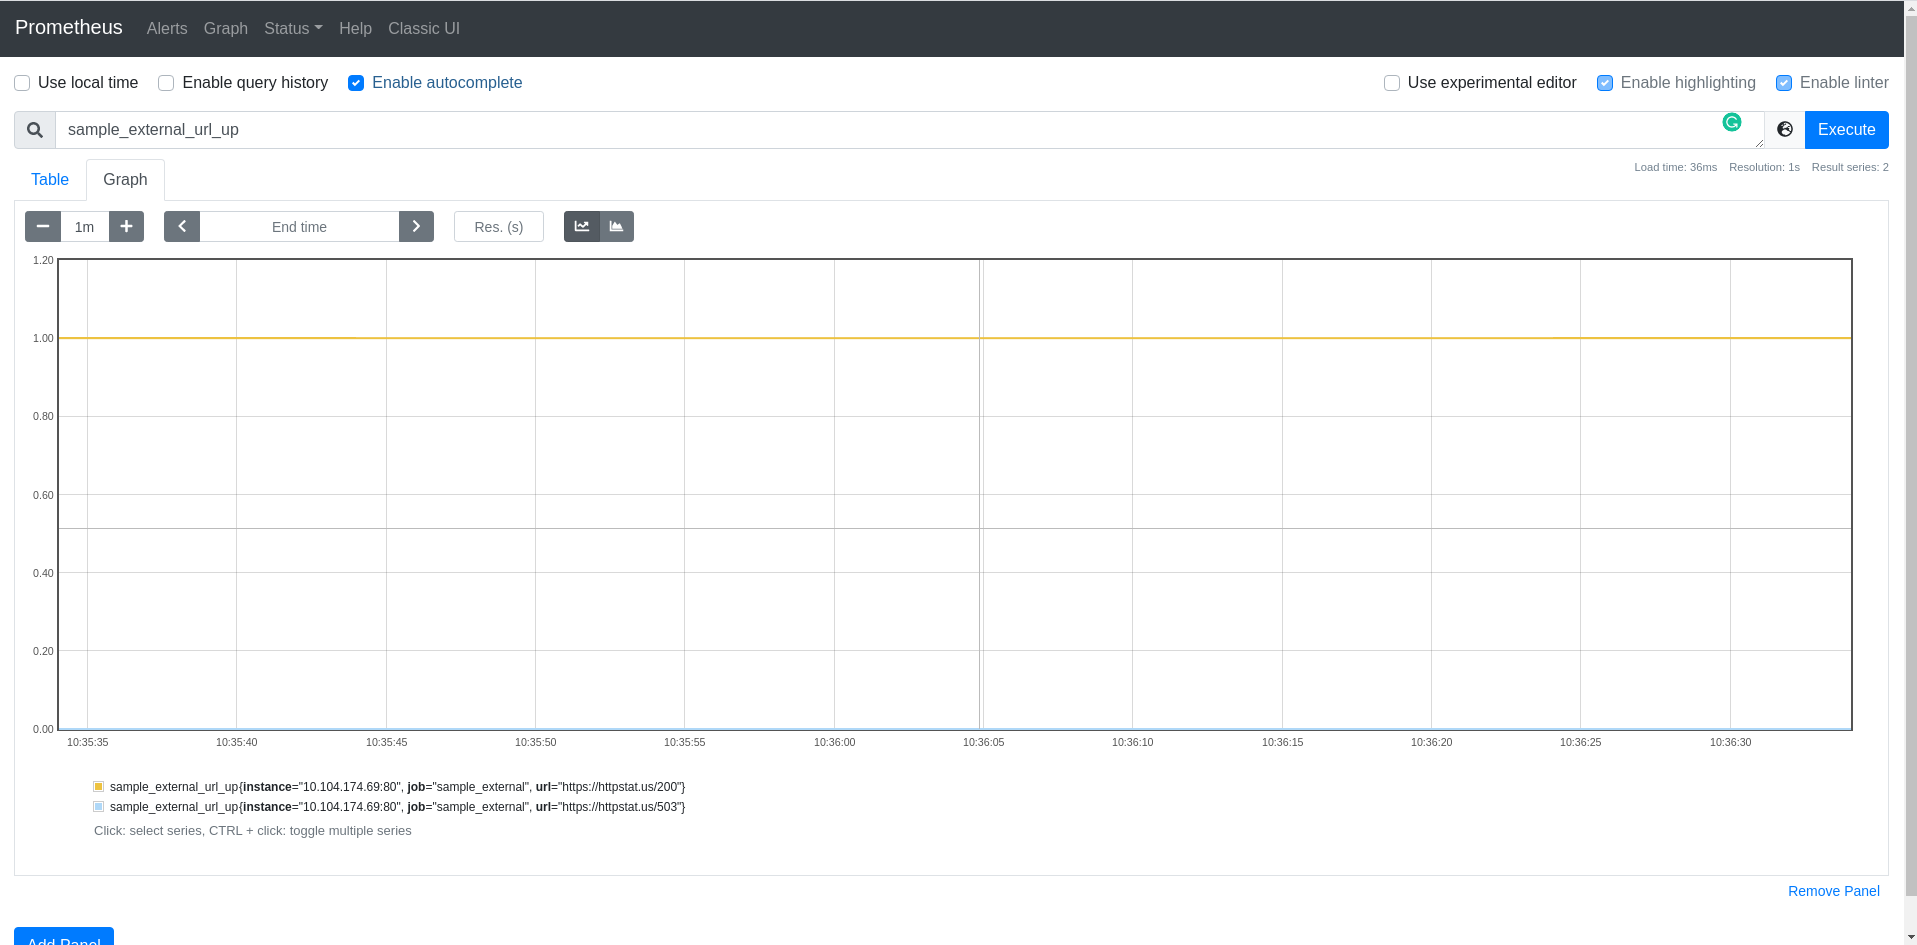
- Check Prometheus metrics collected from our Application
- Open Grafana
Open your browser and point to http://localhost:3000 you will see Grafana Login.
Enter the username and password we already collected to login.
- Open Grafana
Open your browser and point to http://localhost:3000 you will see Grafana Login.
Enter the username and password we already collected to login.
-
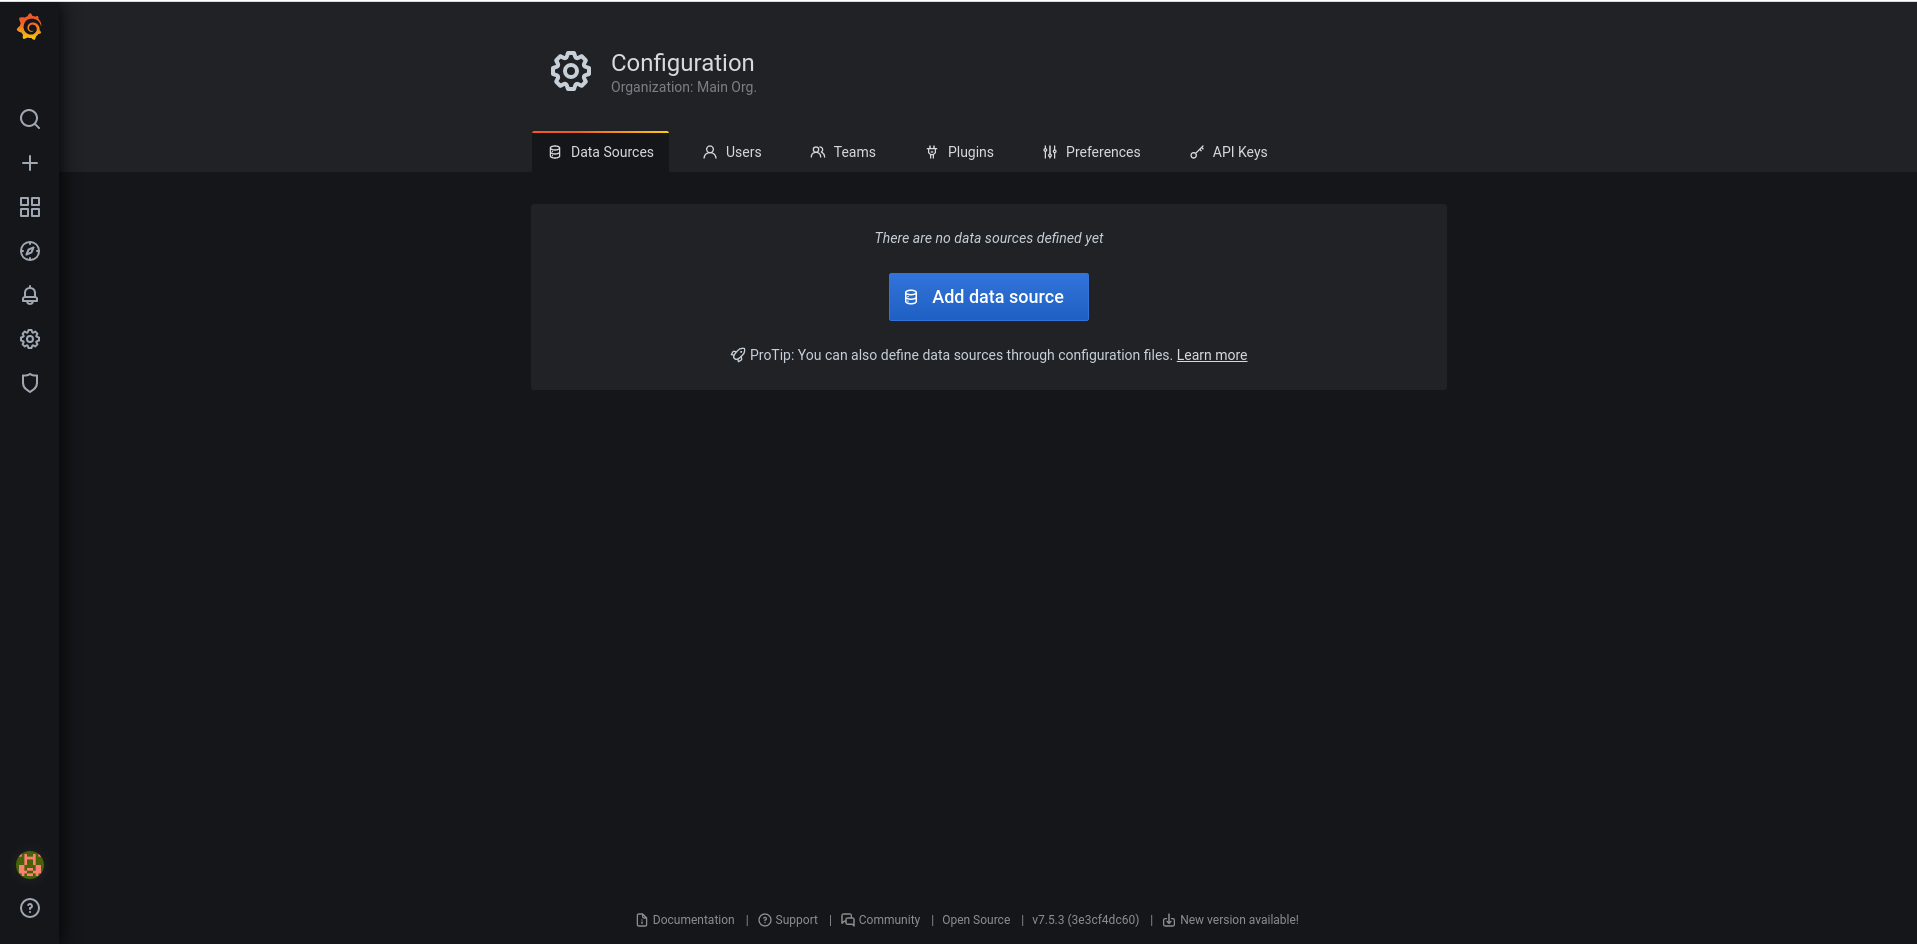
Click on Configuration > Data Sources
-
Click on Add data source
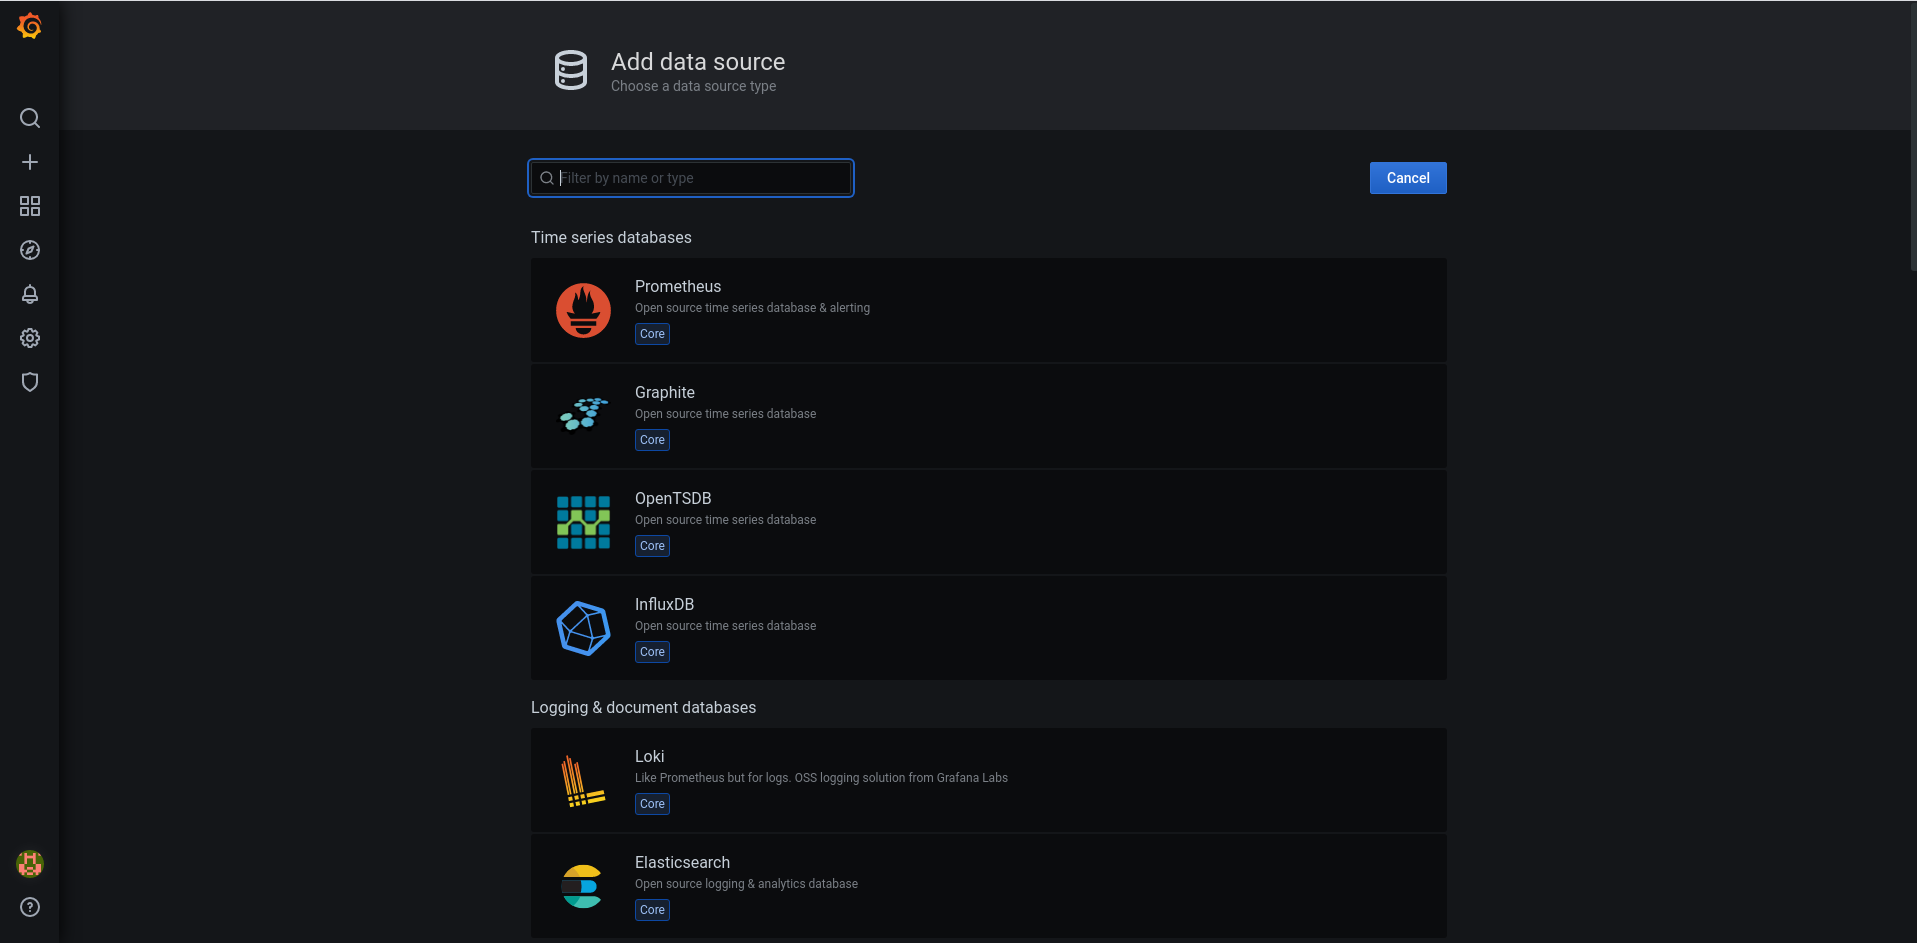
- Select Prometheus as the data source
- Check Prometheus cluster ip
kubectl get svc
Note:- Write down the ClusterIP for prometheus-server
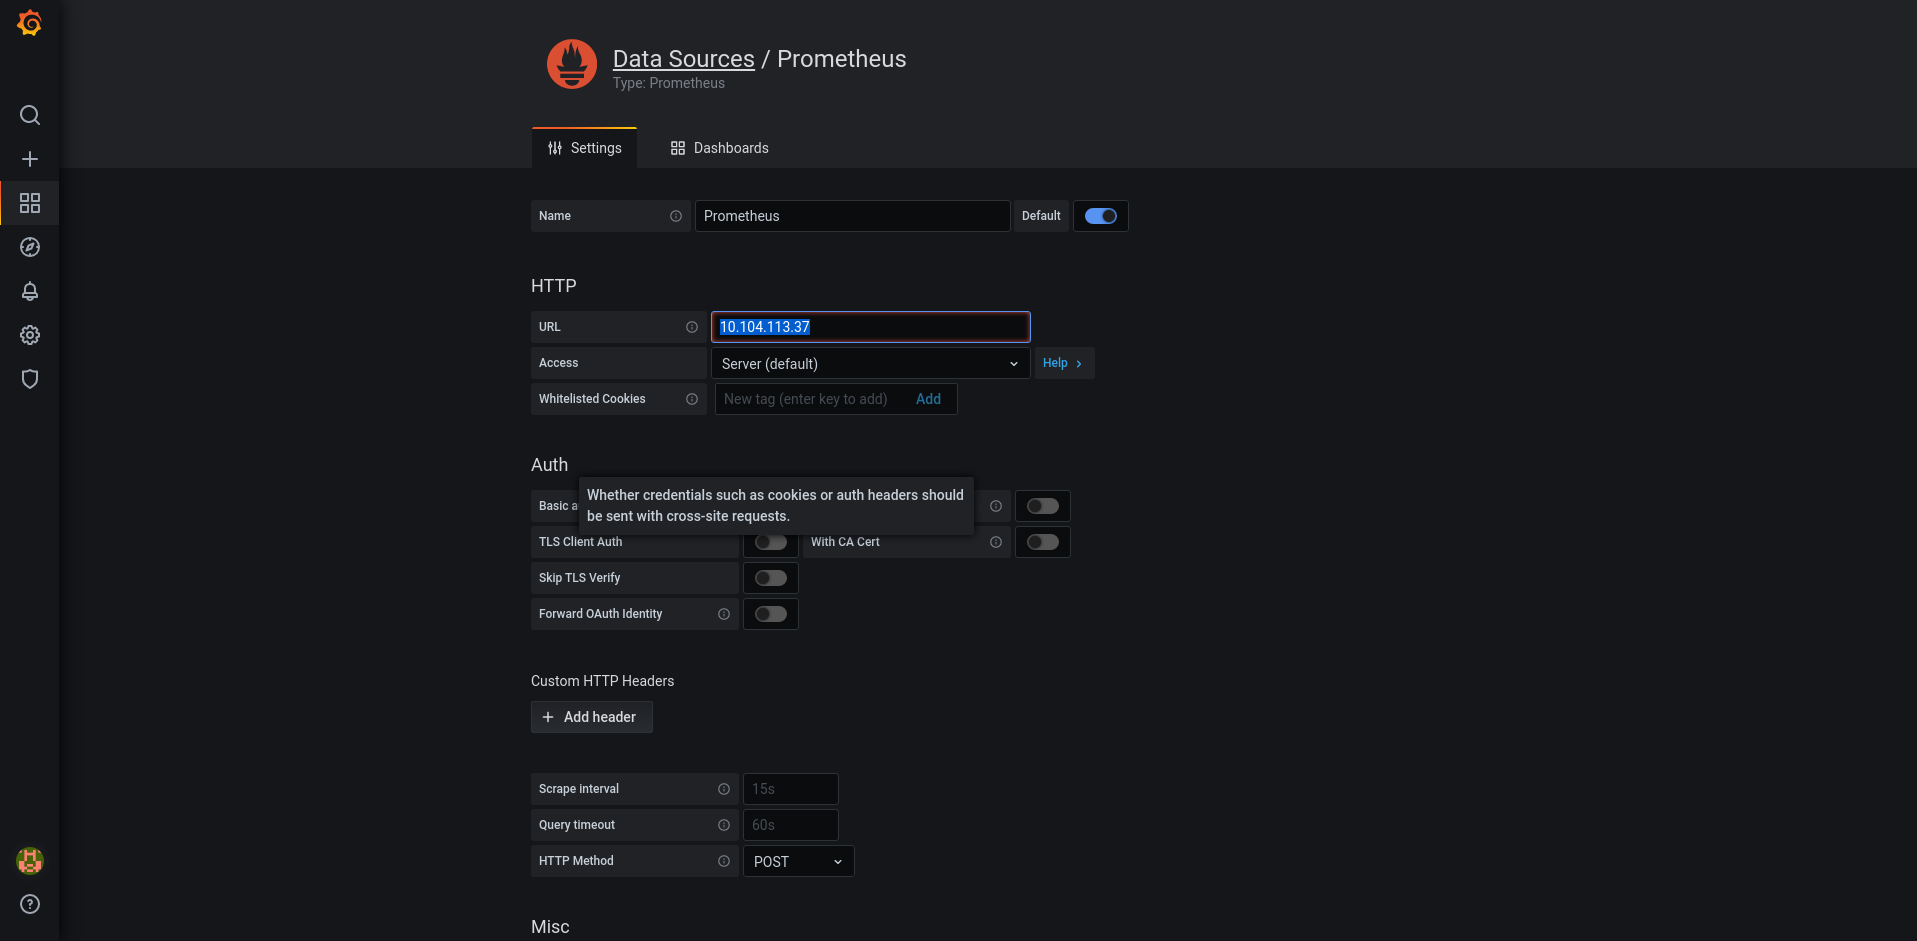
- Add the ClusterIP as the Prometheus url
- Click Save & Test
-
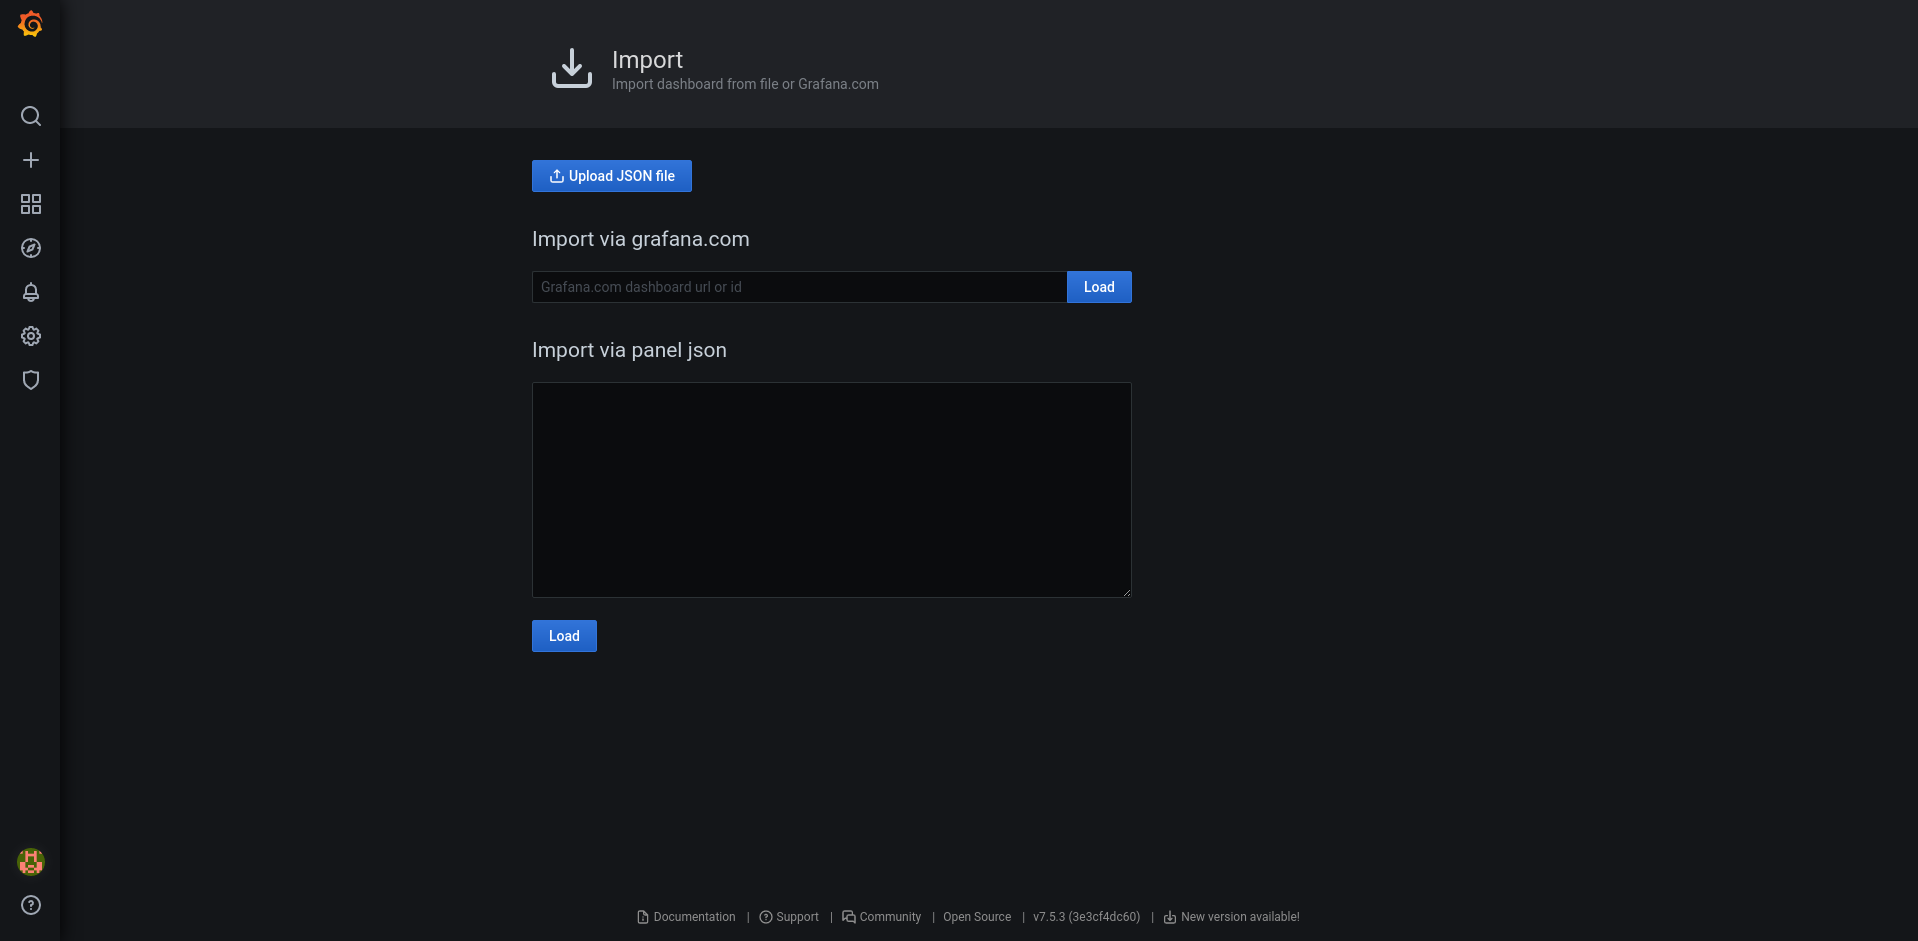
Click on Create > Import
-
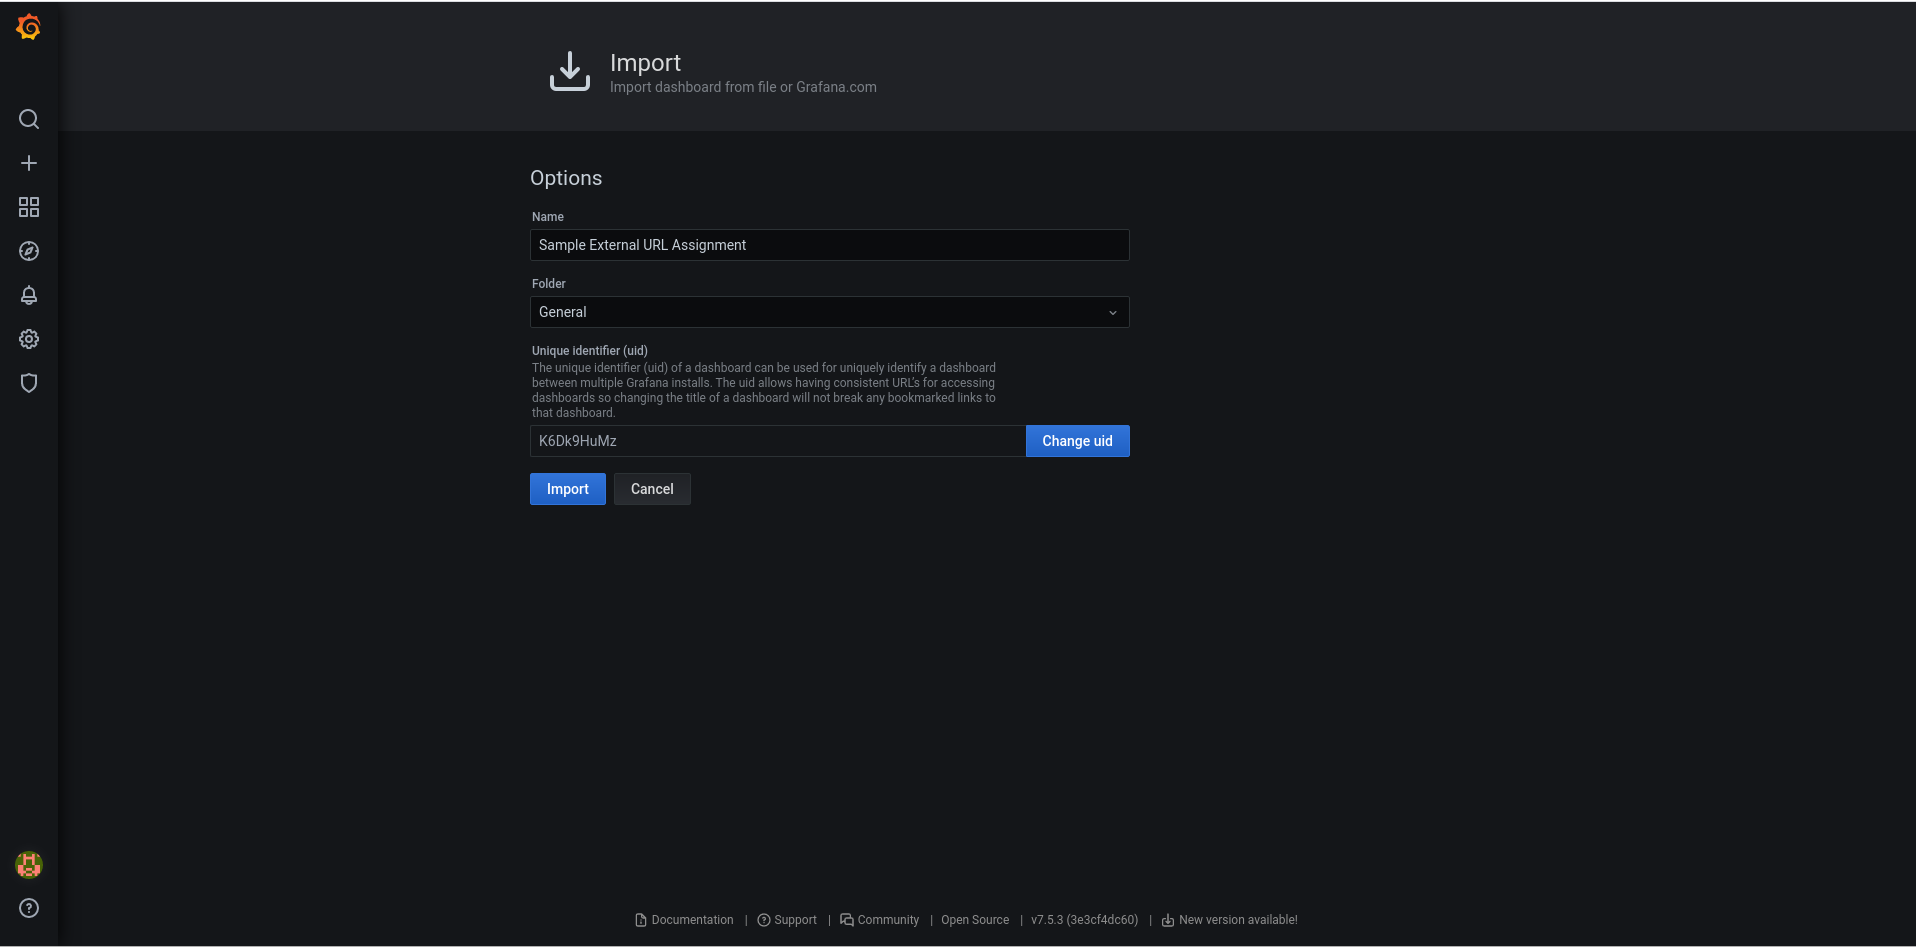
Click on Upload JSON file and select the file from the grafana folder within this repository.
- Click on Import button it will create the dashboard with the Prometheus metrics.
test2

