This repository was archived by the owner on Jan 10, 2023. It is now read-only.
Golang profiles in chrome tracing
You need to start profiling in your go code:
- add to source code:
  var cpuprofile = flag.String("cpuprofile", "", "cpu profile output")

  func main() {
    flag.Parse()
    if *cpuprofile != "" {
        f, err := os.Create(*cpuprofile)
        if err != nil {
            log.Fatal(err)
        }
        pprof.StartCPUProfile(f)
        defer pprof.StopCPUProfile()
    }
-
compile program
-
run it with flag
cpuprofile:
main.exe -cpuprofile=trace.pprof
Run cmd:
python sea_runtool.py -f gt --input trace.pprof-
you need protobuf for python installed to use this feature
-
trace should be written in
pprofformat, serialized withprotobufandgzipped -
trace should have
.pprofextension -
go runtime collects lightweight profiles without symbol info to see function names and file locations symbolize profiles and then convert:
go tool pprof -proto -output=trace_symbolized.pprof main.exe trace.pprof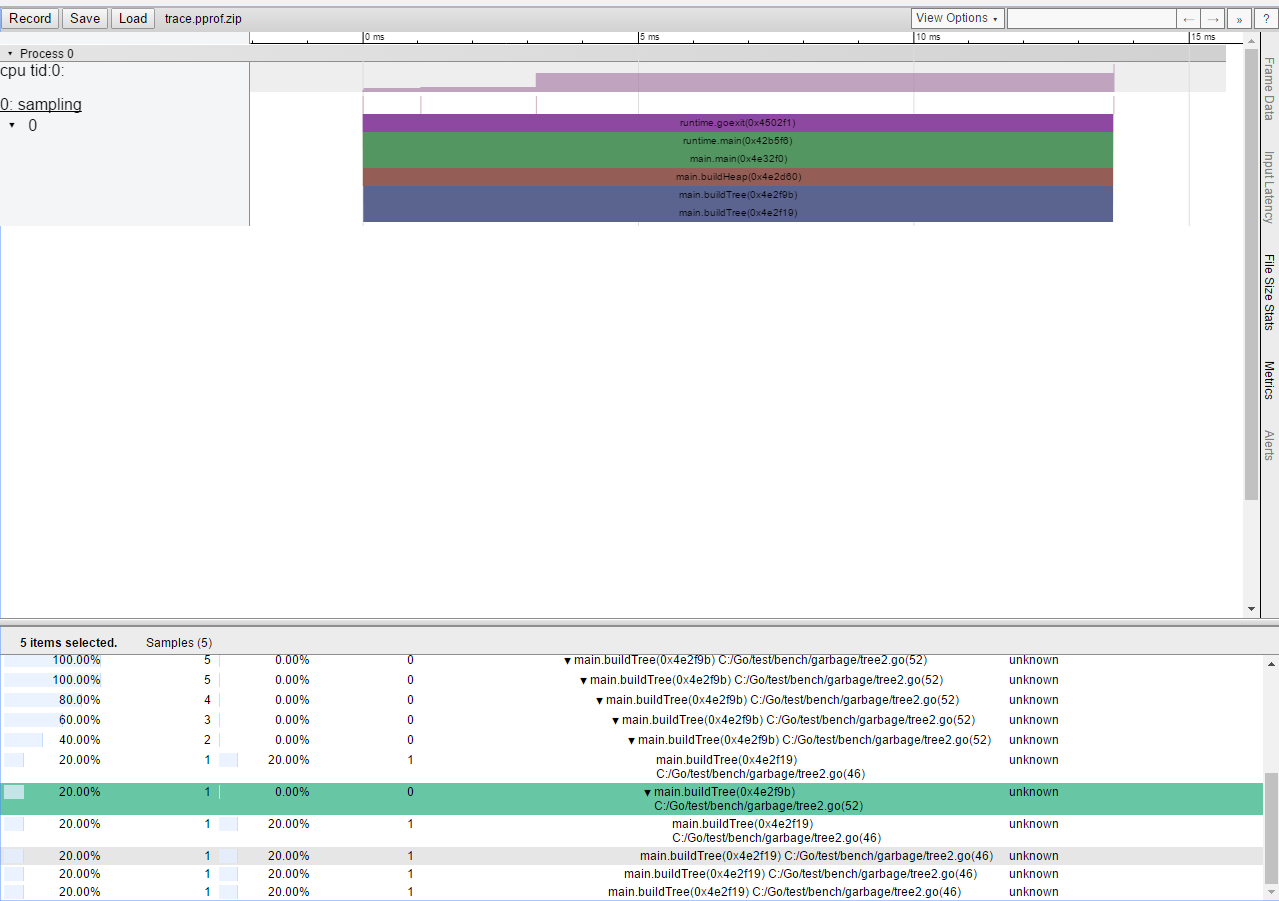
python sea_runtool.py -f gt --input trace_symbolized.pprofYou will get the trace, visit chrome://tracing and load it:
Special thanks to Kolistratova Daria for enabling of Golang profiling in Intel® Single Event API!