Use Python and unsupervised learning to predict if cryptocurrencies are affected by 24-hour or 7-day price changes. This project offers an exciting opportunity to explore the world of cryptocurrencies and develop a predictive model that can help cryptocurrency enthusiasts and traders make informed decisions.
Cryptocurrency markets are known for their volatility, and traders often seek to understand short-term (24-hour) and longer-term (7-day) price trends. In this challenge, your primary goals are as follows:
-
Data Collection: Gather relevant data on cryptocurrency prices, including historical price changes for both 24-hour and 7-day periods.
-
Data Preprocessing: Clean and preprocess the data, handling missing values, outliers, and other data quality issues.
-
Unsupervised Learning: Apply unsupervised learning techniques to discover patterns and relationships within the cryptocurrency data.
-
Classification Model: Build a predictive classification model to determine whether cryptocurrencies are affected by 24-hour or 7-day price changes.
-
Model Evaluation: Assess the performance of your model using appropriate evaluation metrics, such as accuracy, precision, recall, and F1-score.
You will have access to a dataset containing historical cryptocurrency price data, including features related to different cryptocurrencies, their prices, and price changes over 24-hour and 7-day periods. This dataset will serve as the foundation for your predictive modeling efforts.
-
Rename the
Crypto_Clustering_starter_code.ipynbfile asCrypto_Clustering.ipynb. -
Load the
crypto_market_data.csvinto a DataFrame. -
Get the summary statistics and plot the data to see what the data looks like before proceeding.
-
Use the
StandardScaler()module fromscikit-learnto normalize the data from the CSV file. -
Create a DataFrame with the scaled data and set the "coin_id" index from the original DataFrame as the index for the new DataFrame.
Use the elbow method to find the best value for k using the following steps:
- Create a list with the number of k values from 1 to 11.
- Create an empty list to store the inertia values.
- Create a
forloop to compute the inertia with each possible value ofk. - Create a dictionary with the data to plot the elbow curve.
- Plot a line chart with all the inertia values computed with the different values of
kto visually identify the optimal value fork. - Answer the following question in your notebook: What is the best value for
k?
Use the following steps to cluster the cryptocurrencies for the best value for k on the original scaled data:
- Initialize the K-means model with the best value for
k. - Fit the K-means model using the original scaled DataFrame.
- Predict the clusters to group the cryptocurrencies using the original scaled DataFrame.
- Create a copy of the original data and add a new column with the predicted clusters.
- Create a scatter plot using hvPlot as follows:
- Set the x-axis as "price_change_percentage_24h" and the y-axis as "price_change_percentage_7d".
- Color the graph points with the labels found using K-means.
- Add the "coin_id" column in the
hover_colsparameter to identify the cryptocurrency represented by each data point.
-
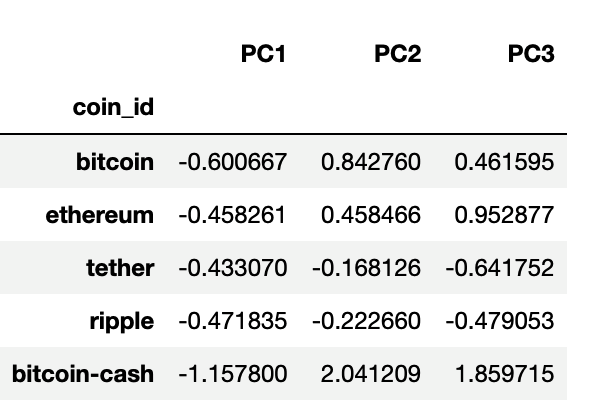
Using the original scaled DataFrame, perform a PCA and reduce the features to three principal components.
-
Retrieve the explained variance to determine how much information can be attributed to each principal component and then answer the following question in your notebook:
- What is the total explained variance of the three principal components?
-
Create a new DataFrame with the PCA data and set the "coin_id" index from the original DataFrame as the index for the new DataFrame.
Use the elbow method on the PCA data to find the best value for k using the following steps:
- Create a list with the number of k-values from 1 to 11.
- Create an empty list to store the inertia values.
- Create a
forloop to compute the inertia with each possible value ofk. - Create a dictionary with the data to plot the Elbow curve.
- Plot a line chart with all the inertia values computed with the different values of
kto visually identify the optimal value fork. - Answer the following question in your notebook:
- What is the best value for
kwhen using the PCA data? - Does it differ from the best k value found using the original data?
- What is the best value for
Use the following steps to cluster the cryptocurrencies for the best value for k on the PCA data:
- Initialize the K-means model with the best value for
k. - Fit the K-means model using the PCA data.
- Predict the clusters to group the cryptocurrencies using the PCA data.
- Create a copy of the DataFrame with the PCA data and add a new column to store the predicted clusters.
- Create a scatter plot using hvPlot as follows:
- Set the x-axis as "PC1" and the y-axis as "PC2".
- Color the graph points with the labels found using K-means.
- Add the "coin_id" column in the
hover_colsparameter to identify the cryptocurrency represented by each data point.
- Answer the following question:
- What is the impact of using fewer features to cluster the data using K-Means?
Data for this dataset was generated by edX Boot Camps LLC, and is intended for educational purposes only.

