-
Notifications
You must be signed in to change notification settings - Fork 26
Time Series
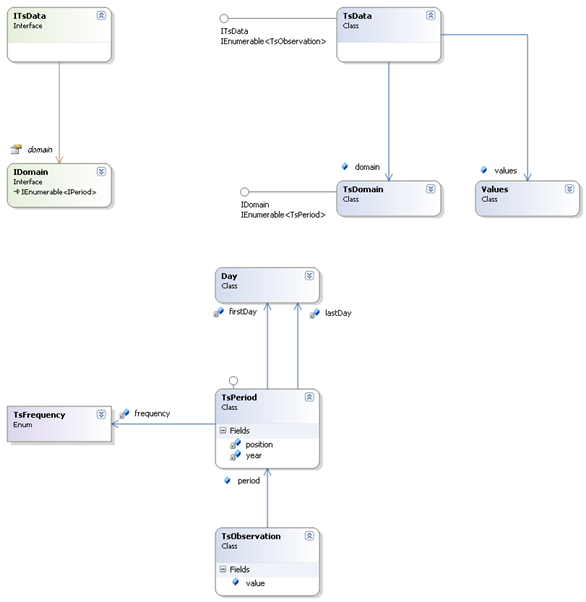
The time series model used for computation is defined in the packages ec.tstoolkit.timeseries.xxx. It is designed to allow easy manipulation, good performances, and to be adapted to the most frequent statistical operations on time series.
A time series (TsData object) is composed of its time domain (TsDomain object) and of an array of values (Values object), both of the same length. The domain is constant: it cannot be modified after the creation of the time series. On the other hand, if the number of values is also fixed, each of them can be modified at any time. The time domain is an array of adjacent periods (TsPeriod objects).
The time series treated by the model must have the following characteristics:
- Frequency: from the TsFrequency enumeration (number of periods by year corresponding to a divisor of 12).
- Domain: continuous; no limitation in length.
- Data: real values; the series can contain missing values (identified by Double.NaN).

Simple time series can be created following two distinct ways. The first one prioritizes the view of a time series as a collection of couples "date/value", the second one as an association between a continuous time domain and an array of values with the same length.
The first way is better suited for the creation of a time series whose domain is not well known (undefined frequency or length...); it also allows the building of a time series with observations at irregular intervals. The second way supposes that the domain is well known; in that case the creation process can be greatly optimized.
A TsDataCollector is an object designed to collect any couple of "date/value". At any moment, it can create a time series (more than 1 observation), given a frequency (that can be "Undefined"), and an aggregation type (None, Sum, Average, Last...), that defines the way to aggregate the values, if necessary. The resulting time series will contain missing values if there are some "holes" in the array of dates. If the frequency is unknown, the object searches for the smaller frequency, if any, such that every period of the domain contains at most one observation.
Through the TsDataCollector, it is easy to create time series of any admissible frequency from any set, regular or not, of time observations.
Example:
    TsDataCollector collector = new TsDataCollector();
    int n = 100;
    Day day = Day.toDay();
    Random rnd = new Random();
    TsData s = null;
    for (int i = 0; i < n; ++i) {
       // Add a new observation (date, value)
       collector.addObservation(day.toCalendar().getTime(), i);
       // Creates a new time series. The most suitable frequency is automatically choosen
       // The creation will fail if the collector contains less than 2 observations
       s = collector.make(TsFrequency.Undefined, TsAggregationType.None);
       if (i >= 2) {
          assertTrue(s != null);
          assertTrue(s.getLength() >= i + 1);
       }
       day = day.plus(31 + rnd.nextInt(10));
    }

    *******************************
    TsDataCollector collector = new TsDataCollector();
    int n = 10000;
    Day day = Day.toDay();
    Random rnd = new Random();
    for (int i = 0; i < n; ++i) {
       // Add a new observation (date, value)
       // New observation may belong to the same period (month, quarter...)
       collector.addObservation(day.toCalendar().getTime(), i);
       day = day.plus(rnd.nextInt(3));
    }
    // Creates a new time series. The frequency is specified
    // The observations belonging to the same period are aggregated following the
    // specified method
    TsData s =  collector.make(TsFrequency.Quarterly, TsAggregationType.Sum);
    DescriptiveStatistics stats=new DescriptiveStatistics(s);
assertTrue(Math.round(stats.getSum()) == n*(n-1)/2 );A time series can be directly created from its domain or from its starting period and an array of data (doubles). Once a series has been created from its domain, it contains only missing values that can of course be initialized later. Direct creation should be the preferred method when the number of observations is known.
Be aware that the periods of the year are always 0-based indexed. (Jan-2006 is {TsFrequency.Monthly, 2006, 0}, QIII-2006 is TsFrequency.Quarterly, 2006, 2}...).
Example
    double[] values = new double[]{1,2,3,4,5,6,7,8,9,10,11,12,13,14,15};
    // The monthly series will start in January 2012
    TsPeriod start=new TsPeriod(TsFrequency.Monthly, 2012, 0);
    // Creates directly the series. The last parameter indicates that the data are cloned.
    TsData s1=new TsData(start, values, true);

    TsDomain dom=new TsDomain(start, values.length);
    // Creates a series from its domain
    TsData s2=new TsData(dom);
    // All the data are missing
    assertTrue(s2.getObsCount() == 0);
    // Initialize the data
    for (int i=0; i<values.length; ++i)
       s2.set(i, values[i]);
    // The series are of course identical
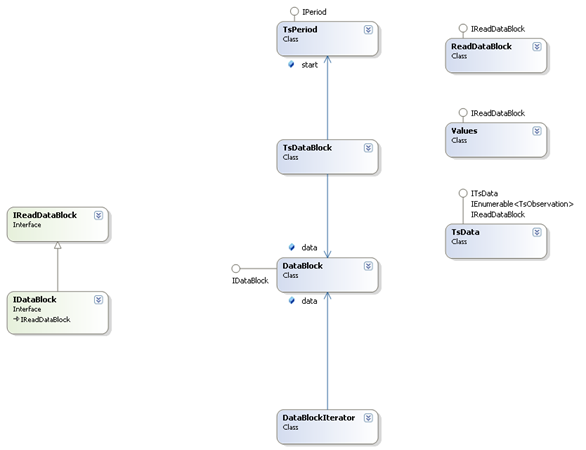
assertTrue(s1.equals(s2));Beside the direct access to the observations of a TsData, through its get(), set() methods (using 0-based indexes), users can retrieve information by means of a TsDataBlock or by means of an iterator (YearIterator, PeriodIterator). Basically, a TsDataBlock is just a DataBlock enriched by information corresponding to the time periods of its elements and YearIterator, PeriodIterator are iterators on specific TsDataBlocks of a series, i.e. years or same periods of the year. Working on time series through TsDataBlock is always more efficient than using a direct access to the data.

example:
    // Computes a few statistics by period
    PeriodIterator p = new PeriodIterator(Data.X);
    while (p.hasMoreElements()) {
       TsDataBlock cur = p.nextElement();
       DescriptiveStatistics stats = new DescriptiveStatistics(cur.data);
       System.out.print(cur.start.getPeriodString());
       System.out.print('\t');
       System.out.print(stats.getAverage());
       System.out.print('\t');
       System.out.print(stats.getMedian());
       System.out.print('\t');
       System.out.print(stats.getMin());
       System.out.print('\t');
       System.out.println(stats.getMax());
    }

    // Same exercise by year
    YearIterator y = new YearIterator(Data.X);
    while (y.hasMoreElements()) {
       TsDataBlock cur = y.nextElement();
       DescriptiveStatistics stats = new DescriptiveStatistics(cur.data);
       System.out.print(cur.start.getYear());
       System.out.print('\t');
       System.out.print(stats.getAverage());
       System.out.print('\t');
       System.out.print(stats.getMedian());
       System.out.print('\t');
       System.out.print(stats.getMin());
       System.out.print('\t');
       System.out.println(stats.getMax());
}Usual operations on time series are enclosed in the definition of the TsData class. It concerns, for instance, binary operators between time series, like +, -, * or unary transformation like exp, log, power, moving average/median...It should be noted that those operations always generate new time series objects, leaving the existing ones unchanged.
We provide below a raw implementation of chain-linking with annual overlap. The code is a good example of the use of the methods on time series provided by the TsData class as well as the use of iterators on time series.
    // Example taken from the IMF manual
    // Initialization of the figures
    double[] qa=new double[]{67.4,69.4,71.5,73.7,76,78.3,80.6,83.1,85.5,88.2,90.8,
    93.5};
    double[] pa=new double[]{6.1,5.7,5.3,5,4.5,4.3,3.8,3.5,3.4,3.1,2.8,2.7};
    double[] qb=new double[]{57.6,57.1,56.5,55.8,55.4,54.8,54.2,53.6,53.2,52.7, 52.1, 52};
    double[] pb=new double[]{8.0,8.6,9.4,10,10.7,11.5,11.7,12.1,12.5,13,13.8,14.7};

    // Q for quantities, P for price, V for values. Products A and B
    // Previous year
    TsData QAy = new TsData(TsFrequency.Yearly, 1997, 0, 1);
    TsData PAy = new TsData(TsFrequency.Yearly, 1997, 0, 1);
    TsData QBy = new TsData(TsFrequency.Yearly, 1997, 0, 1);
    TsData PBy = new TsData(TsFrequency.Yearly, 1997, 0, 1);
    QAy.set(0, 251.0);
    PAy.set(0, 7.0);
    QBy.set(0, 236.0);
    PBy.set(0, 6.0);
    TsData Vy = TsData.add(TsData.multiply(QAy, PAy), TsData.multiply(QBy, PBy));

    // Quarterly series
    TsData QAq = new TsData(TsFrequency.Quarterly, 1998, 0, qa, true);
    TsData PAq = new TsData(TsFrequency.Quarterly, 1998, 0, pa, true);
    TsData QBq = new TsData(TsFrequency.Quarterly, 1998, 0, qb, true);
    TsData PBq = new TsData(TsFrequency.Quarterly, 1998, 0, pb, true);

    // Chain-linking  by annual overlap
    // STEP 1. Computes the annual (weighted) price index for A and B.
    TsData VAq = TsData.multiply(QAq, PAq);
    TsData VAy = VAq.changeFrequency(TsFrequency.Yearly, TsAggregationType.Sum, true);
    QAy = QAy.update(QAq.changeFrequency(TsFrequency.Yearly, TsAggregationType.Sum, true));
    PAy = PAy.update(TsData.divide(VAy, QAy));

    TsData VBq = TsData.multiply(QBq, PBq);
    TsData VBy = VBq.changeFrequency(TsFrequency.Yearly, TsAggregationType.Sum, true);
    QBy = QBy.update(QBq.changeFrequency(TsFrequency.Yearly, TsAggregationType.Sum, true));
    PBy = PBy.update(TsData.divide(VBy, QBy));

    // Total value (quarterly)
    TsData Vq = TsData.add(VAq, VBq);
    // Total value (annual)
    Vy = Vy.update(Vq.changeFrequency(TsFrequency.Yearly, TsAggregationType.Sum, true));

    // STEP2. Compute quantities expressed in the average prices of previous year.
    // Create first Qq, an empty series (with the same time domain as the values)
    // that will contain the data
    TsData Qq = new TsData(Vq.getDomain());

    // Iterates through the years for computing the series at the price of previous year
    YearIterator yq = new YearIterator(Qq);
    YearIterator yqa = new YearIterator(QAq);
    YearIterator yqb = new YearIterator(QBq);
    while (yq.hasMoreElements()) {
       TsDataBlock qcur = yq.nextElement();
       TsDataBlock qacur = yqa.nextElement();
       TsDataBlock qbcur = yqb.nextElement();
       TsPeriod prev = TsPeriod.year(qcur.start.getYear() - 1);
       // Qq=PAy(y-1)*QAq
       // Qq=Qq + PBy(y-1)*QBq
       qcur.data.setAY(PAy.get(prev), qacur.data);
       qcur.data.addAY(PBy.get(prev), qbcur.data);
    }

    TsData Qy = Qq.changeFrequency(TsFrequency.Yearly, TsAggregationType.Sum, true);

    // STEP 3. Chain the indexes.
    // The current index is stored in idx.
    double idx = 100;
    int ifreq = Qq.getFrequency().intValue();
    yq.reset();
    while (yq.hasMoreElements()) {
       // the index is applied to the quantities Qq, divided by the average value of
       // previous year. It is increased by the growth of the year
       // (value(t), expressed in price of (t-1) divided by value in t-1)
       TsDataBlock qcur = yq.nextElement();
       TsPeriod prev = TsPeriod.year(qcur.start.getYear() - 1);
       double val0=Vy.get(prev);
       double val1=qcur.data.sum();
       qcur.data.mul(idx/(val0/ifreq));
       // increase the index by the growth of this year
       idx*=val1/val0;
    }
    System.out.println(Qq);

    //////////////////////////////////////

    // Fixed year index is computed in a trivial way
    TsPeriod ybase = TsPeriod.year(1997);
    TsData Qa=QAq.times(PAy.get(ybase));
    TsData Qb=QBq.times(PBy.get(ybase));

    TsData Qq2=TsData.add(Qa, Qb).index(ybase, 100);
System.out.println(Qq2);- Overview
- Basic concepts
- Statistical concepts
- Algorithms
- RegArima modeling
- Seasonal adjustment
- Outliers detection
- Various