Tablesaw is a dataframe and visualization library that supports loading, cleaning, transforming, filtering, and summarizing data. If you work with data in Java, it may save you time and effort. Tablesaw also supports descriptive statistics and can be used to prepare data for working with machine learning libraries like Smile, Tribuo, H20.ai, DL4J.
- Import data from RDBMS, Excel, CSV, TSV, JSON, HTML, or Fixed Width text files, whether they are local or remote (http, S3, etc.)
- Export data to CSV, JSON, HTML or Fixed Width files.
- Combine tables by appending or joining
- Add and remove columns or rows
- Sort, Group, Filter, Edit, Transpose, etc.
- Map/Reduce operations
- Handle missing values
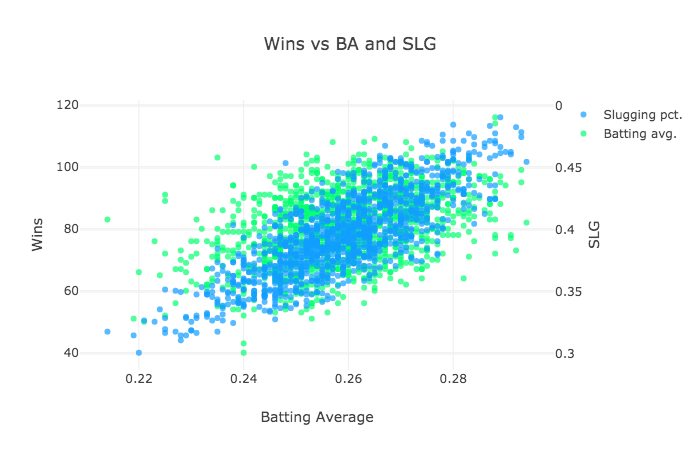
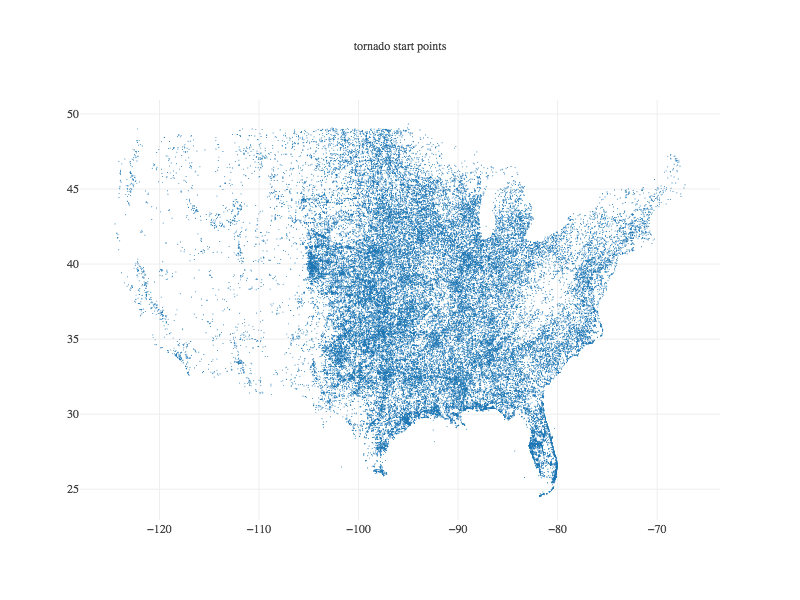
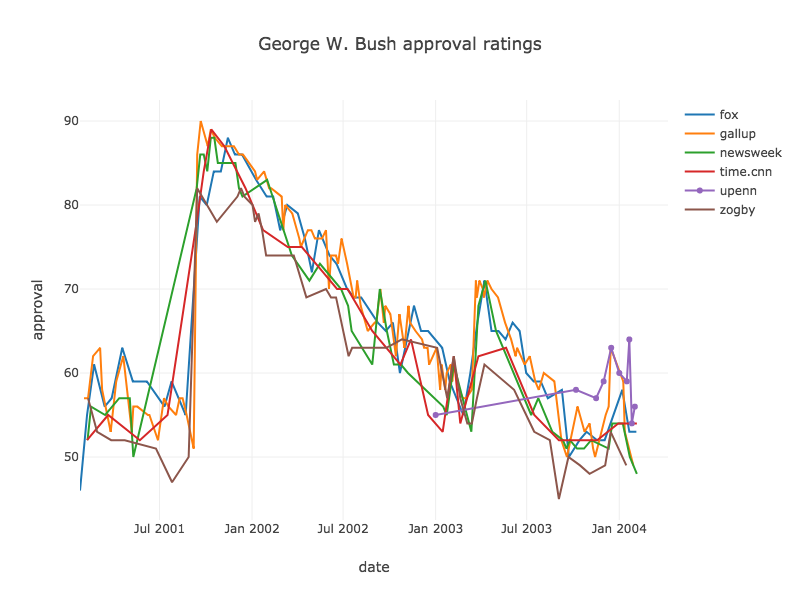
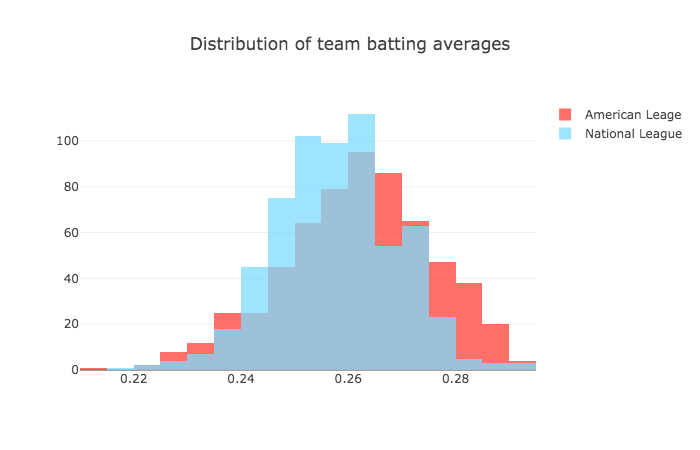
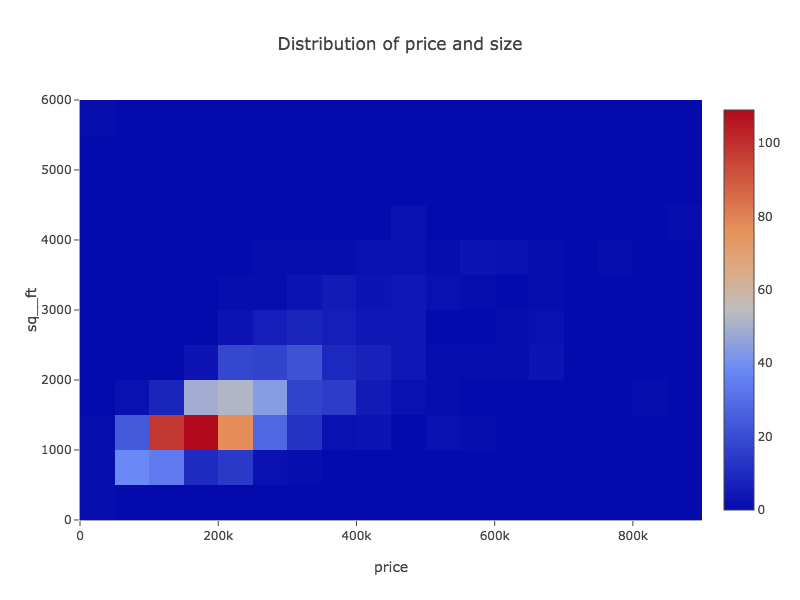
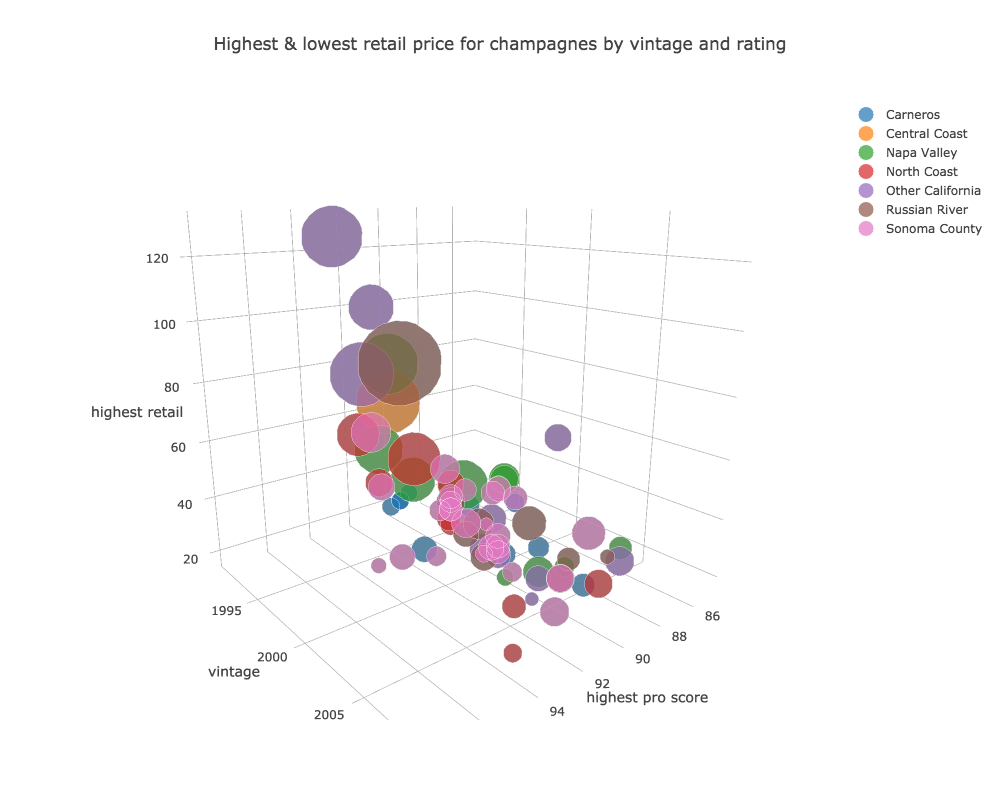
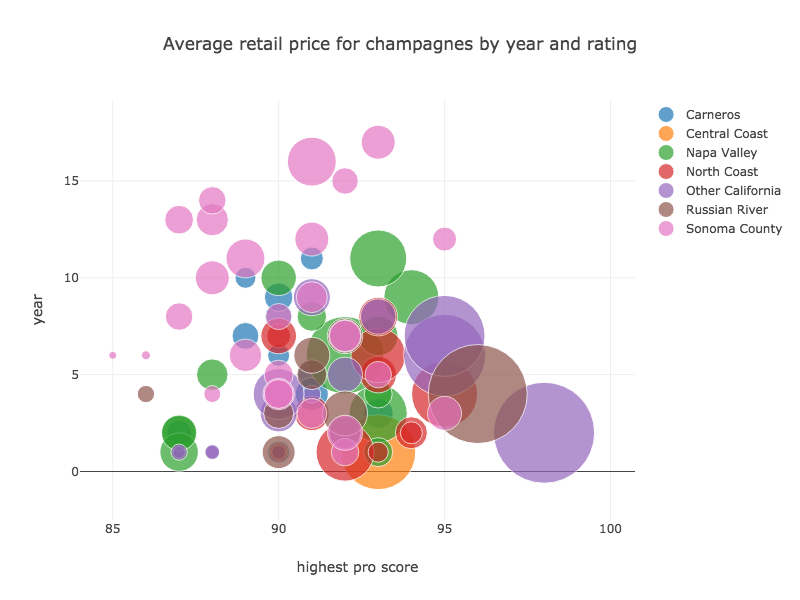
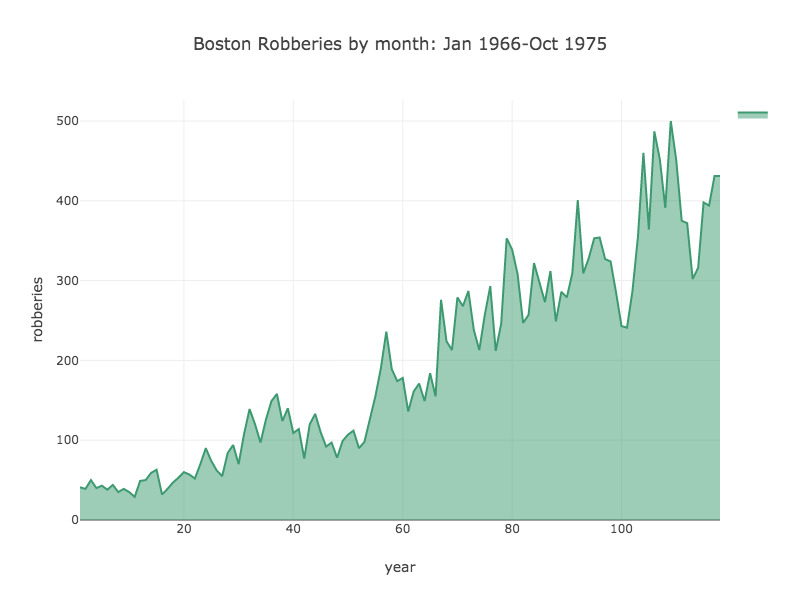
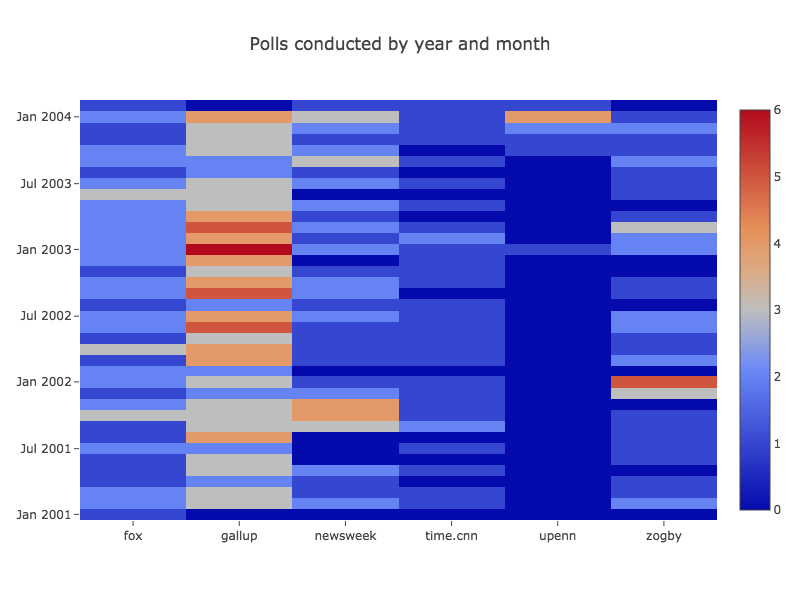
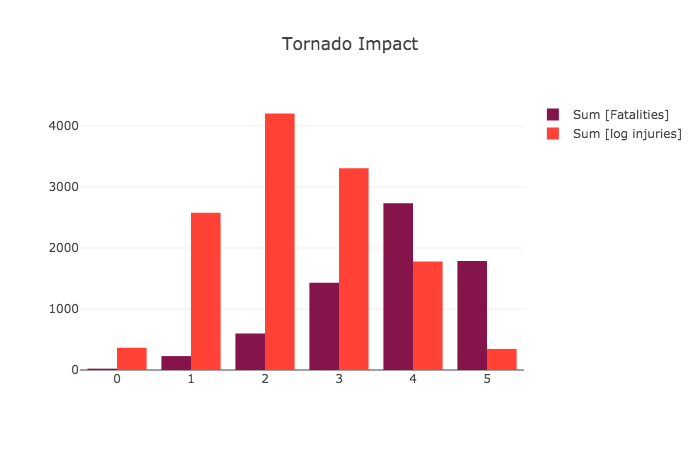
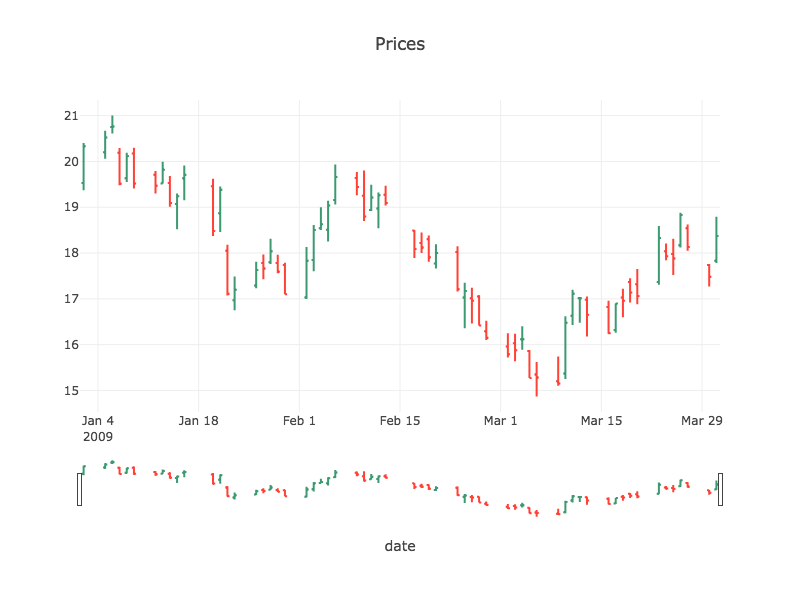
Tablesaw supports data visualization by providing a wrapper for the Plot.ly JavaScript plotting library. Here are a few examples of the new library in action.
 |
 |
 |
|---|---|---|
 |
 |
 |
 |
 |
 |
 |
 |
 |
 |
 |
 |
- Descriptive stats: mean, min, max, median, sum, product, standard deviation, variance, percentiles, geometric mean, skewness, kurtosis, etc.
Add tablesaw-core to your project. You can find the version number for the latest release in the release notes:
<dependency>
    <groupId>tech.tablesaw</groupId>
    <artifactId>tablesaw-core</artifactId>
    <version>VERSION_NUMBER_GOES_HERE</version>
</dependency>
You may also add supporting projects:
tablesaw-beakerx- for using Tablesaw inside BeakerXtablesaw-excel- for using Excel workbookstablesaw-html- for using HTMLtablesaw-json- for using JSONtablesaw-jsplot- for creating charts
External supporting projects - outside of this organization:
- tablesaw-parquet - for using the Apache Parquet file format with Tablesaw (report issue)
- Start here: https://jtablesaw.github.io/tablesaw/gettingstarted
- Then see our documentation page: https://jtablesaw.github.io/tablesaw/ and the Tablesaw User Guide.
- Ask questions, make suggestions, or tell us how you're using Tablesaw in the new GitHub discussions forum.
- Feature requests and bug reports can be made on the issues tab.
- We recommend trying Tablesaw inside Jupyter notebooks, which lets you experiment with Tablesaw in a more interactive manner. Get started by installing BeakerX and trying the sample Tablesaw notebook
- A second way to use Tablesaw inside Jupyter notebooks is with IJava, which has built-in support for Tablesaw. Gary Sharpe has written an excellent tutorial that shows you how to use Tablesaw plots. Gary has written a number of other tutorials that feature Tablesaw:
- A third approach is to use Google Colab. Again, Gary Sharpe has an excellent tutorial:Getting Started with Dataframes using Java and Google Colab
- Eclipse uses may find etablesaw useful. It provides Eclipse integration aimed at turning Eclipse into a data workbench.
- You may utilize Tablesaw with many machine learning libraries. To see an example of using Tablesaw with Smile check out the sample Tablesaw Jupyter notebook
- You may use quandl4j-tablesaw if you'd like to load financial and economic data from Quandl into Tablesaw. This is demonstrated in the sample Tablesaw notebook as well
