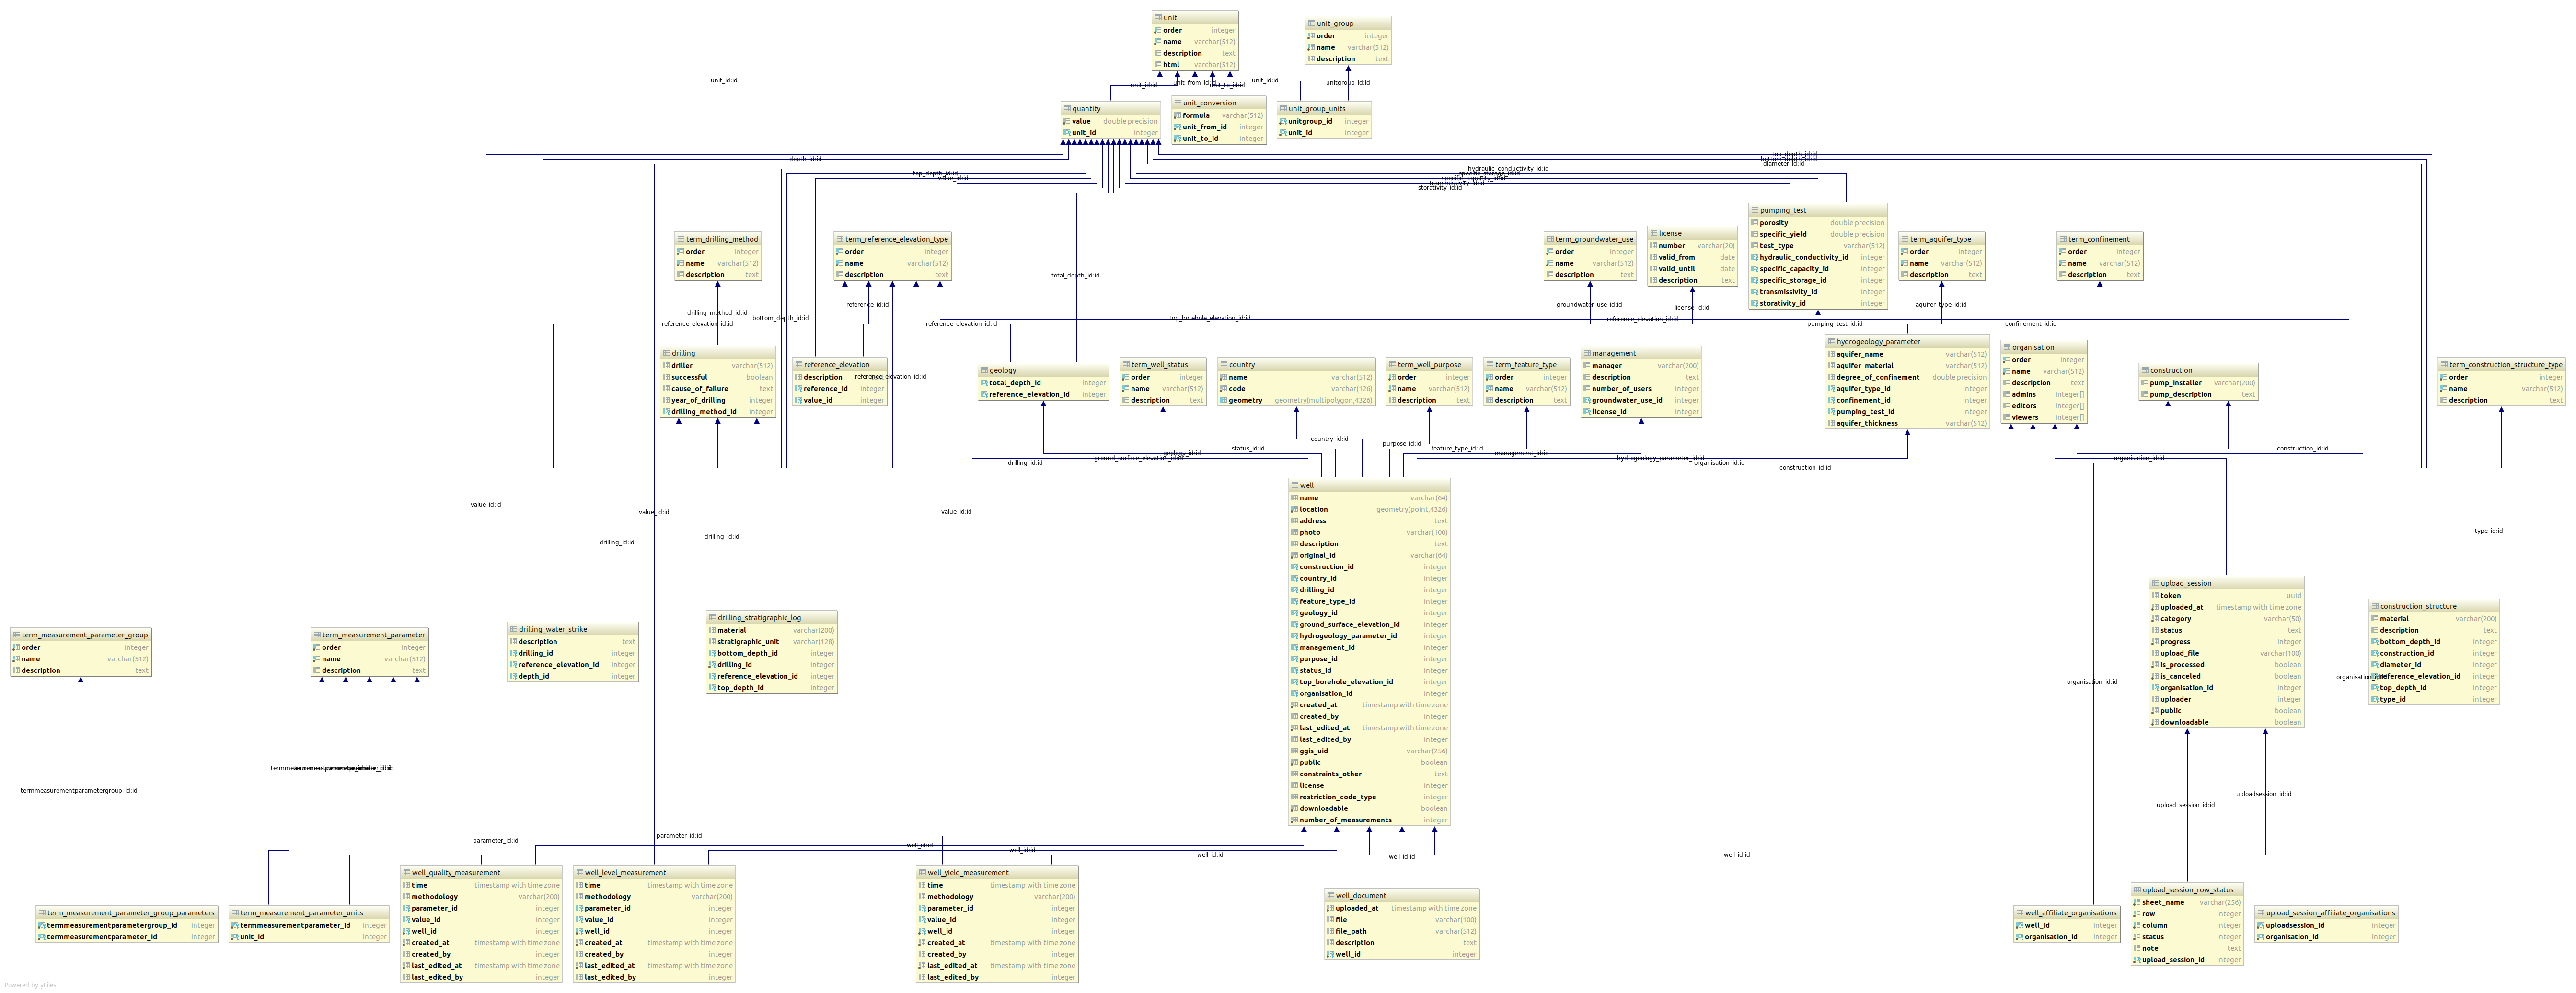
A PostgreSQL schema implementing the groundwater interchange schema defined in GWML2
Groundwater is django app. to add it, you need to put gwml2 into INSTALLED_APP
And this into urls
url(r"^groundwater/", include("gwml2.urls")),
django-braces==1.14.0
django-admin-sortable==2.1.8
openpyxl==3.0.5
pyexcel_xls
pyexcel_xlsx
Run python manage.py update_fixtures to run all fixtures
the groundwater will be added into your "default" database.
if you want to add it into new database, please prepare:
1. create database from your postgres with specific database name
2. add postgis config in the database by "CREATE EXTENSION postgis;"
3. on django settings add secondary database config
4. add GWML2_DATABASE_CONFIG for the name of the config database that you create before
5. add Router for gwml2 in settings by DATABASE_ROUTERS = ["gwml2.router.GWML2Router"]
6. to migrate the data, do on django "python manage.py migrate --database=<database config name>. e.g: python manage.py migrate --database=gwml2"
example of settings:
GWML2_DATABASE_CONFIG = "gwml2"

DATABASES = {
  "default": {
    "NAME": "django",
    "USER": "password",
    "PASSWORD": "password",
    "HOST": "postgres",
    "PORT": 5432,
    "ENGINE": "django.contrib.gis.db.backends.postgis"
    },
  "gwml2": {
    "NAME": "groundwater",
    "USER": "user",
    "PASSWORD": "password",
    "HOST": "postgres",
    "PORT": 5432,
    "ENGINE": "django.contrib.gis.db.backends.postgis"
   }
 }

DATABASE_ROUTERS = ["gwml2.router.GWML2Router"]
Here is model diagram of gwml2
Here's a nifty way to do it using pycharm:
- Connect your database using pycharm, so it will appear on the database tab as below:


