A very simple basic groovy report library that wraps DynamicReports(http://www.dynamicreports.org/) to make report creation for a small common subset of charts easier.
- Mainly supports barChart like graphs and pie charts
- Automatic column type detection
- Easily build grouped columns
- Automatic detection for columns to use as series and category axis
- Easy grouping of data
- Provides easy customization when needed
- Easily tilt chart label with a simple flag
- Easily create sub reports
Gradle Dependency: compile 'com.omnitech:csv-graphs:1.3'
Repository http://omnitech.co.ug/m2/releases
import csvgraphs.CSVGraph
import static net.sf.dynamicreports.report.builder.DynamicReports.cht
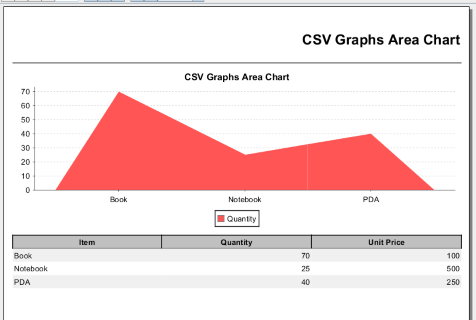
def data = [
['Item', 'Quantity', 'Unit Price'],
['Book', 70, 100],
['Notebook', 25, 500],
['PDA', 40, 250]
]
new CSVGraph('CSV Graphs Area Chart', data)
.setChart(cht.areaChart())
.setColumnNamesForChart('Item', 'Quantity')
.report
.show()The above will produce: