Air Quality Mesasurement
With Corona air-quality measurement has gained some more interest. Atrium provides several drivers that can be used to perform air-quality measurments. This example shows, how to setup an air-quality measurement device with a display and data submission to MQTT and Influx, so that you can also visualize the development of individual signals over time with Grafana on your smartphone, tablet or PC.
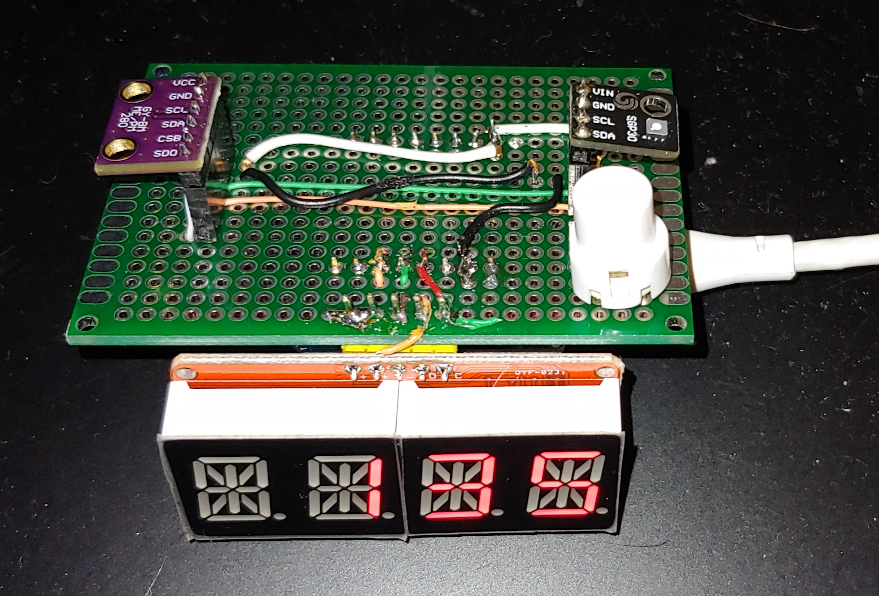
This setup uses an LED display to show the current air temperature, humidity, and pressure (BME280), as well as CO2 and TVOC (SGP30).
To solder your own device, get the folloing parts:
- Wemos D1 Mini board (one with at least 4MB of flash, not 1MB, but the Version does not matter)
- a BME280 sensor on a sample board
- a SGP30 sensor on a demo board
- a 4 digit 14-segment LED display with HT16K33
- a push-button
- a 2.54mm prototype board of about 5cm x 7cm
- some of the 2.54mm headers for mounting the BME280 and CCS811B
- wrapping wire with multiple colors
- wires for VCC and ground (not the very thin wrapping wires!)
Additionally, you need a soldering-iron, tin-solder, a micro-USB cable, and some patience and time.
The schematic is as shown in the picture below. There are no small parts, so soldering is pretty easy. Most of the soldering is related to supply and ground connections as well as the I2C bus.

The I2C bus is depcited as using GPIO5 for SCL and GPIO4 for SDA. But actually, you can use any GPIO you like, as the I2C bus on ESP8266 is only a software implementation anyway. Therefore, to get it up and running with Atrium, you need to configure it anyway. Atrium will detect and setup devices on the I2C bus auto-magically.
When soldering, be sure to provide the correct supply voltage to the individual parts. The 14-semgent LEDs require 5V, while the sensor devices require 3.3V, and ground being shared. Make sure that you use thick enough wires for suppying 3.3V, 5V, and ground. I had a setup with wrap-wires, which booted and where the sensors were able to communicate, but were unable to perform measurements. The serial log will show associated message if that is the case.
On the picture you can see that my implementatoin has a little bit thicker white and black wires (VCC and GND), while the I2C wires (green and orange) are a bit thinner and easier to handle.
After soldering do not forget to verify all your connections and make sure that you don't have any short circuits.
Once soldering is done, and all connections are tested, you can connect the D1 Mini board to a PC or laptop and flash the Atrium firmware. For that either build Atrium your self or download the precompiled binary firmware package. Then flash the firmware, as shown below:
esptool --port /dev/ttyUSB0 erase_flash
esptool --port /dev/ttyUSB0 write_flash 0x0 boot-esp8266@0x0000.bin 0x8000 ptable-esp8266_4m@0x8000.bin 0x10000 atrium-app1@0x10000.bin
To configure the hardware, you need to setup the I2C bus, the button, and the display. Optionally, you can also configure the on-board LED of the D1 Mini board.
For that connect to the serial console of the D1 mini with a running Atrium firmware and perform the following steps:
hwconf add i2c
hwconf set i2[0].port 0
hwconf set i2[0].sda 4
hwconf set i2[0].scl 5
hwconf set i2[0].xpullup false

hwconf add button
hwconf set button[0].gpio 0
hwconf set button[0].name button0

hwconf set display.maxx 4
hwconf set display.mode 2

hwconf add led
hwconf set led[0].gpio 2
hwconf set led[0].name led0

hwconf write
Make sure that you set the GPIOs according how you soldered your board, and reboot after writing the configuration.
This configuration makes use of the internal pull-up resistors. If you
plan to run the I2C bus over a longer distance, you may prefer external
resistors of about 5k. If you use external resistores, you should change
the xpullup argument of the I2C bus configuration from false to
true.
I2C devices that are attached to the bus and known to Atrium are initialized automatically. Also, the SGP30 driver uses available temperature and humidity information and feeds it to the devices, so that it can adjust its calculation of TVOC and CO2 according to the environment conditions.
The following steps are required to let the Atrium node connect to your local WiFi network. You can set the nodename to your choice, like a regular hostname - e.g. the name of the room that this device is monitoring. The nodename will be used when supplying data to MQTT and Influx, to make it possible to differentiate between multiple devices.
nodename tvoc
station ssid <ssid-name>
station pass <ssid-pass>
config set dns_server <dns-IP>
station up
config set domainname <domain>
sntp set <sntp-server>
config write
Next, all sesnors should be polled cyclicly. For the SGP30 this is done automatically, as it requires a fixed sample rate of one sample per second. For the BME280, you are free to choose the sample interval. For this, create a timer with the intended interval in milli-seconds that will be executed periodically (first true) and should be started on startup (second true). Then attach the timeout event of the timer to the sampling action of the BME280:
timer -c timer0 5000 true true
event -a timer0`timeout bme280!sample
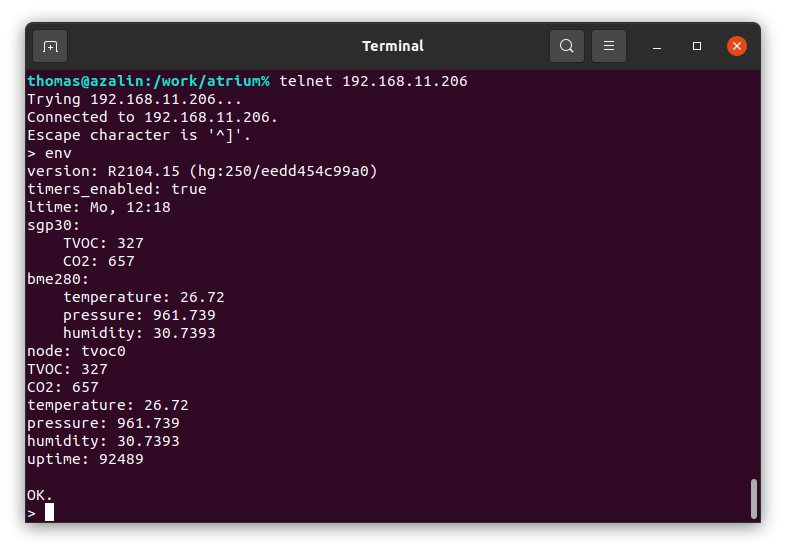
Once that is done, wait the period of the timer and then execute env.
This will list all signals.
Now, the default display on the 14-segment display is the clock that is sourced via NTP (if configured correctly above). To use the button to switch the display, attach the button event to the clock switch action:
event -a button0`short clock!switch_mode
To setup MQTT, perform the following steps:
mqtt uri mqtt://<mqtthost>:<port>
mqtt enable
event -a timer0`timeout mqtt!pub_rtdata
mqtt start
config write
Once MQTT is started, you can use an MQTT app to monitor the
signal values. These will show up under <nodename>/<signal>. To check
if everything works correctly, you can use Mosquitto's command line tool
to monitor the incoming signal values. E.g. use
mosquitto_sub -h <mqtt-host> -v -t '<nodename>/#'.
As written above, Atriium also supports sending data to an Influx DB. If you intend to access Influx via TCP, you must set the database, if you use UDP then do not set the database, but set it in the influx config file of the relevant server. On the Atrium node influx configuration is done with the following commands:
influx host <influx-host>
influx port <influx-port>
influx mm <influx-measurement>
influx db <influx-databse>
event -a timer0`timeout influx!rtdata
config write
If you have problems with your setup, you can use the debug command to
enable debugging of the individual related modules. The modules referred
to in this text are: i2c, ccs811, bmx, disp, ht16k33, mqtt, influx.
Enable them one by one by executing e.g.: debug -e bmx. To disable the
debugging of a specific module use debug -d bmx. To access the debug
message, either watch the serial output or use the dmesg command, when
connected via telnet. If you setup a syslog server, then the messages
will also be forwarded to the syslog host.
For more information on MQTT and Influx/Grafana with Atrium, take a look at the relevant Wiki entry.
If you like, you can add further buttons, to drive the stop-watch or to change the brightness of the display.
Have fun!