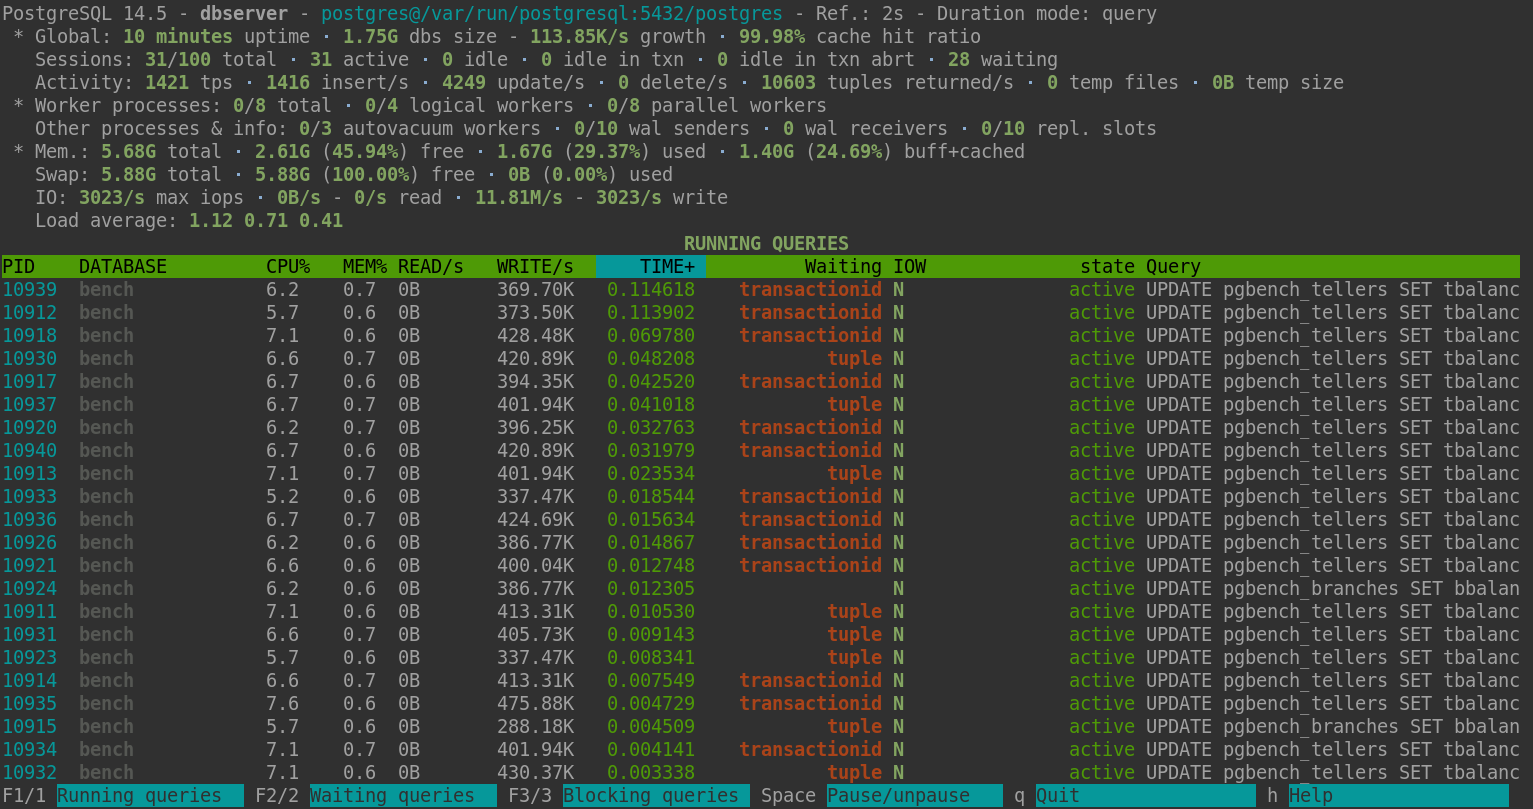
htop like application for PostgreSQL server activity monitoring.
Python >= 2.6
psycopg2 >= 2.2.1
psutil >= 0.5.1
setuptools >= 0.6.14
sudo python setup.py install
Options:
	--version            Show program's version number and exit
	-U USERNAME, --username=USERNAME
                    	  Database user name (default: "postgres").
	-p PORT, --port=PORT  Database server port (default: "5432").
	-h HOSTNAME, --host=HOSTNAME
						  Database server host or socket directory (default:
                    	  "local socket").
	-C, --no-color        Disable color usage.
	--help                Show this help message and exit.
	--debug               Enable debug mode for traceback tracking.

Display options, you can exclude some columns by using them :
	--no-database         Disable DATABASE.
	--no-client           Disable CLIENT.
	--no-cpu              Disable CPU%.
	--no-mem              Disable MEM%.
	--no-read             Disable READ/s.
	--no-write            Disable WRITE/s.
	--no-time             Disable TIME+.
	--no-wait             Disable W.
C			Activate/deactivate colors
r			Sort by READ/s, descending
w			Sort by WRITE/s, descending
c			Sort by CPU%, descending
m			Sort by MEM%, descending
t			Sort by TIME+, descending
Space		Pause on/off
v			Change queries display mode: full, truncated, indented
UP / DOWN	Scroll process list
q			Quit
+			Increase refresh time. Maximum value : 3s
-			Decrease refesh time. Minimum Value : 1s
F1/1		Running queries monitoring
F2/2		Waiting queries monitoring
F3/3		Blocking queries monitoring
h			Help page
R           Refresh
UP			Move up the cursor
DOWN		Move down the cursor
k			Cancel the backend
Space		Back to activity
q			Quit
