Home
These are apps that visualize caniuse data in interesting ways:
Takes the CanIUse data and creates easy to embed web widgets for your site. Supports customization options.

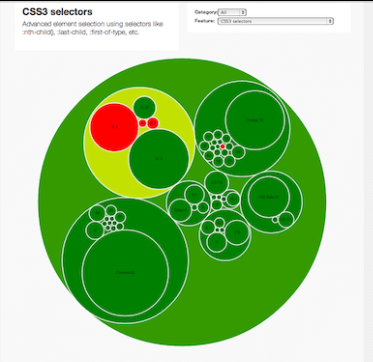
A pack chart powered by D3. Circles represent web browser families and within it, specific versions. Colors denote support.
If you want to use these features, what % of users have browsers that fully support all of them?


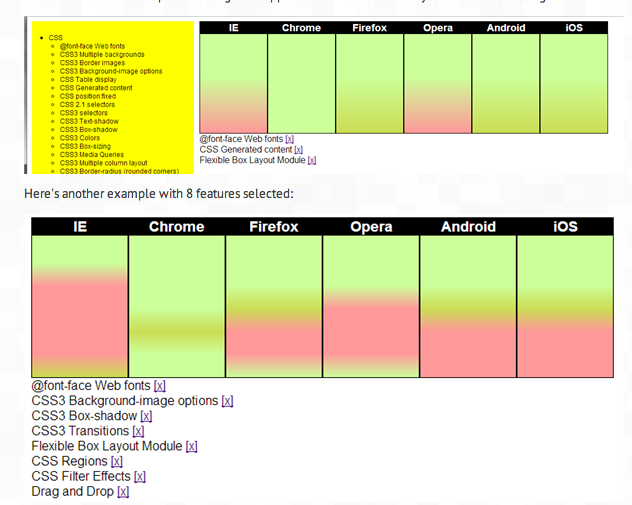
(also this worst-case one)