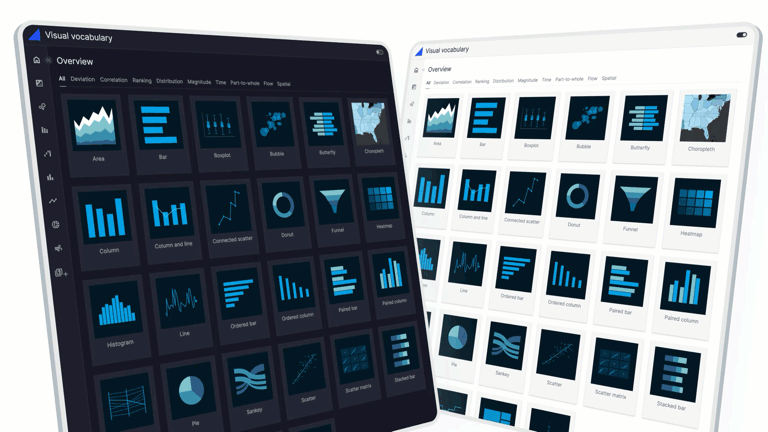
Vizro is an open-source Python-based toolkit.
Use it to build beautiful and powerful data visualization apps quickly and easily, without needing advanced engineering or visual design expertise.
Then customize and deploy your app to production at scale.
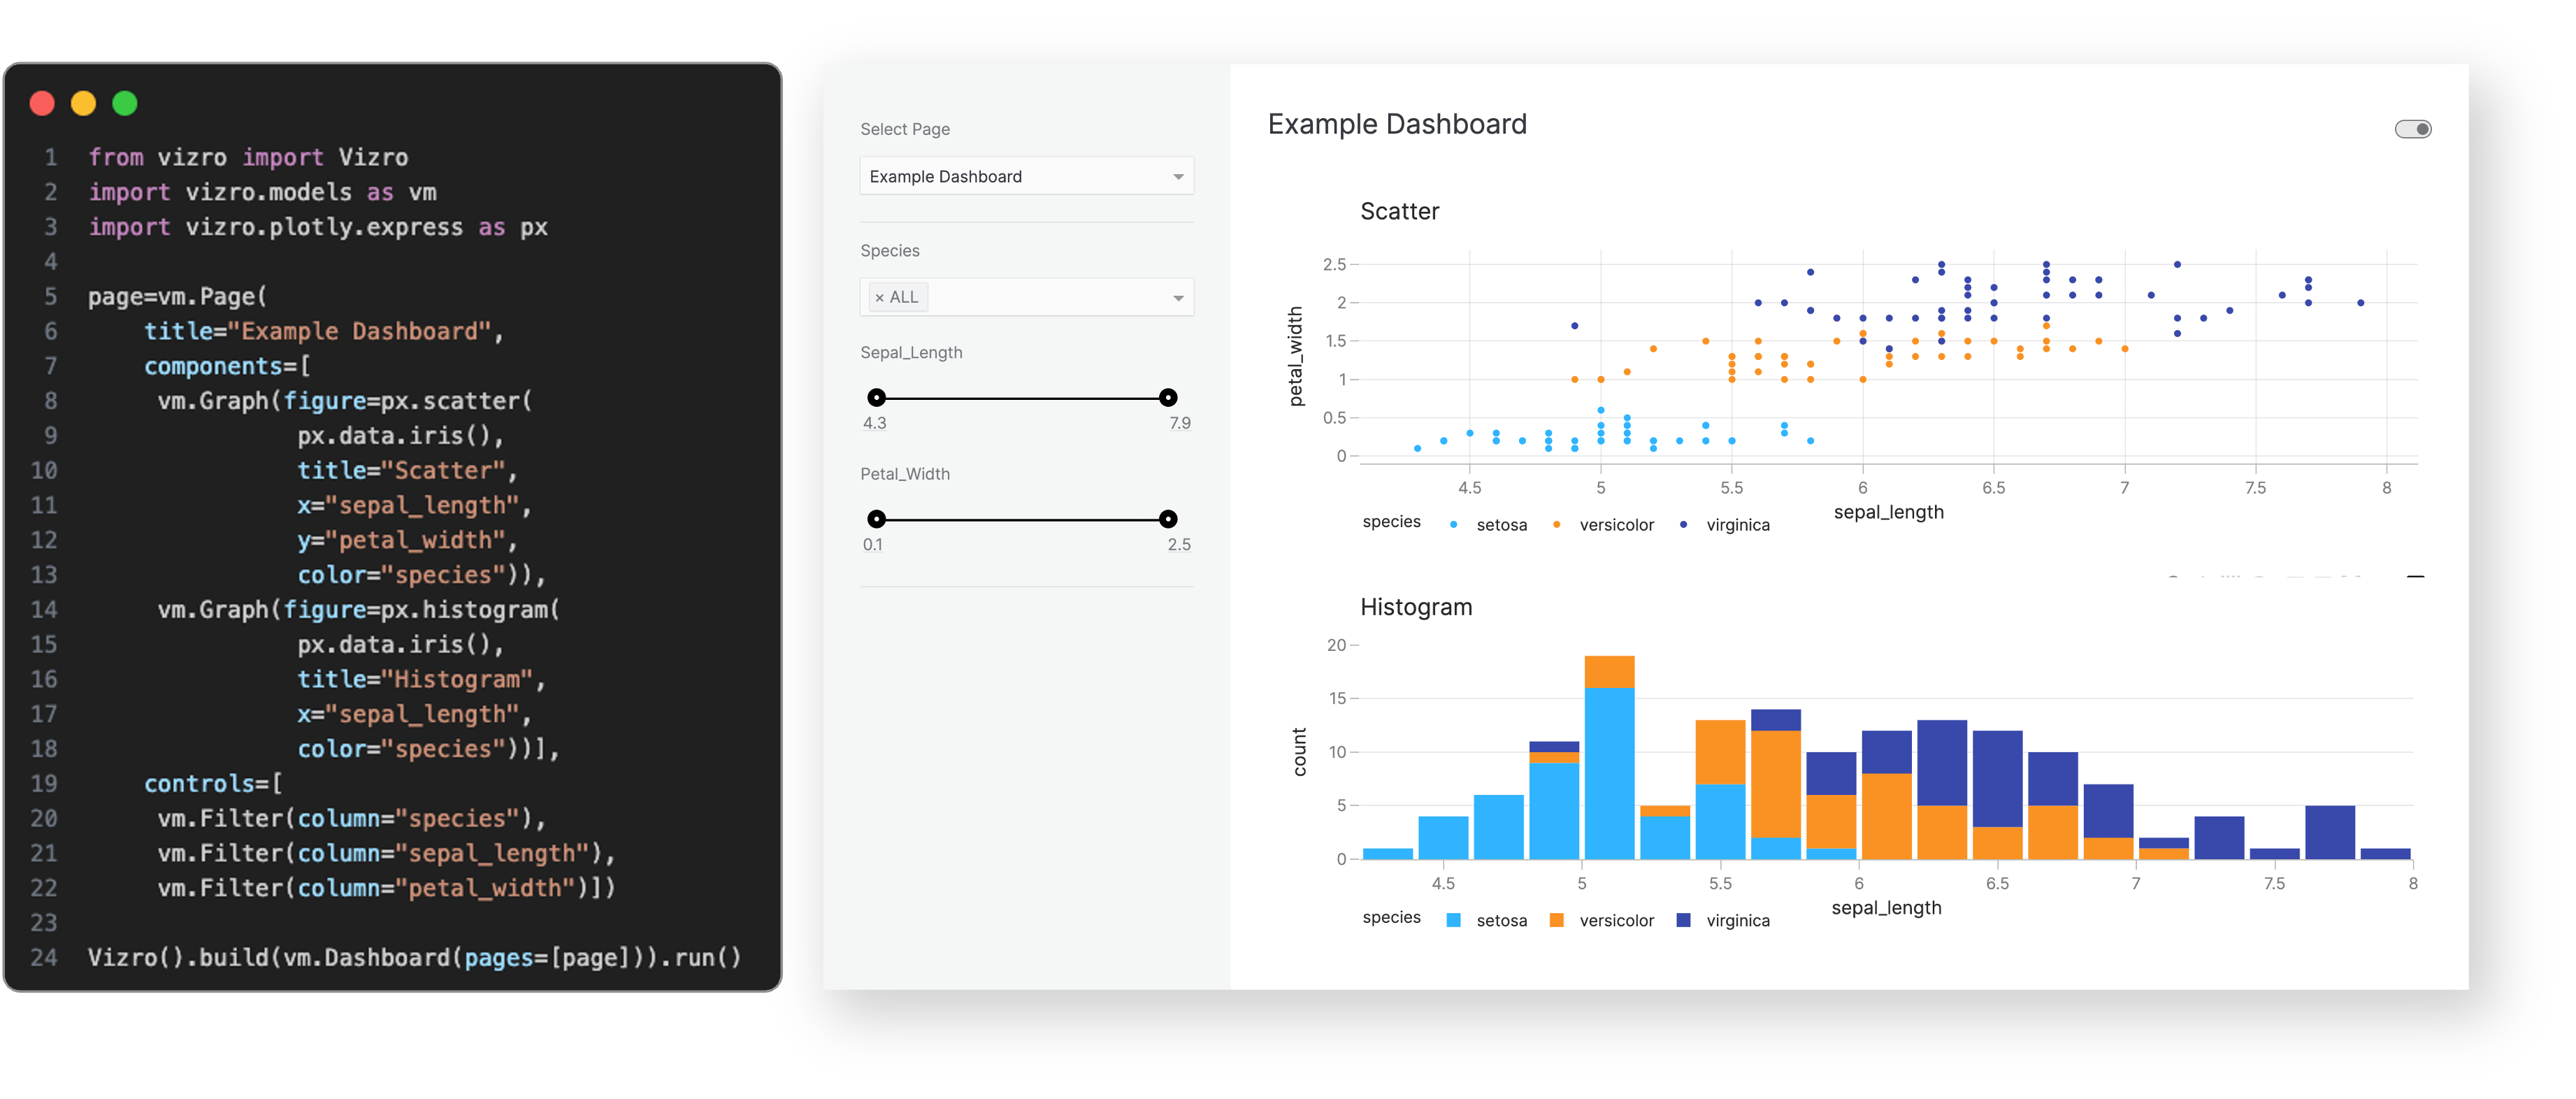 Use a few lines of simple low-code configuration, with in-built visual design best practices, to assemble high-quality
multi-page prototypes.
The benefits of the Vizro toolkit include:
Visit our "How-to guides" for a more detailed explanation of Vizro features.
Vizro helps you to build data visualization apps that are:
Quick and easy
Build apps in minutes. Use a few lines of simple configuration (via Pydantic models, JSON, YAML, or Python dictionaries) in place of thousands of lines of code.
Beautiful and powerful
Build high-quality multi-page apps without needing advanced engineering or visual design expertise. Use powerful features of production-grade BI tools, with in-built visual design best practices.
Flexible
Benefit from the capabilities and flexibility of open-source packages. Use the trusted dependencies of Plotly, Dash, and Pydantic.
Customizable
Almost infinite control for advanced users. Use Python, JavaScript, HTML and CSS code extensions.
Scalable
Rapidly prototype and deploy to production. Use the in-built production-grade capabilities of Plotly, Dash and Pydantic.
Visit "Why should I use Vizro?" for a more detailed explanation of Vizro use cases.
Use Vizro when you need to combine the speed and ease of low-code Python tools, with production capabilities of JavaScript and BI tools, and the freedom of open source:
- Have an app that looks beautiful and professional by default.
- Enjoy the simplicity of low-code, plus the option to customize with code almost infinitely.
- Rapidly create prototypes which are production-ready and easy to deploy at scale.
Low-code framework for building dashboards.
The Vizro framework underpins the entire Vizro toolkit. It is a Python package (called vizro).
Visit the documentation for more details.
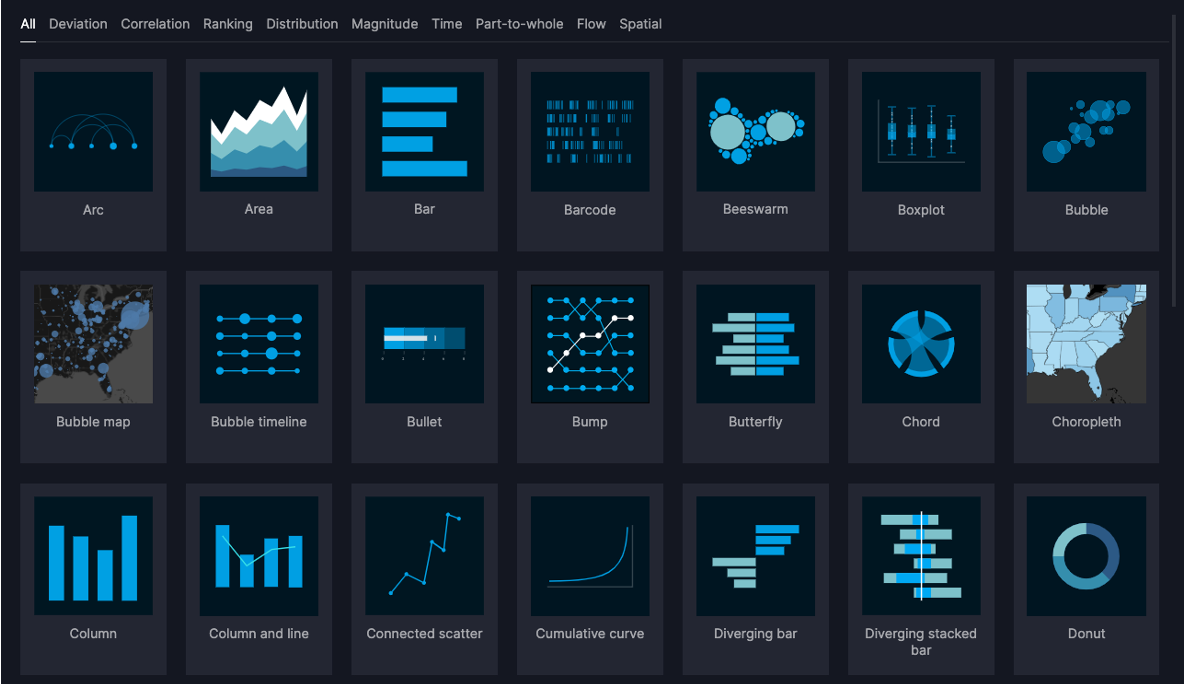
Chart examples.
The visual vocabulary helps you to decide which chart type to use for your requirements, and offers sample code to create these charts with Plotly or embed them into a Vizro dashboard.
Visit the visual vocabulary to search for charts or get inspiration.
Dashboard examples.
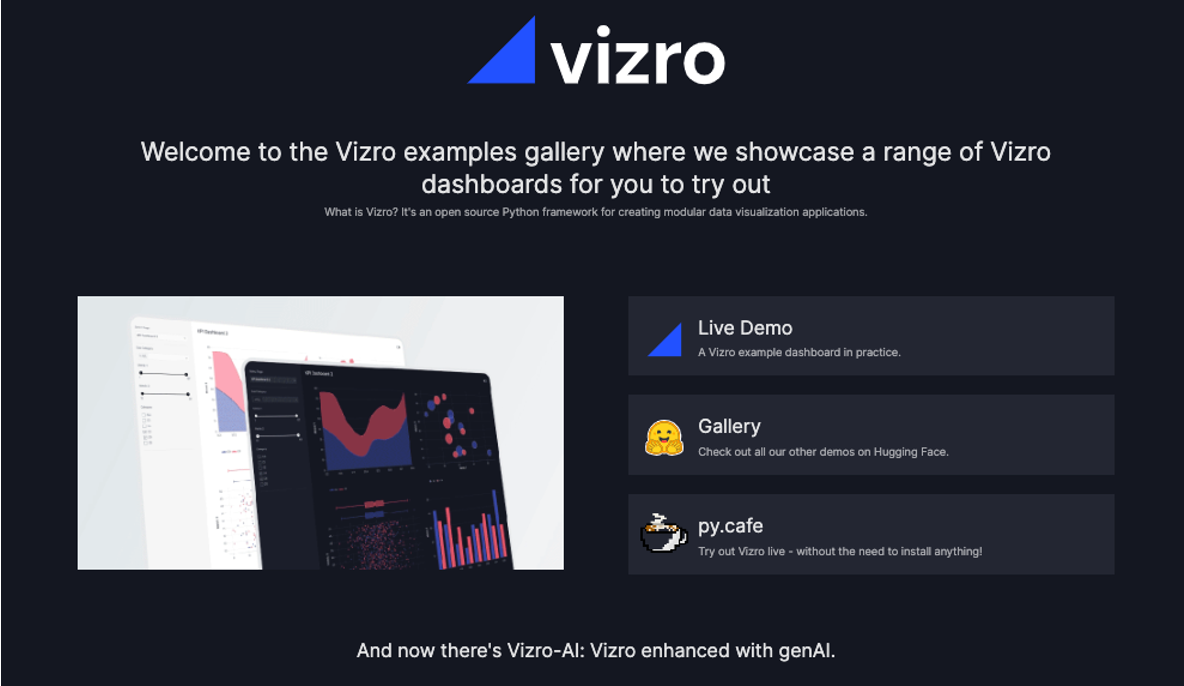
The dashboard examples gallery enables you to explore Vizro in action by viewing interactive example apps. You can copy the code to use as a template or starter for your next dashboard.
Visit the dashboard examples gallery to see the dashboards in action.
Use LLMs to generate charts and dashboards.
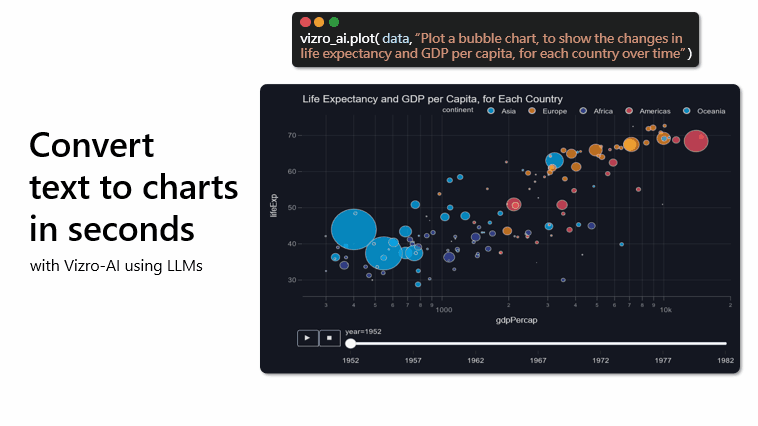
Vizro-AI is a separate package (called vizro_ai) that extends Vizro to incorporate LLMs. Use it to build interactive Vizro charts and dashboards, by simply describing what you need in plain English or other languages.
Visit the Vizro-AI documentation for more details.
pip install vizroSee the installation guide for more information.
The get started documentation explains how to create your first dashboard.
This repository is a monorepo containing the following packages:
| Folder | Version | Documentation |
|---|---|---|
| vizro-core | Vizro Docs | |
| vizro-ai | Vizro-AI Docs |
We encourage you to ask and discuss any technical questions via the GitHub Issues. This is also the place where you can submit bug reports or request new features.
The contributing guide explains how you can contribute to Vizro.
You can also view current and former contributors here.
See our security policy.
vizro is distributed under the terms of the Apache License 2.0.


