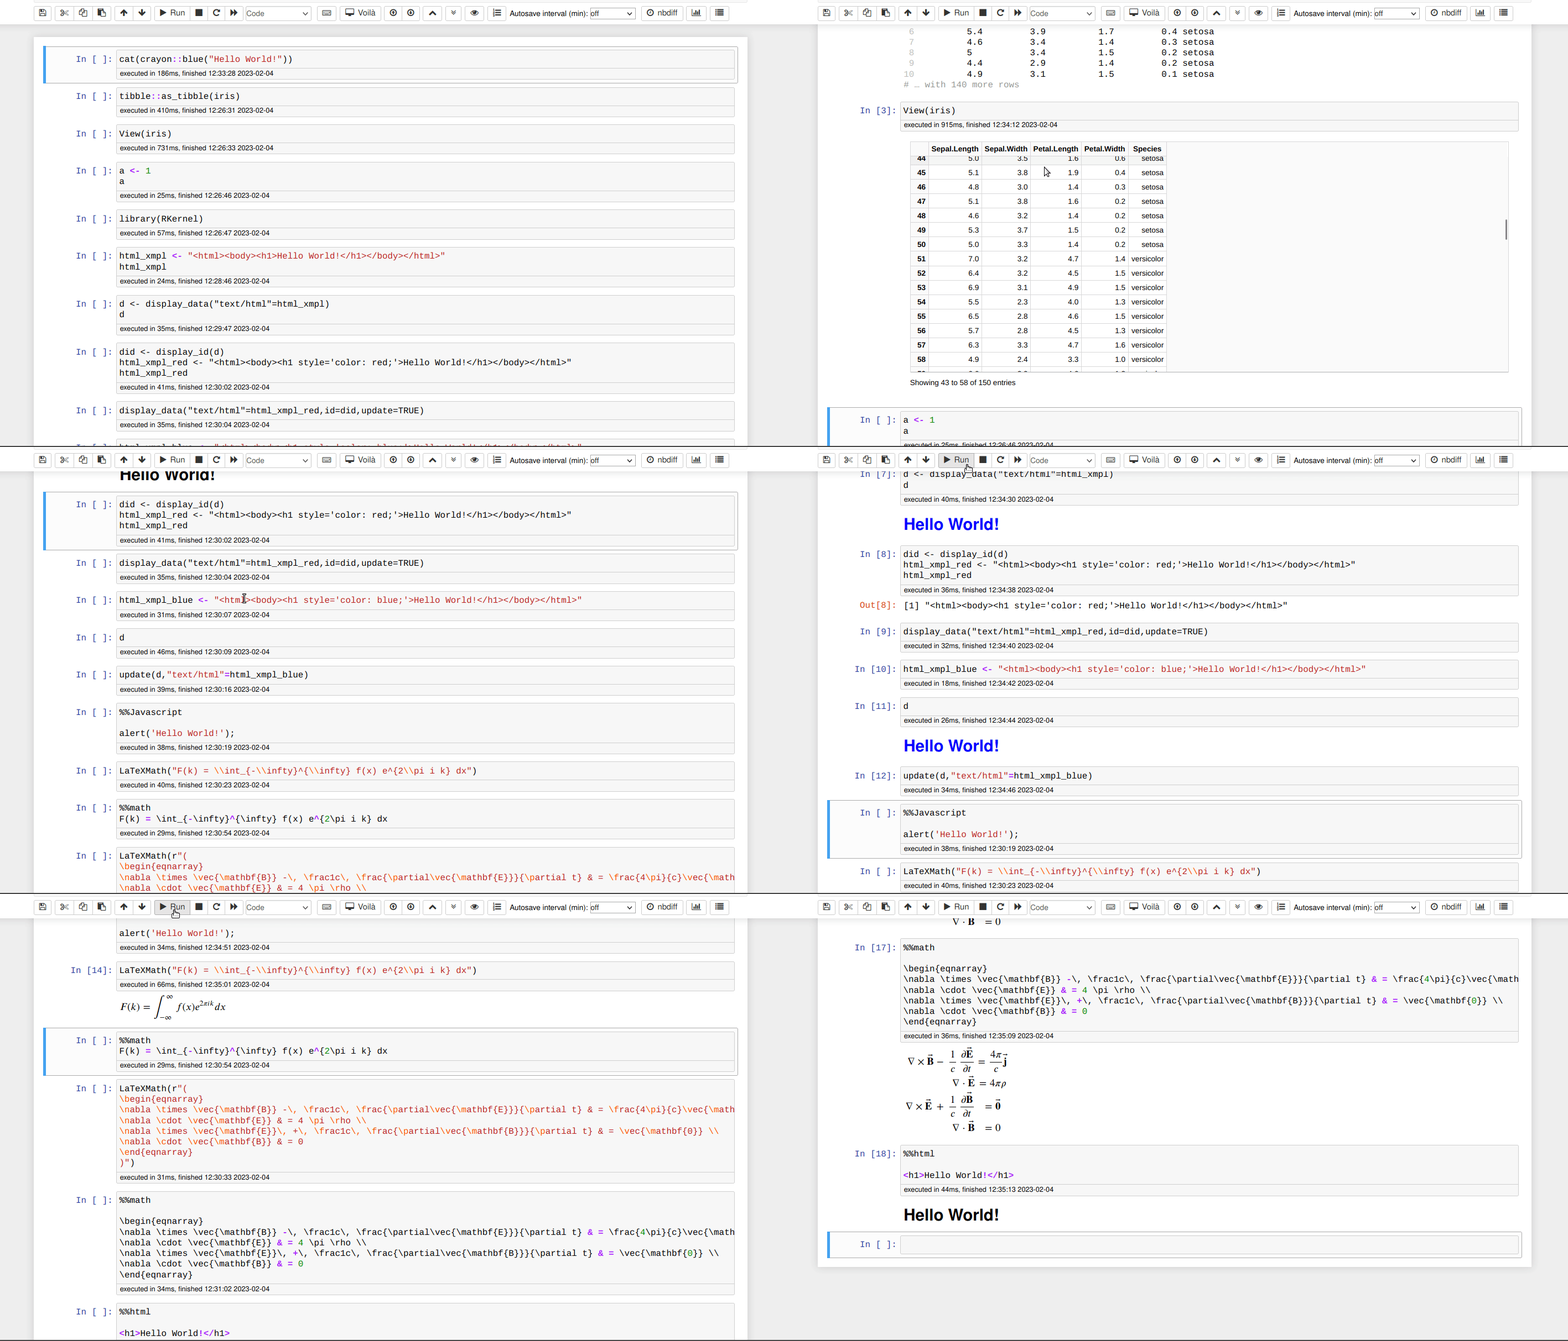
This is a re-creation from scratch of an R kernel for Jupyter.
To install run the following lines in R:
install.packages('RKernel', repos = c('https://melff.r-universe.dev', 'https://cloud.r-project.org'))
RKernel::installspec()
For dynamic help you also need to install the python package jupyter-server-proxy.
This kernel differs from the already existing IRKernel by:
-
Users can decide whether objects of certain classes are output via the "stdout" stream - which allows using any dedicated
print()-methods or via rich HTML/LaTeX output. By default the "stdout" stream is used for most classes of objects. Classes can be designated for rich output by callingadd_displayed_classes("some class"). For individual objects, rich output can be requested usingdisplay(some.object). -
Users can decide wether an error or calling
stop()leads to the termination of a notebook run or whether the succeeding notebook cells will be run. (This may be useful for teaching with notebooks.) Whether an error ofstop()leads to an notebook abort can be controlled by the optionrkernel_stop_on_error. -
Error and warning messages appear via the
stderrstream, ordinary messages (created bymessage()) appear via thestdoutstream. Consequently, "ordinary" messages (e.g. that appear while a package is loaded vialibrary()) are less obtrusive, while error messages clearly stand out. -
Graphics can be "updated", so that e.g.
curve(gamma(x),add=TRUE)works as expected even if the plot to which the curve is added has been created by code in a previous cell. -
It is based on the R6 package instead of S4 reference classes.
-
Links in help pages work. To this purpose, help pages are not paged, but included into the notebook. This also allows to show several help pages in the notebook. Also
help.start()now works. HTML help is shown using jupyter-server-proxy -
The polling loop allows for providing services e.g. with the "htmluv" package.
-
It is possible to make use of the Widgets infrastructure provided by ipywidgets to constructed interactive user interfaces. These can be used with jupyter notebooks, JupyterLab and voilà. ipywidgets are supported up to version 8.0.
-
HTML widgets generally work. However, some htmlwidgets (notably those created with plotly) displayed with the setting
options(htmlwidgets_embed=TRUE)however to not appear if the notebook is opened in Google Chrome. -
There is also a support for virtual table display (based on the ipywidget infrastructure).
-
The AnyWidget infrastructure is supported if the relevant python package is installed.
Some demonstration notebooks can be found here.
A widget demonstration can be found here.
