- ETL (Extract, Transform, Load) is a process in data warehousing responsible for pulling data out of the source systems, transforming it into a more digestible format, and loading it into the data warehouse.
- In this project, we will be extracting news data from the HLTV website, transforming it into a more digestible format, and loading it into AWS S3.
- We will be using Apache Airflow to schedule the ETL process and Apache Spark to transform the data.
- This project is for educational purposes only.
- The data extracted from the website is the property of HLTV.
- The data is not used for any commercial purposes.
- A DAG (Directed Acyclic Graph) is a collection of all the tasks you want to run, organized in a way that reflects their relationships and dependencies.
- A DAG is defined in a Python script, which represents the DAGs structure (tasks and their dependencies) as code.
- The DAG is used by Apache Airflow to schedule the ETL tasks and monitor them.
- The DAG in current project is scheduled to run every every 1 day at 00:00 UTC, it can be configured to run at any time interval.
- The DAG consists of 6 tasks:
- extract_hltv_news : Extracts the news data from the HLTV website.
- check_downloaded_file : Checks if the data file is downloaded.
- run_transform : Runs the transformation script on the downloaded data file.
- spark_analysis : Runs Spark jobs on the transformed data for analysis, and stores the resultant csv file in AWS S3.
- clear_temp_files : Clears the temporary files created during the ETL process.
- send_email : Sends an email to the user with the DAG run status.
- I am running the project on an AWS EC2 t3.medium instance with Ubuntu 22.04 LTS.
- Install Apache Airflow & Apache Spark on the EC2 instance.
- Python version used: 3.10.12 | Java version used: openjdk 11.0.20.1
- Install the necessary dependencies for the project. (Both pip and npm)
- Start Airflow and Spark services using the following commands:
[Airflow]
$ airflow standalone

[Spark]
$ export SPARK_HOME=/path/to/your/spark/directory
$ $SPARK_HOME/sbin/start-master.sh
$ $SPARK_HOME/sbin/start-worker.sh spark://<HOST_IP>:7077- The analysis is done using Spark SQL.
- The visualizations are done using Matplotlib and Seaborn.
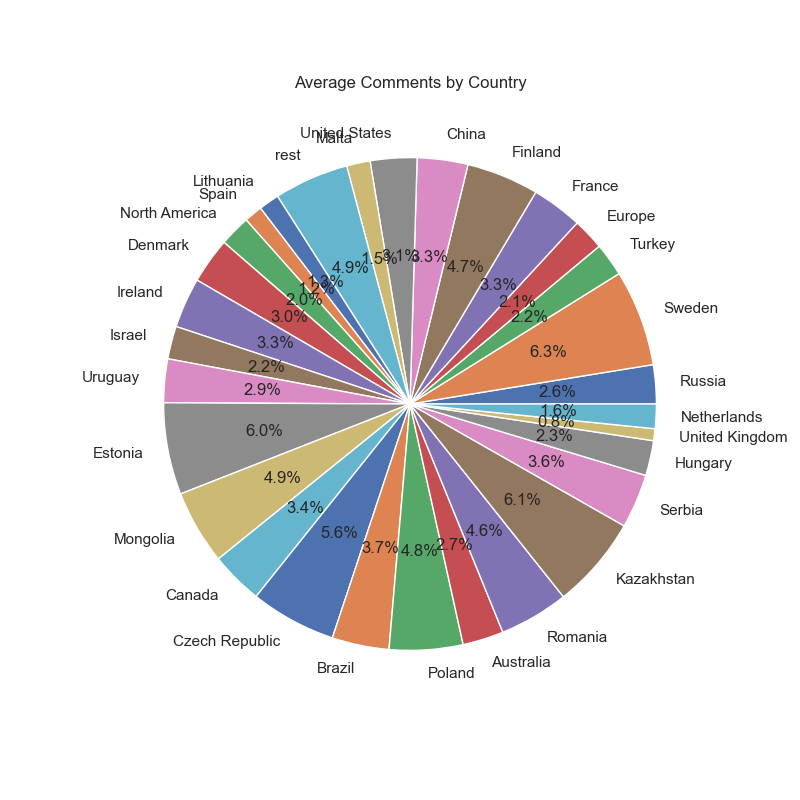
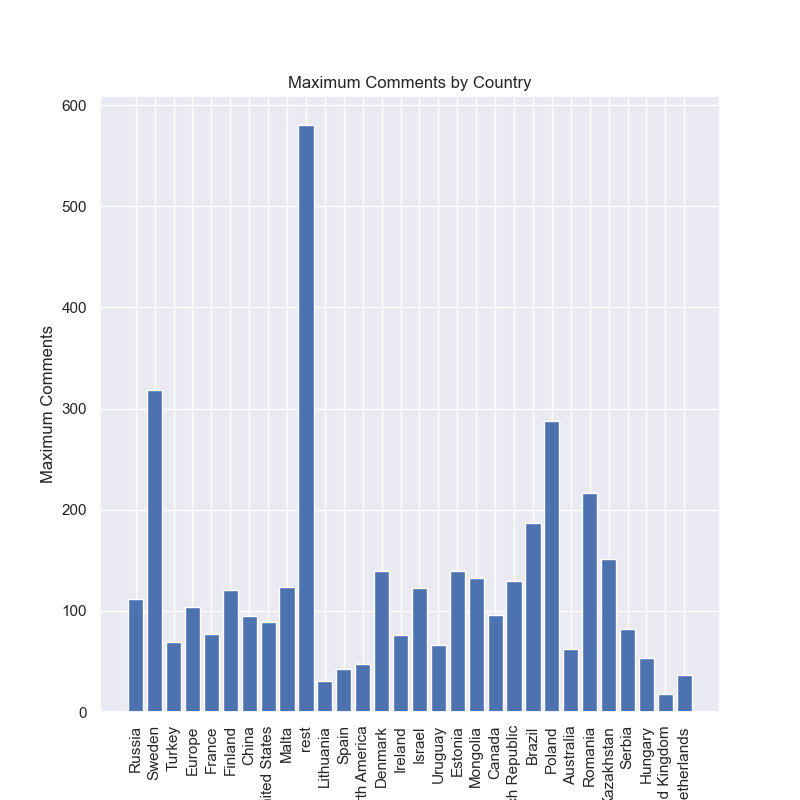
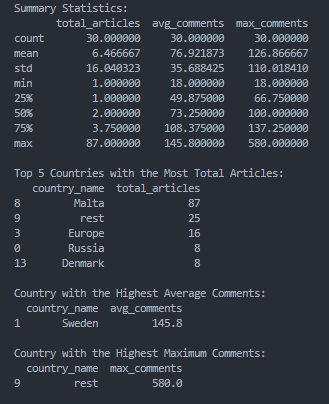
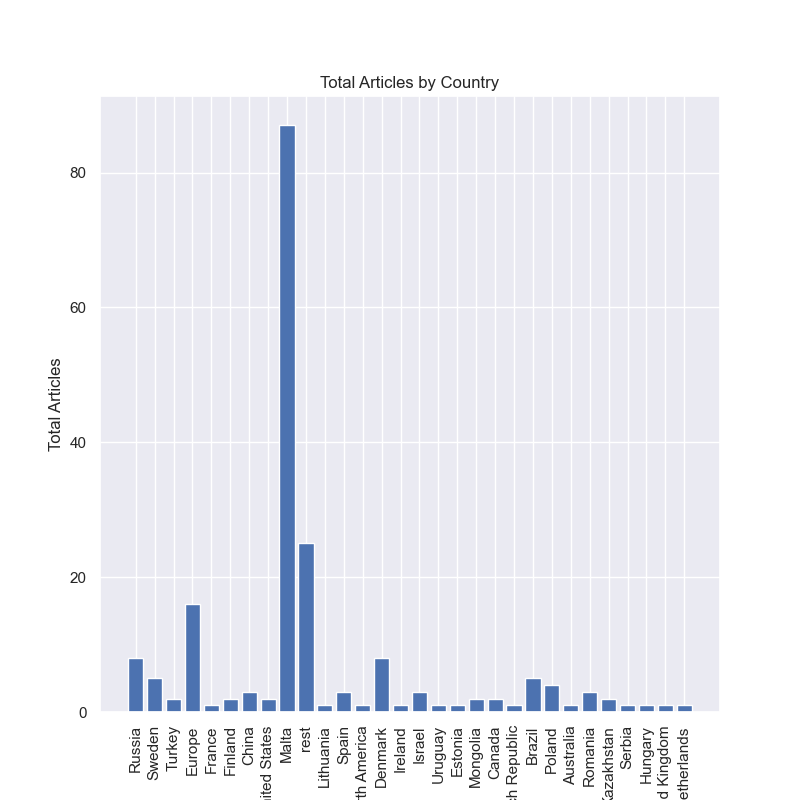
- Here is some of the analysis done on the data:
| Avg Comments by Country | Max Comments by Country |
|---|---|
 |
 |
| Descriptive Analysis | Total Articles by Country |
|---|---|
 |
 |
Contributions, issues and feature requests are welcome.
Feel free to check issues page if you want to contribute.
Kaustav Mukhopadhyay
- Linkedin: @kaustavmukhopadhyay
- Github: @muKaustav
Drop a ⭐️ if this project helped you!
Copyright © 2023 Kaustav Mukhopadhyay.
This project is MIT licensed.
