QuantumLeap in Pictures
A visual intro to QuantumLeap.
QuantumLeap is a REST service for storing and querying spatial-temporal IoT data. Shaw, that's quite a mouthful!
So let's dot the Is and cross the Ts, spatial-temporal features of IoT data refers to the fact that space and time are intrinsically linked to IoT device readings. Indeed, if you think about it, it makes sense since the moment you switch a device on, that device will start taking measurements, e.g. air quality, water level in a sewage, but each reading gets taken in some place at a specific point in time.
As it turns out, often (but by no means always!) to analyse those
data, you can't just consider a reading in isolation but you'll
typically need to know when and where the reading got taken. So
you'll wind up with a set of tuples (reading, time, space) that
you'll have to make sense of
R = { (reading, when, where) }
If you were looking for the lunar orbit view of QuantumLeap, it'd probably be fair to say that QuantumLeap is a REST service to build persistent and queryable sets of these tuples out of NGSI v2 entity data.
I suppose a quick example is in order. Say we'd like to monitor crop growth on a farm. The farm is divided up in two plots, the east and west plot. A drone surveys the farm once a day, scanning each square metre of land to count the number of plants in it. So you get a crop density measure of sorts, given by plants per square metre. In the sketch below you can see the drone flying over the farm and reporting density readings which I plotted on the 2D plane at the top as a function of time whereas space isn't explicitly mentioned but I'll leave your imagination work for me. Should we agree the two data points from the left got taken on the west plot whereas the third is for the east plot? :-)

Now to ask meaningful questions about this data set, we're going to need to consider both space and time over and above density values. For example, what's the current plant count on the east plot? Looking at the sketch here, assuming those are today's data, we see we should take the dot on the far right but not the other two. Similarly, you could ask how the density has varied in the west plot since the beginning of the year. Again, we need to know where and when each reading got taken to answer this question: we'll have to divide up the data collected since the beginning of the year in days and for each day sum up the density values from the west plot.
I'm going to show you in a minute how answering these kinds of questions is just an HTTP GET away using QuantumLeap's REST API. But before doing that, I'd like to touch on QuantumLeap's approach to storing and querying data over space and time. In a nutshell, QuantumLeap gets notified of entity changes by Context Broker, converts those notified NGSI entities to tabular format, and stores them in a time series & geo-spatial DB. Then through a REST API you can query those entities over space and time using the familiar NGSI query syntax we all know and love. In terms of DBs, we support both CrateDB and Timescale at the moment, but we may add support for others in the future if useful to anyone. And here's a diagram to visualise how QuantumLeap operates.
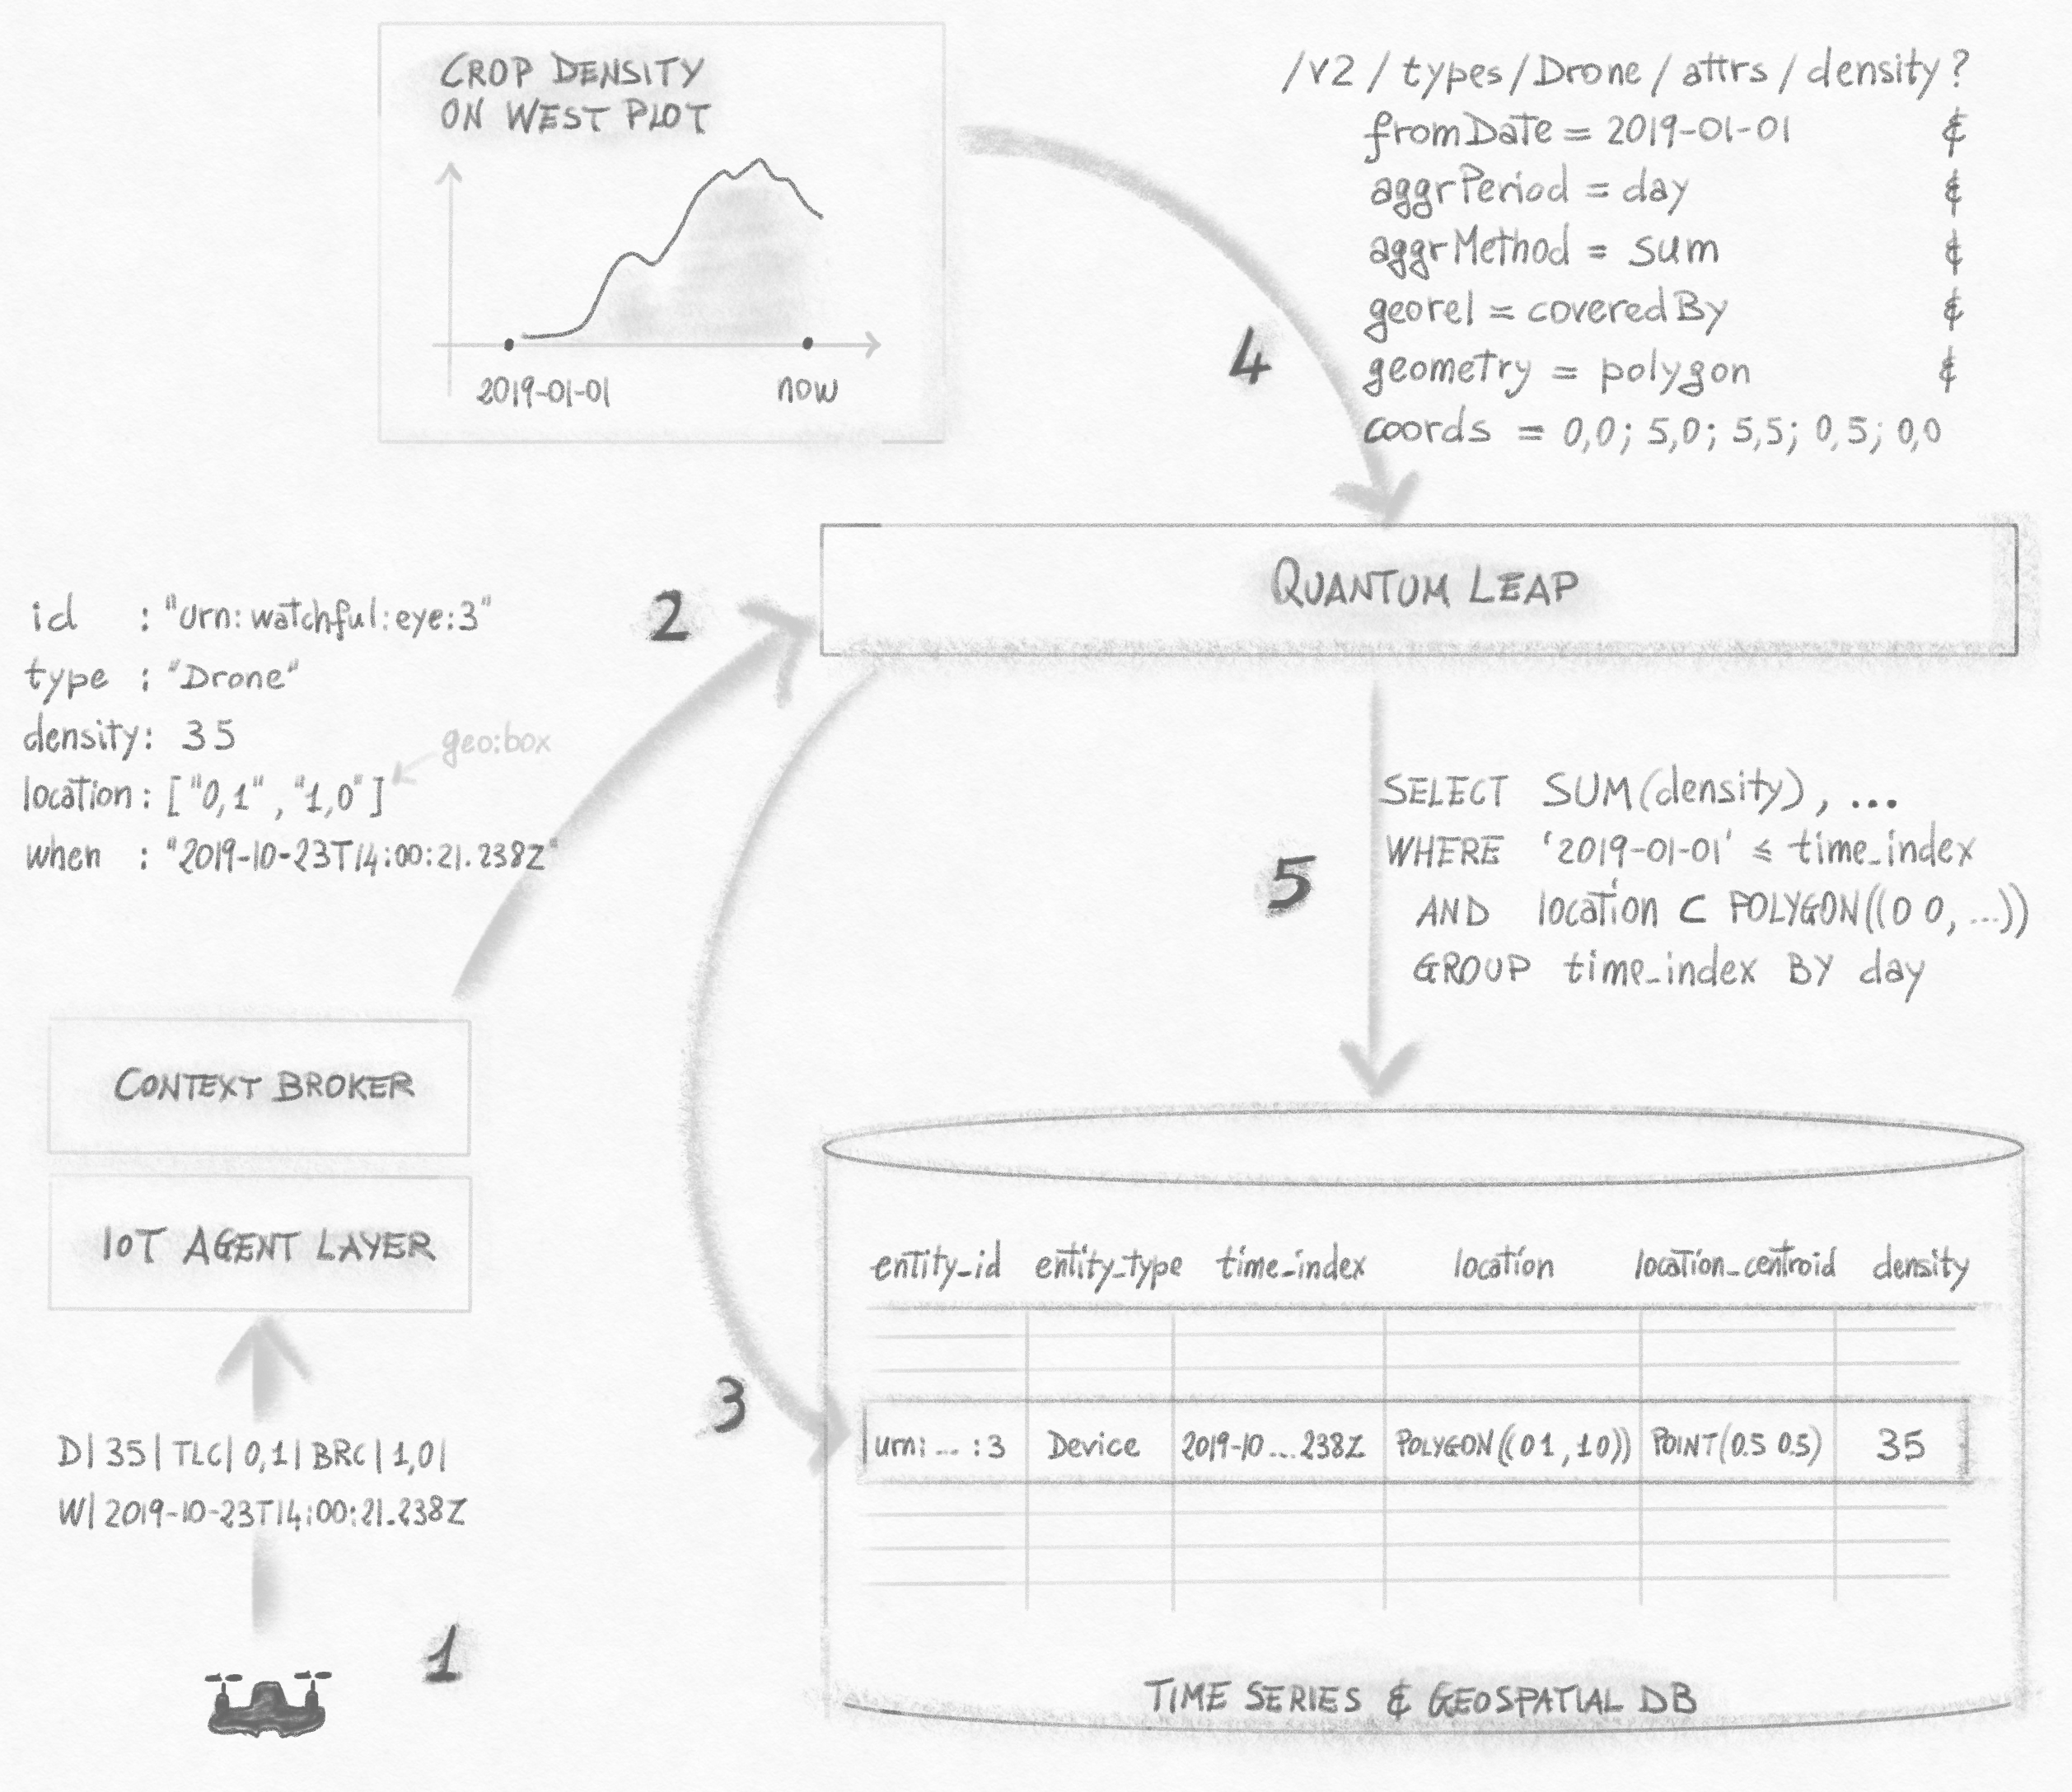
You can see at the bottom left corner the drone from earlier hitting the IoT Agent Layer with a UL 2 payload which agents convert to an NGSI entity and pass on to Context Broker which then notifies QuantumLeap with the entity. On getting the JSON entity data, QuantumLeap turns it into a DB record and stashes it away in a DB that supports both time-series and spatial data, like Timescale or CrateDB, taking care of picking a suitable time index value and a location. It also computes the location centroid which comes in handy for geo-queries as we'll see later.
Now along comes an app that wants to visualise crop density on the
west plot since the beginning of the year. To do that, it can simply
do an HTTP GET on the NGSI Drone entity exposed by QuantumLeap. On
the top right corner, you can see what the URL would look like.
In the path part of the URL, the client says it's looking for density
values of Drone entities whereas the query string tells QuantumLeap
to consider only data points since the beginning of the year coming
from the west plot—fromDate and geo*/coords params, respectively.
Moreover, the client wants QuantumLeap to divide up the data into
day-wide intervals (aggrPeriod) and sum up the density values in
each day interval (aggrMethod). Under the bonnet, QuantumLeap turns
all this info into a SQL query which in practice doesn't actually
look too different from the pseudo-code one you see on the diagram.
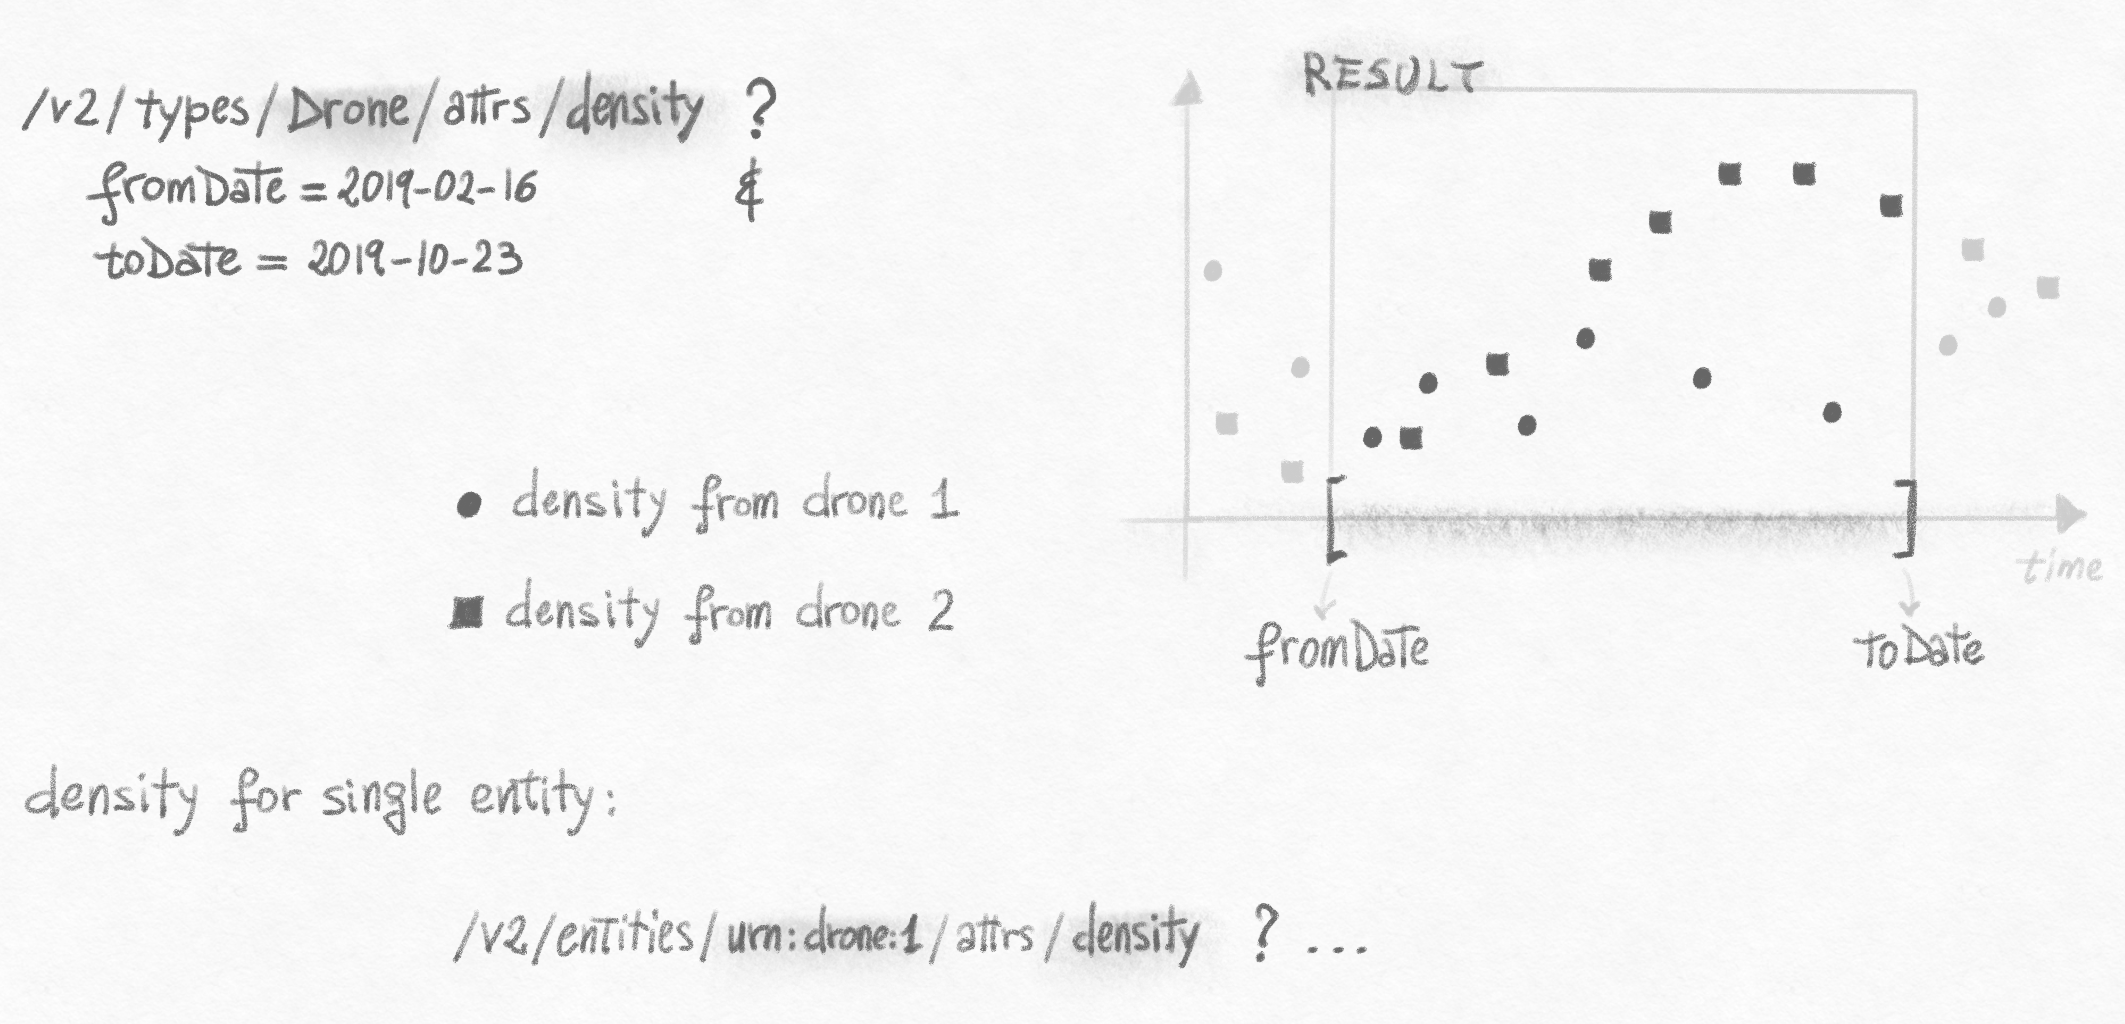
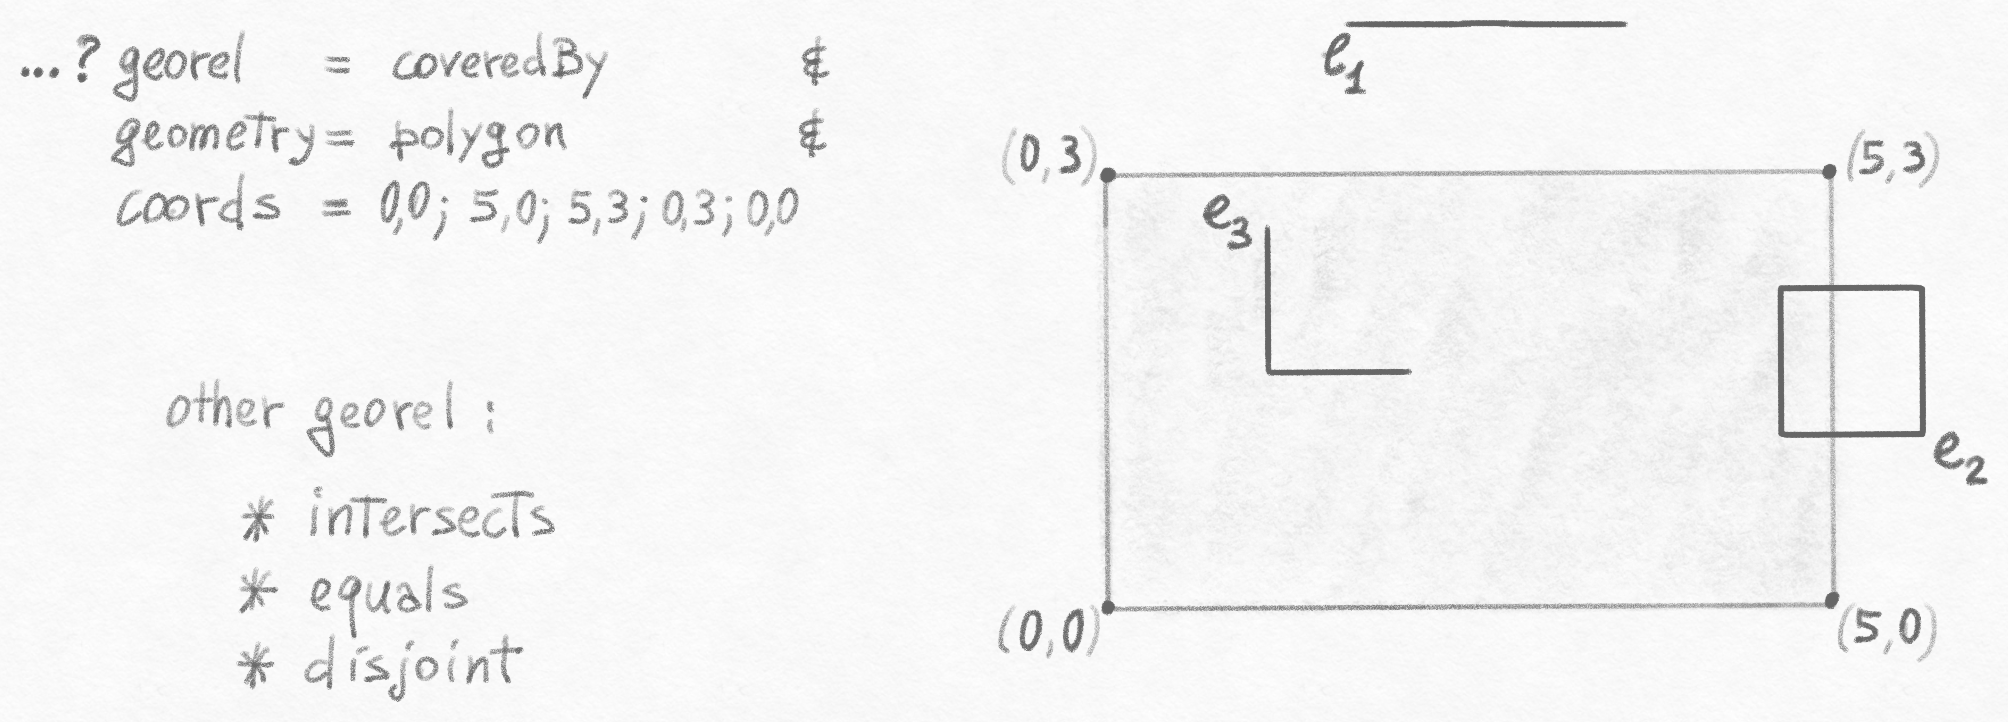
Now I'd like to give you a bit more detail about how you can use those RESTful queries to slice and dice your NGSI entity data in space and time. Let's start from time.
TODO: narrative!
TODO

TODO
TODO

TODO
- Set up DB: Timescale, CrateDB
- Deploy Docker image: Compose, Swarm, K8s
- Create Orion sub for entities to track
- Set up Grafana: PG data source, map plugin
Example: K8s cluster deployment
