Data Analyst · Business Intelligence · Python · SQL · Power BI · DAX · Cyber Security · SIEM
📍 St. Louis, MO — Open to Work in the USA

"I don't just analyze data — I tell its story."
Data Analytics and Business Intelligence professional with a Master's degree in Cybersecurity (Data Analytics emphasis) and 3.5+ years of enterprise IT experience based in St. Louis, MO — open to work anywhere in the USA.
I specialize in transforming complex, multi-source datasets into clear and compelling visual stories — from data cleaning and transformation using Python and SQL, to designing interactive dashboards in Tableau and Power BI with DAX and Power Query that help organizations understand trends, risks, and performance metrics.
My cybersecurity background gives me a unique edge in data accuracy, risk awareness, and responsible data practices. I build analytics products that are not only insightful but trustworthy — for any audience, from operational teams to executive leadership.


| Area | Details | |
|---|---|---|
| 📊 | BI Dashboards | Interactive dashboards in Tableau & Power BI with DAX, Power Query, and Data Modeling |
| 📈 | Data Visualization | Translating complex datasets into clear visual stories using Plotly, Matplotlib, Seaborn |
| ⚙️ | Data Pipelines | Python ETL pipelines (Pandas, NumPy) for cleaning, transforming, and aggregating data |
| 🗄️ | SQL Analytics | Advanced querying, CTEs, Window Functions, data modeling, and multi-source aggregation |
| 🔐 | Security Analytics | SIEM log analysis, CVSS risk scoring, MITRE ATT&CK, threat intelligence dashboards |

| 📊 Visualization & BI | 💻 Data Engineering | 🔐 Security Analytics |
|---|---|---|
| Power BI (DAX, Power Query, Data Modeling) | Python (Pandas, NumPy, Matplotlib) | SIEM Log Analysis (ELK Stack, Splunk) |
| Tableau | SQL (CTEs, Window Functions, Joins) | CVSS Vulnerability Scoring |
| Plotly · Matplotlib · Seaborn | ETL Pipelines | MITRE ATT&CK Framework |
| Dashboard Design & KPI Development | Data Cleaning & Transformation | Threat Intelligence (VirusTotal, AbuseIPDB) |
| Data Storytelling | Feature Engineering | Risk Quantification & Anomaly Detection |
| Executive Reporting | Large Dataset Processing (100K+ records) | Incident Response · Phishing Analysis |
Reporting & Tools: Excel (Pivot Tables, Macros, Advanced Formulas) PowerPoint GitHub Linux (RHEL/Ubuntu) Windows Server ITIL Service Management
Cloud & Platforms: AWS Fundamentals Azure Fundamentals Snowflake (Basic) REST APIs (VirusTotal, AbuseIPDB)
Power BI Tableau DAX Power Query Python SQL Pandas Excel
Transforming 100,000+ records of global sales data into executive-ready business intelligence
| Metric | Result |
|---|---|
| 📦 Records Processed | 100,000+ |
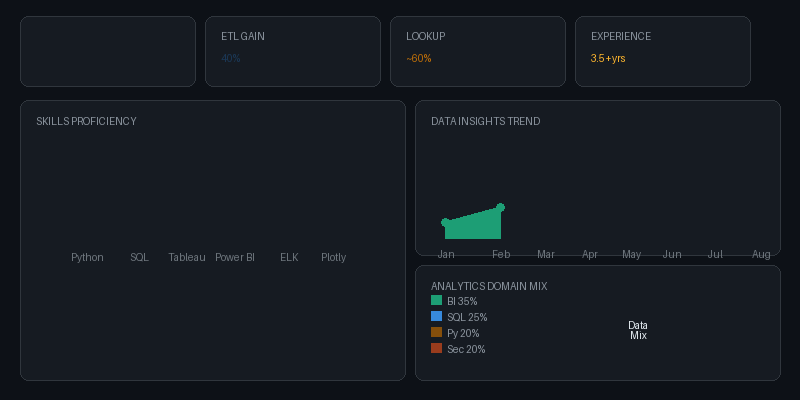
| ⚡ Data Prep Time Saved | 40% faster |
| 👥 Audience | Business stakeholders & executives |
| 🛠️ Tools | Power BI, Tableau, DAX, Power Query, Python, SQL |
- 🎯 Designed interactive Power BI and Tableau dashboards with DAX measures and calculated columns for KPI tracking, revenue trend analysis, and period-over-period comparisons
- ⚡ Built Power Query (M) and Python (Pandas) ETL scripts processing 100,000+ records from multiple sources, reducing data preparation time by 40%
- 📖 Translated complex multi-source datasets into executive-facing visual summaries surfacing revenue anomalies, regional trends, and growth signals
- 🔍 Enabled dynamic drill-down reporting for executive leadership across regions and product lines
Power BI DAX Python Pandas CVSS Scoring Risk Analytics Data Visualization
Making security risk visible and understandable for executive decision-makers
| Metric | Result |
|---|---|
| ⏱️ Manual Triage Time Saved | ~2–3 hours per assessment |
| 📊 Dashboard Type | Executive Power BI |
| 🔢 Scoring Model | CVSS-based DAX risk pipeline |
| 👥 Audience | Technical analysts & senior leadership |
- 📊 Developed an executive-level Power BI dashboard translating raw vulnerability data into quantified financial risk metrics using a CVSS-based scoring model
- 🔢 Built a DAX-based risk classification pipeline converting raw vulnerability inputs into priority-tiered remediation scores, reducing manual triage time by ~2–3 hours per assessment
- 👥 Designed for dual audiences — meaningful and actionable for both technical analysts and non-technical senior leadership
Python Pandas Plotly SQL REST APIs SIEM ELK Stack MITRE ATT&CK
Automating threat data enrichment and surfacing intelligence through interactive visual dashboards
| Metric | Result |
|---|---|
| ⚡ Manual Lookup Reduction | ~60% per analyst session |
| 🤖 Pipeline | Fully automated via REST APIs |
| 📈 Visualization | Interactive Plotly dashboards |
| 🛠️ Tools | Python, Plotly, SQL, VirusTotal API, AbuseIPDB |
- 🤖 Engineered an automated threat intelligence pipeline ingesting raw IP log data and enriching it via VirusTotal and AbuseIPDB REST APIs, cutting manual lookup time by ~60% per analyst session
- 📈 Developed interactive Plotly dashboards visualizing threat score trends, geographic IP distribution, and alert severity breakdowns — delivering SOC-ready operational intelligence
- 🔐 Applied MITRE ATT&CK framework tagging and CVSS-aligned scoring to contextualize threat behaviors across security analytics and data visualization
Open to Work in the USA · Data Analyst · Business Intelligence Analyst · Data Visualization · Remote & On-site