This project is a comprehensive tool for analyzing stocks and pricing options using two models:
-
Black-Scholes Model
-
Monte Carlo Simulations
It includes features such as stock price visualization with moving averages, RSI calculation, next-day stock price prediction, and interactive visualizations.
-
Black-Scholes Option Pricing
-
Calculates the price of European-style options.
-
Outputs key metrics known as Greeks:
-
Delta: Rate of change of the option price with respect to the stock price.
-
Gamma: Rate of change of Delta with respect to the stock price.
-
Theta: Rate of change of the option price with respect to time.
-
Vega: Sensitivity of the option price to volatility.
-
Rho: Sensitivity of the option price to interest rates.
-
-
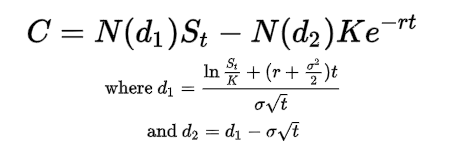
Call Option (C) is calculated using the following formula:
-
Put Option (P) is calculated using the following formula (the same formulas for d1 and d2 are used as above):

-
-
Monte Carlo Simulation
-
Simulates multiple stock price paths to estimate the price of European-style options.
-
Interactive graph to visualize up to 10,000 simulated paths.
-
Simulation
-
Each price path is modeled using the stochastic differential equation where:
-
Time step (trading days = 252/year)
-
Random variable sampled from a standard normal distribution
-
-
-
-
Stock Data Visualization
-
Historical stock prices with 20-day, 50-day, and 200-day moving averages.
-
Relative Strength Index (RSI) with overbought (70) and oversold (30) levels.
-
-
Next-Day Stock Price Prediction
- Predicts the next closing price using linear regression trained on historical stock data.
-
Streamlit-Based Interface
-
Interactive web interface with:
-
Input fields for stock ticker, strike price, volatility, risk-free rate, and time to maturity.
-
Option to select between Black-Scholes or Monte Carlo models.
-
Dynamic graphs for simulation paths and plot visualization.
-
-
-
Python 3.8 or higher
-
Required libraries:
-
numpy
-
pandas
-
scipy
-
sklearn
-
plotly
-
streamlit
-
yfinance
-
-
Install these dependencies using "pip install"
-
After navigating to the project directory, run using:
python -m streamlit run main.py
-
Select Pricing Model
- Choose either "Black-Scholes" or "Monte Carlo" from the sidebar.
-
Input Parameters:
-
Enter stock ticker symbol (e.g., AAPL).
-
Specify strike price, volatility, risk-free rate, time to maturity, and option type (call/put).
- The 10 year treasury yield is used for the risk free rate
-
If using Monte Carlo, adjust the number of simulation paths.
-
-
Visualize Results:
-
View historical stock price with moving averages and RSI.
-
See predicted next closing price.
-
Get the option price and Greeks for Black-Scholes or the simulated price paths for Monte Carlo.
-
-
main.py: Streamlit interface for the application.
-
stock_prediction.py: Handles data fetching, preparation, and price prediction.
-
MonteCarloBasic.py: Contains Monte Carlo simulation logic and interactive path visualization.
-
blackScholes.py: Implements the Black-Scholes model and Greeks calculation.
-
requirements.txt: Lists project dependencies.
-
Fork the repository.
-
Create a new branch:
git checkout -b feature-name -
Commit your changes:
git commit -m "Add new feature" -
Push to the branch:
git push origin feature-name -
Open a pull request.