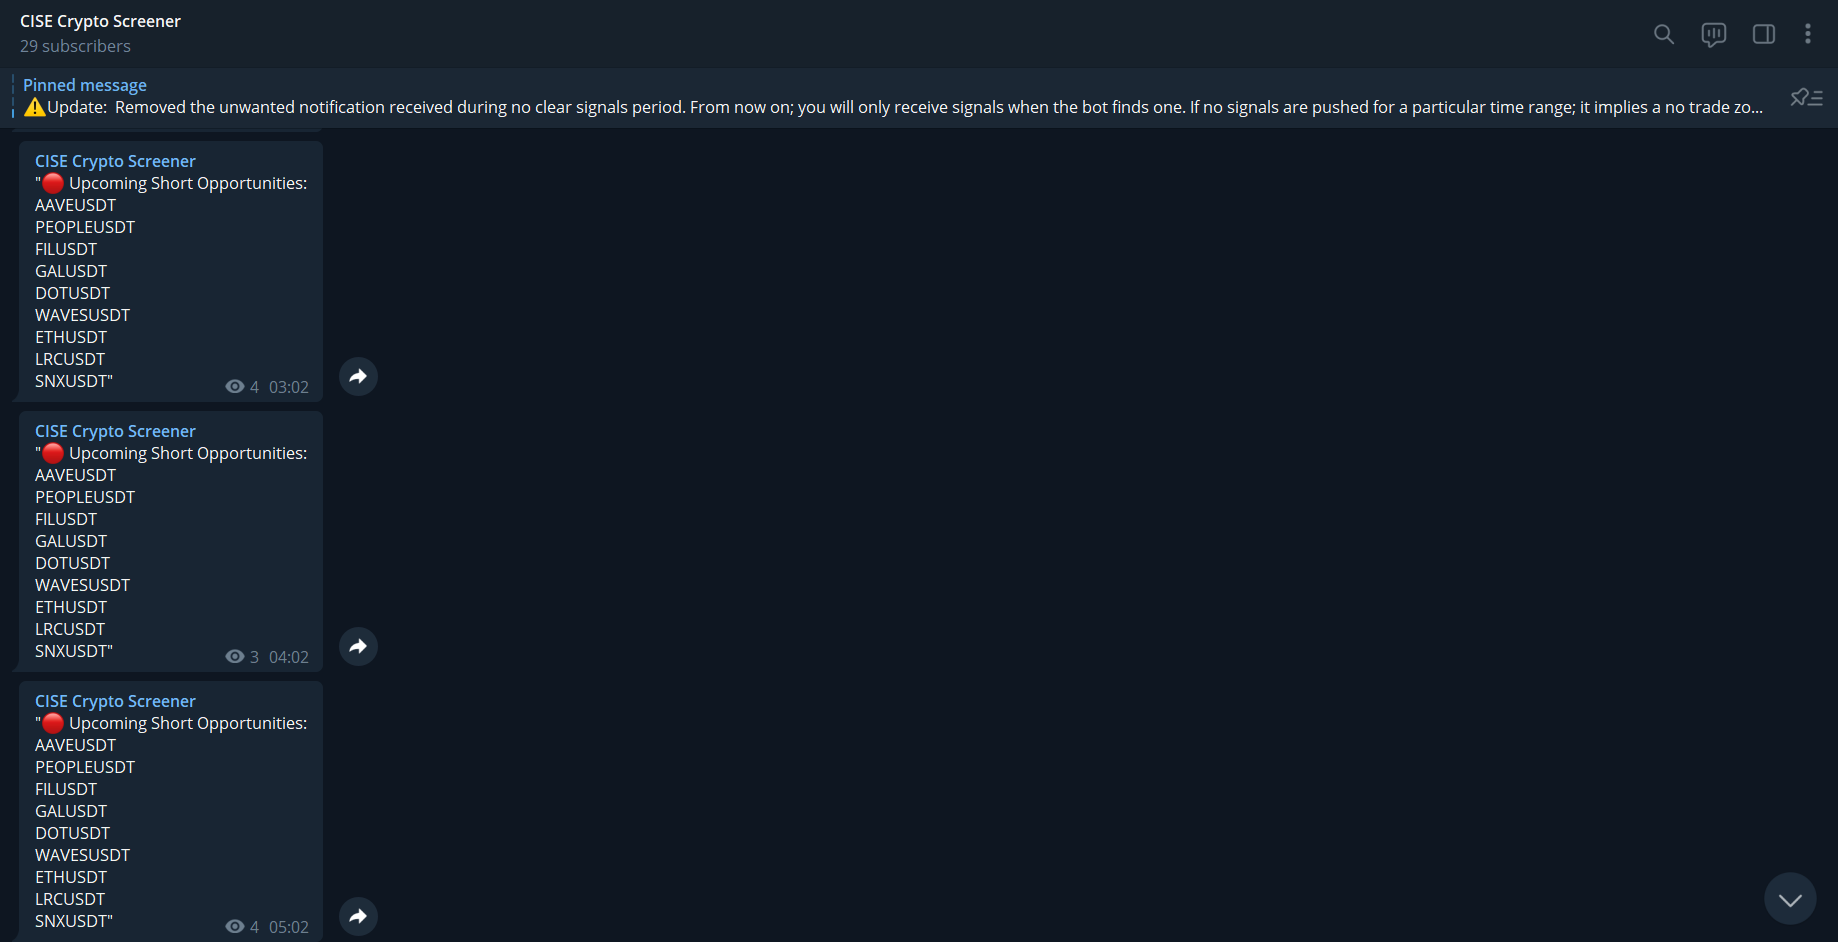
Code implementation for running automated crypto screener on hourly charts.
The CISE bot is a technical indicator that scans all the cryptocurrency futures Coin-M asset pairs hourly to find the pairs matching the technical conditions provided by the cise algorithm.
The complete algorithm used on the deployed CISE bot can be found in this report. The separate study and analysis for each indicators that combines together to form the CISE screener are of the following:
1. Central Pivot Range (CPR): Central Pivot Range (CPR) indicator is used to identify key points of price levels and trade accordingly. Traders can take up trading positions based on the different levels on the chart. It is quite popular among traders as it is quite versatile and simple to understand.
2. Initial Balance (IB): Initial Balance (IB) is the price data, which are formed during the first hour of a trading session. Activity of traders forms the so-called Initial Balance at this time. The market profile shows traders horizontal volumes, that is how many contracts or stocks were sold or bought at each price level.
Initial Balance can give a trader many hints in respect of how the trading session would develop. It sets the tone of the trading session. It often happens that activity and volumes of trades during the first hour have the bigger significance than during the following hours.
3. The Schaff Trend Cycle (STC) is a charting indicator that is commonly used to identify market trends and provide buy and sell signals to traders. Developed in 1999 by noted currency trader Doug Schaff, STC is a type of oscillator and is based on the assumption that, regardless of time frame, currency trends accelerate and decelerate in cyclical patterns.
4. Exponential Moving Average (EMA-200):
An exponential moving average (EMA) is a type of moving average (MA) that places a greater weight and significance on the most recent data points. The exponential moving average is also referred to as the exponentially weighted moving average. An exponentially weighted moving average reacts more significantly to recent price changes than a simple moving average simple moving average (SMA), which applies an equal weight to all observations in the period. In general, the 50- and 200-day EMAs are used as indicators for long-term trends. When a stock price crosses its 200-day moving average, it is a technical signal that a reversal has occurred. CISE bot uses the 200 period EMA for screening.
The material on this repository and the analysis has no regard to the specific investment objectives, financial situation, or particular needs of any user. This website is presented solely for informational and entertainment purposes and is not to be construed as a recommendation, solicitation, or an offer to buy or sell / long or short any securities, commodities, cryptocurrencies, or any related financial instruments. Nor should any of its content be taken as investment advice.
