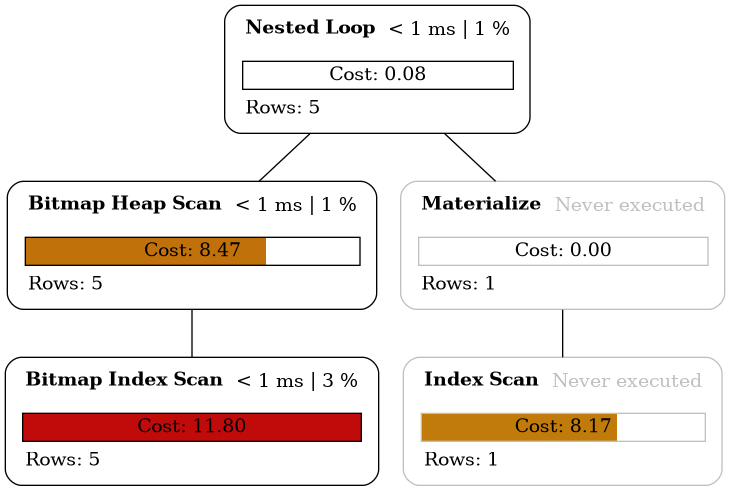
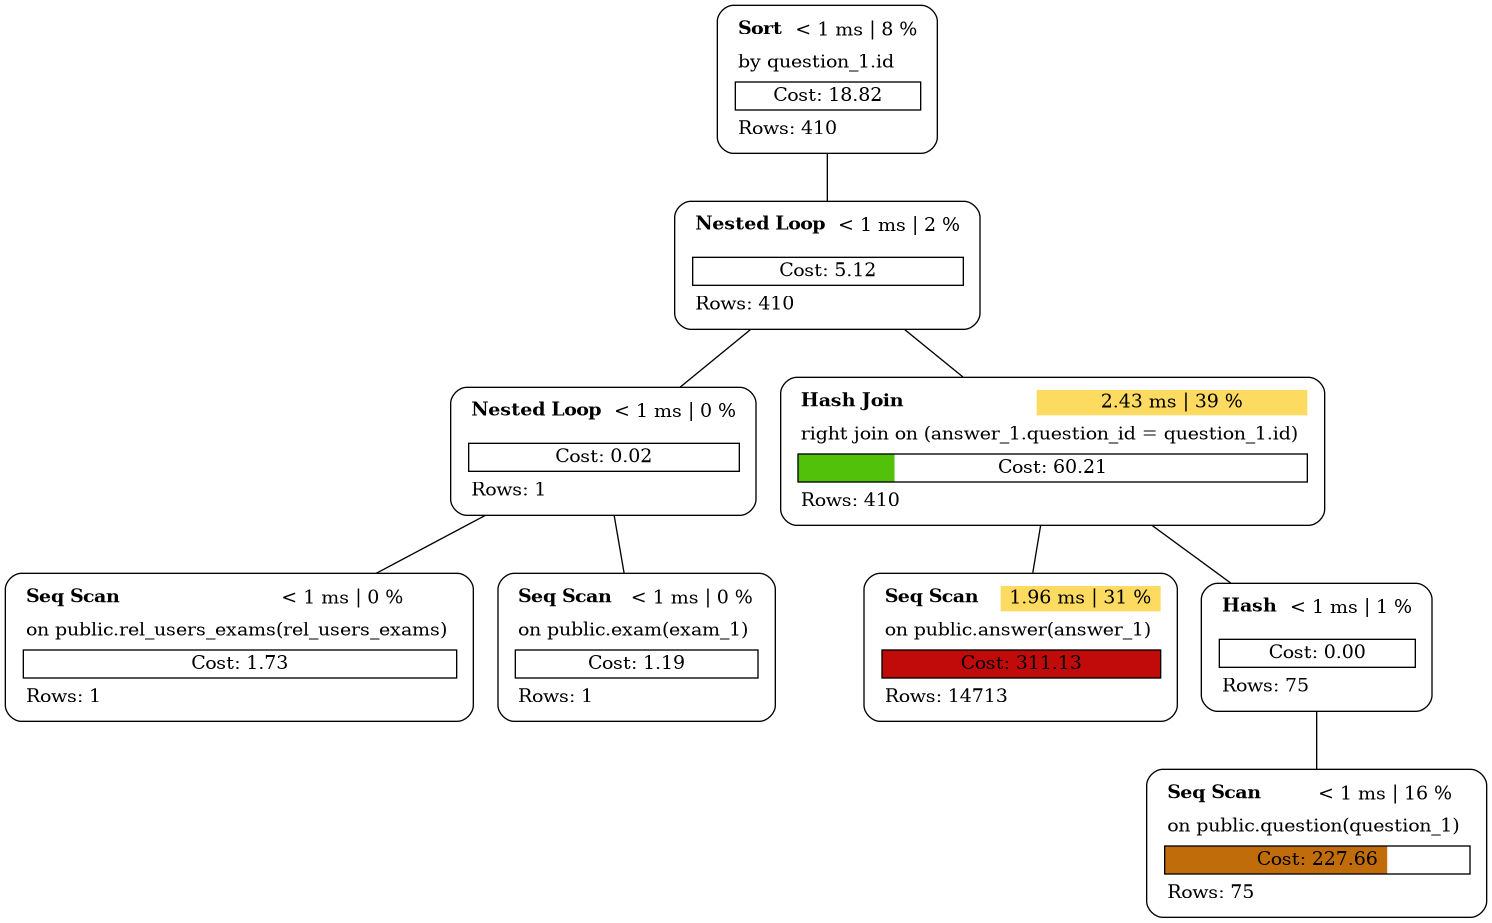
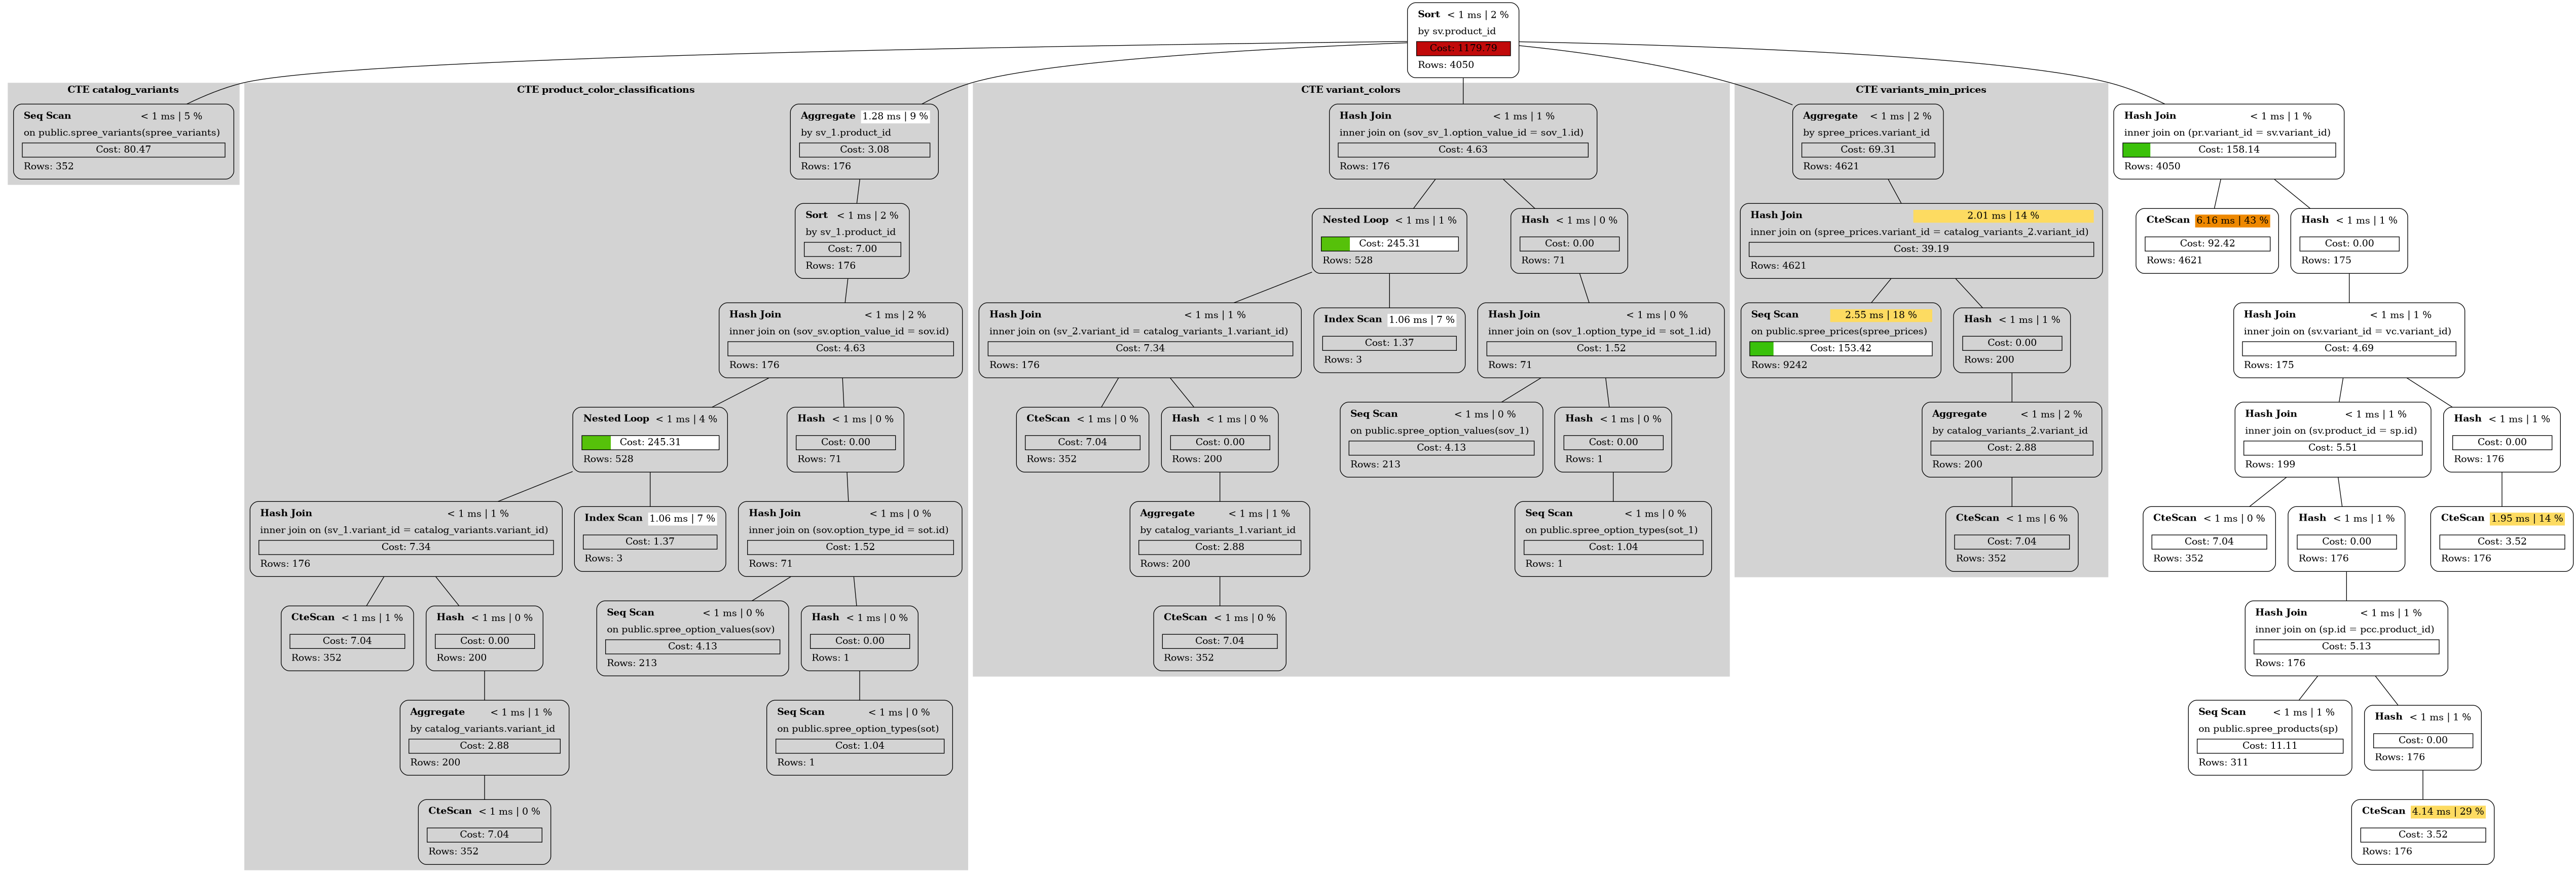
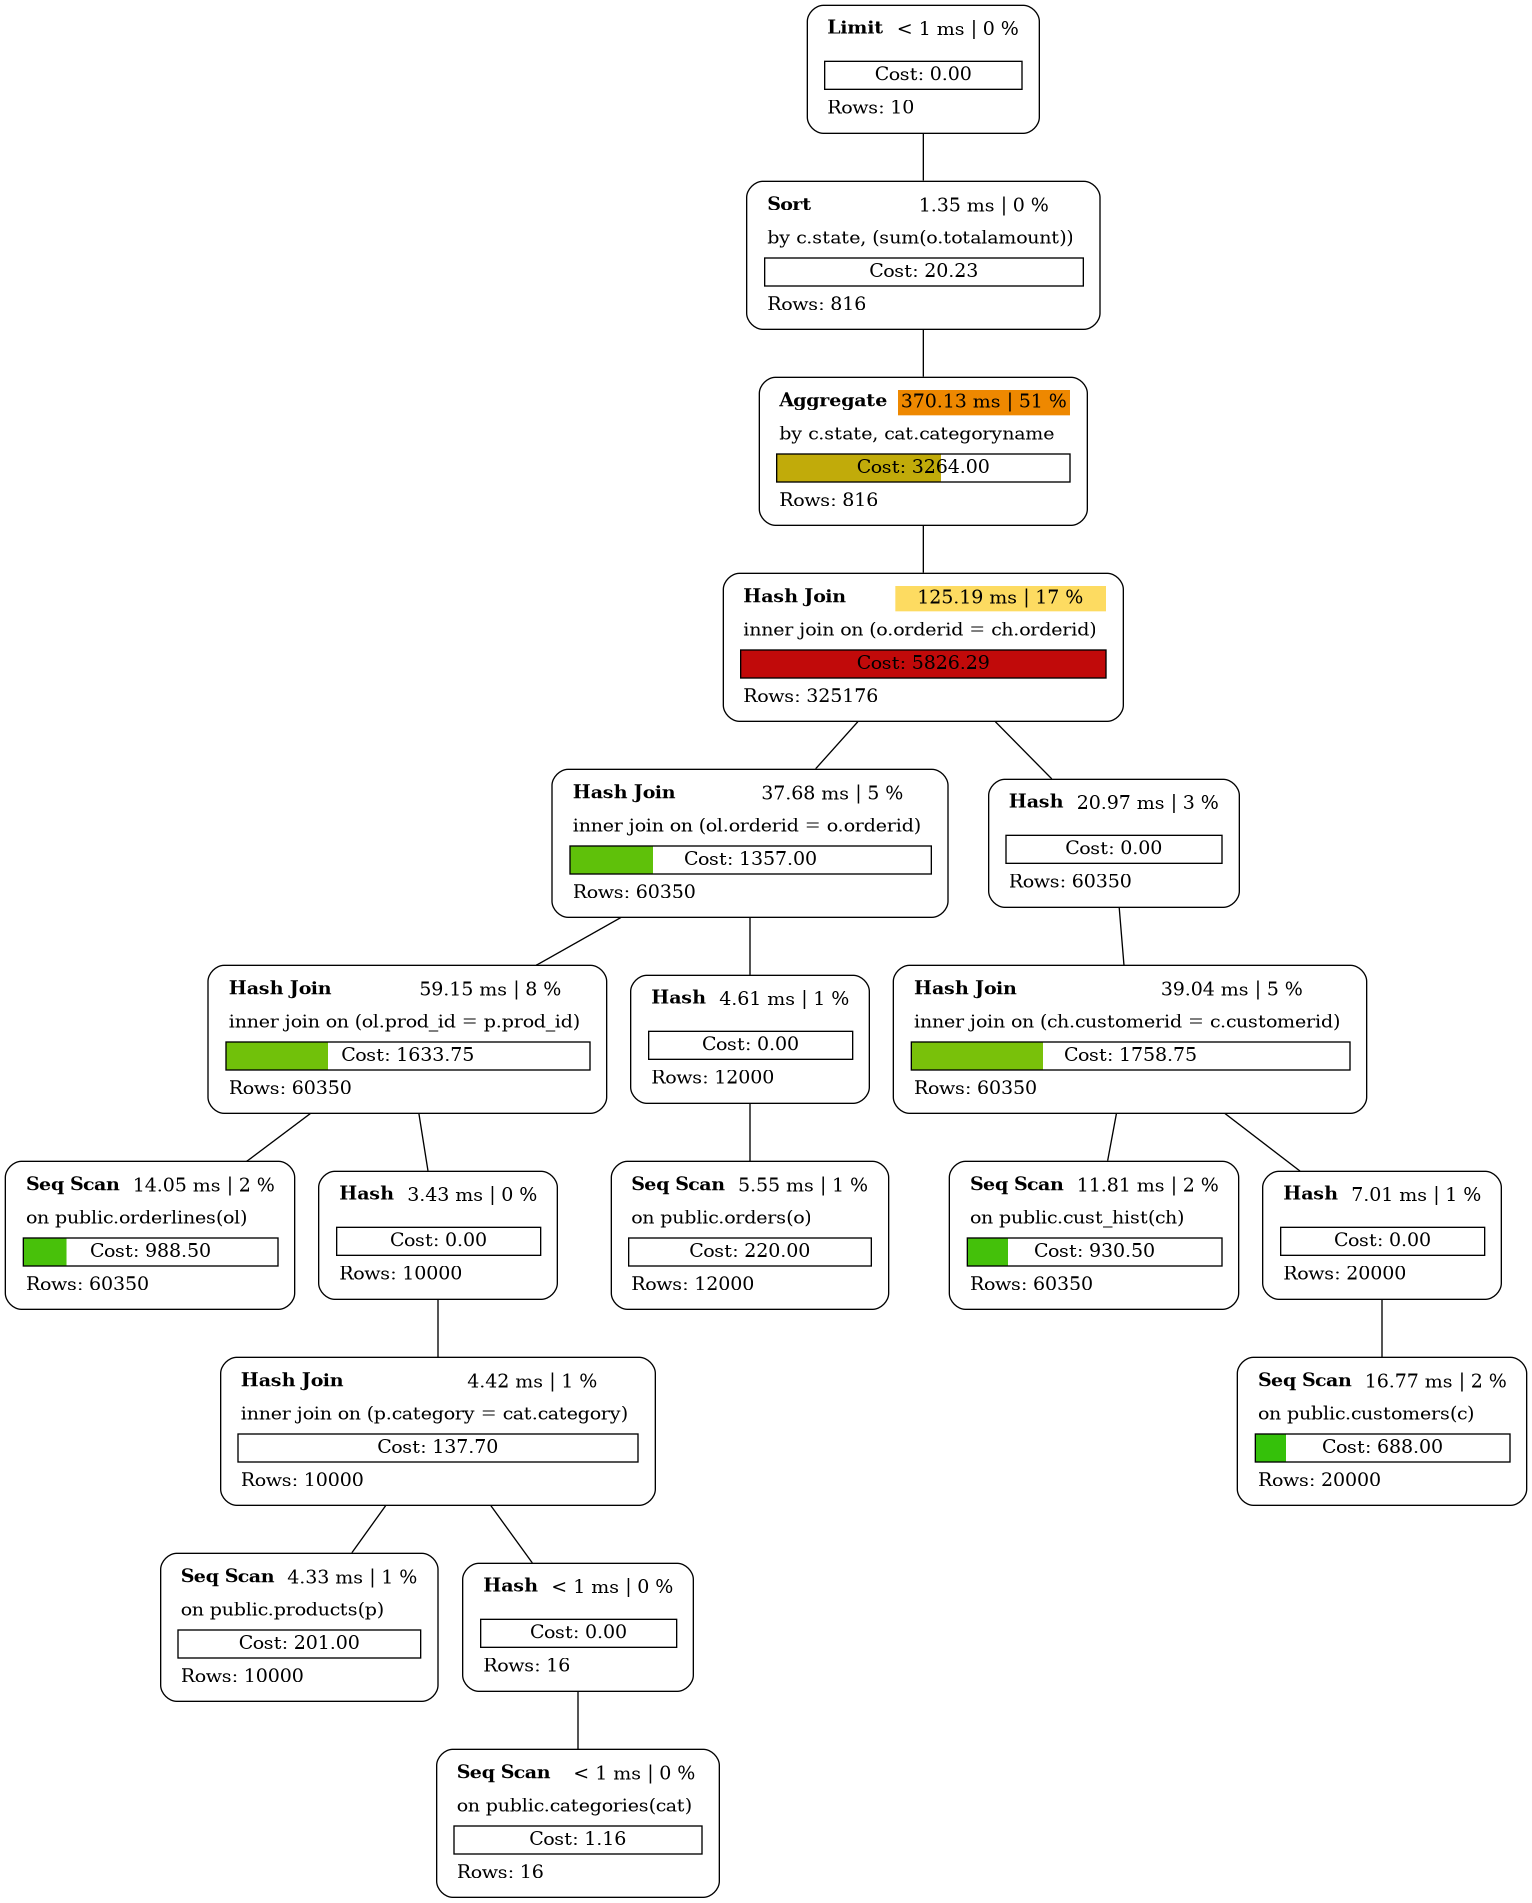
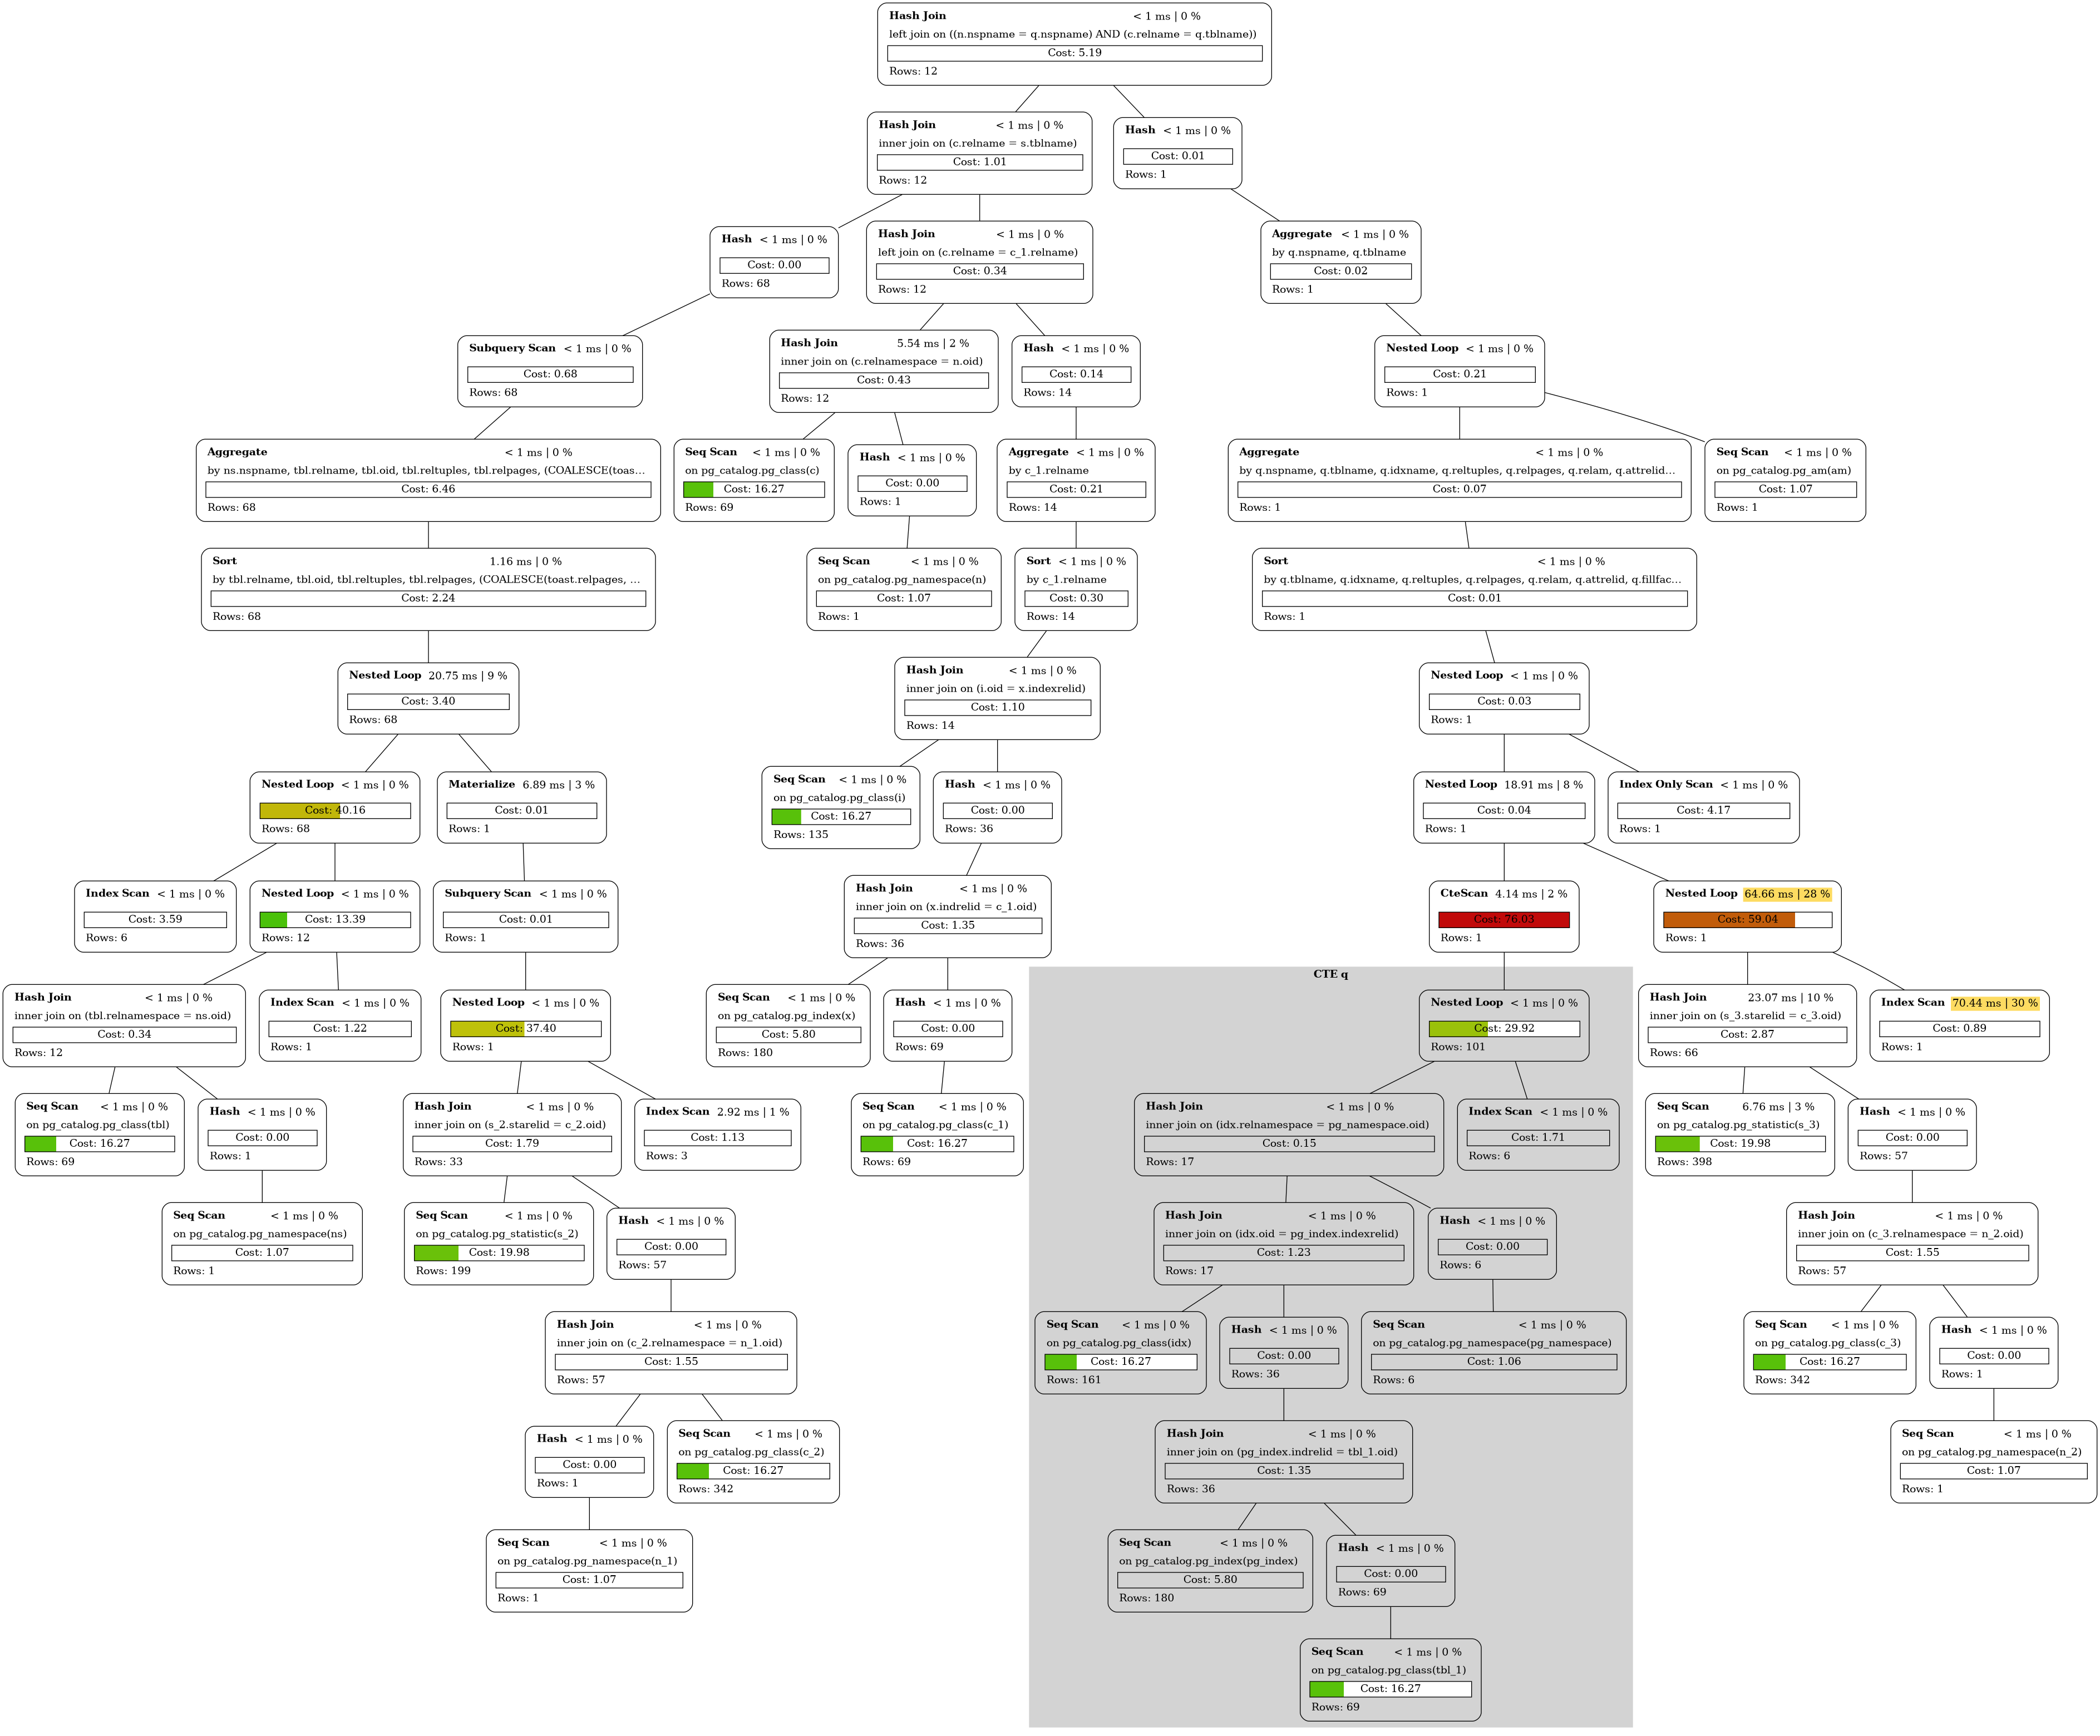
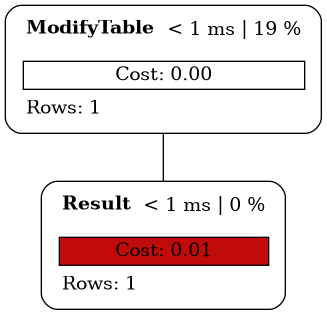
Transform postgresql explain to a graph.
If you use Arch Linux, explain is available in AUR.
git clone https://github.com/sanpii/explain
cd explain
make
sudo make install
Launch this program like psql and use dot to generate image:
$ explain --command 'select 1' database | dot -Tpng > explain.png
$ explain --help
explain 1.0.0

USAGE:
    explain [FLAGS] [OPTIONS] [dbname]

FLAGS:
        --analyse     this option executes explain analyse /!\ Be carful, that executes the query!
    -n, --dry-run     Don’t execute the query, the input is already an explain plan in JSON
        --help        Prints help information
    -W, --password    Prompt for a password before connecting to a database
    -V, --version     Prints version information

OPTIONS:
    -c, --command <command>    Specifies the command to execute
    -f, --file <file>          Read commands from the file, rather than standard input
    -h, --host <host>          Specifies the host name of the machine on which the server is running
    -o, --output <output>      Put output into file
    -p, --port <port>          Specifies the TCP port on which the server is listening for connections
    -U, --user <user>          Connect to the database as the user

ARGS:
    <dbname>    Specifies the name of the database to connect to
